bch 6.30.21 i actually made this chart quite a long time ago just off of pure horizontal level support resistance levels. i really like the way that Monero, Bcash, and Litecoin are all looking. it could be in a deeper retrace but im looking for a 3rd wave up as im feeling bullish. will go straight back up if bitcoin goes to 40k. very possible.
BCHUSD trade ideas
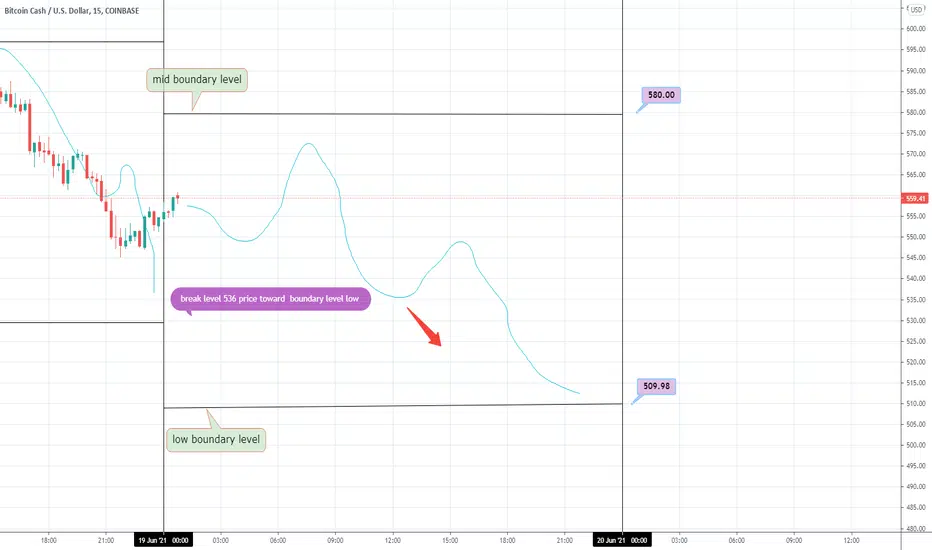
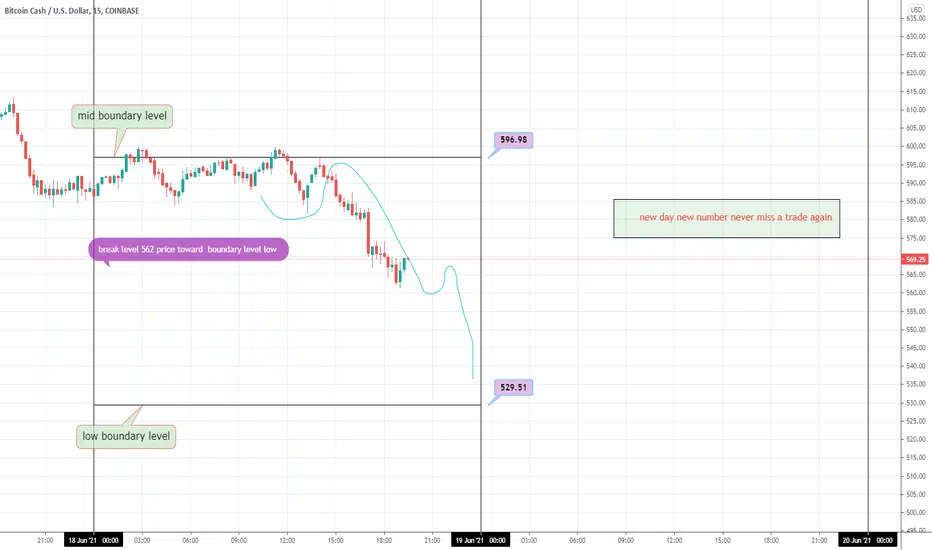
Bitcoin Cash will raise to the next supply zone!The price was stading on the demand zone for a while, it is time for an up trend correction.

BCHUSD D1: 1000% gains BEST LEVEL TO BUY/HOLD(SL/TP)(NEW)Why get subbed to me on Tradingview?
-TOP author on TradingView
-15+ years experience in markets
-Professional chart break downs
-Supply/Demand Zones
-TD9 counts / combo review
-Key S/R levels
-No junk on my charts
-Frequent updates
-Covering FX/crypto/US stocks
-24/7 uptime so constant updates
BCHUSD D1: 1000% gains BEST LEVEL TO BUY/HOLD(SL/TP)(NEW)
IMPORTANT NOTE: speculative setup. do your own
due dill. use STOP LOSS. don't overleverage.
READ ENTIRE IDEA BEFORE EXECUTING.
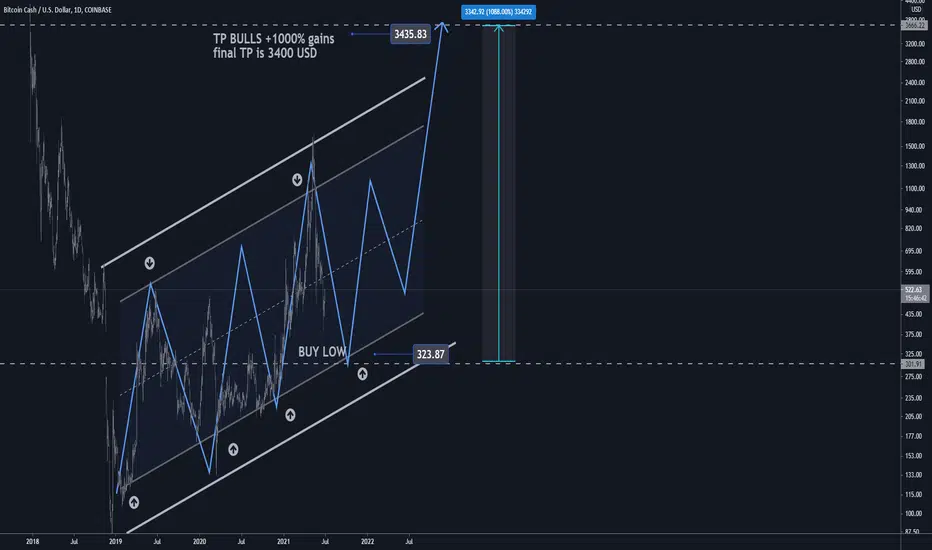
🔸 Summary and potential trade setup
::: BCHUSD 1days/candle chart review
::: updated outlook still valid today
::: CORRECTION MODE next 3-6 weeks
::: correction just started not OVER
::: chart is LOG SCALE
::: get ready to BUY LOW later
::: BUY LOW near 300/330 USD
::: entry - after 40% CORRECTION
::: up to 1000% gains possible later
::: short-term pullback/correction
::: correction/pullback NOW
::: however chart looks strong
::: SPECULATIVE SETUP
::: do your own due dill
::: and use proper risk management
::: TP bulls is +1000% gains
::: details: see chart
::: FINAL TP is 1000% gains
::: recommended strategy: BUY/HOLD after pullback
::: TP BULLS +1000% gains
::: SWING TRADE: BUY/HOLD IT
::: bull run not over yet
::: good luck traders!
::: BUY/HOLD and get paid. period.
🔸 Supply/Demand Zones
::: N/A
::: N/A
🔸 Other noteworthy technicals/fundies
::: TD9 /Combo update: N/A
::: Sentiment mid-term: BEARS/CORRECTION
::: Sentiment short-term: PULLBACK/CORRECTION NOW
RISK DISCLAIMER:
Trading Crypto, Futures , Forex, CFDs and Stocks involves a risk of loss.
Please consider carefully if such trading is appropriate for you.
Past performance is not indicative of future results.
Always limit your leverage and use tight stop loss.
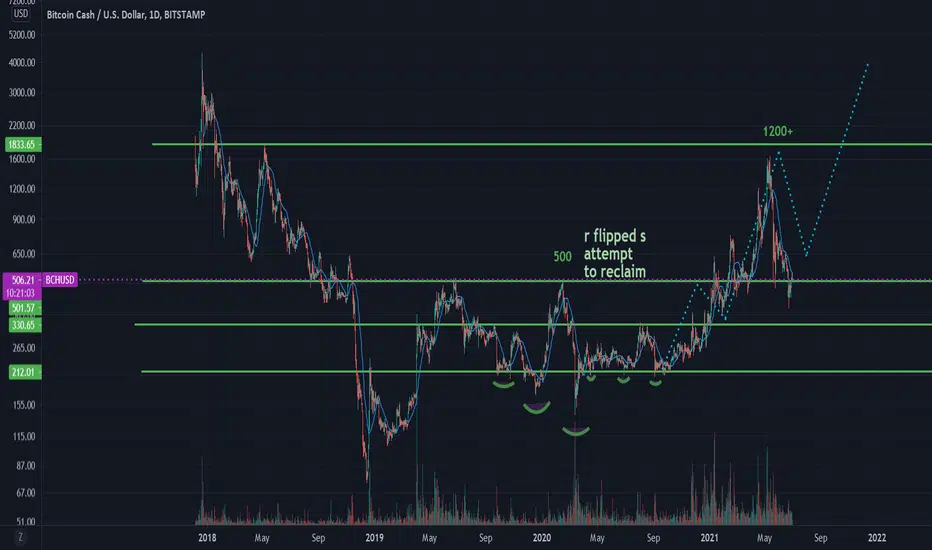
BCH Mirroring it's 2017 run?I've measured the weeks from November 4th 2019 to each significant and in some cases insignificant top recently and they seem to be mirroring. Also the pattern seems to match the prediction of the S2F model where the price will rise in July with a significant rise in September. The following is my prediction of what the next few months could look like for BCH.
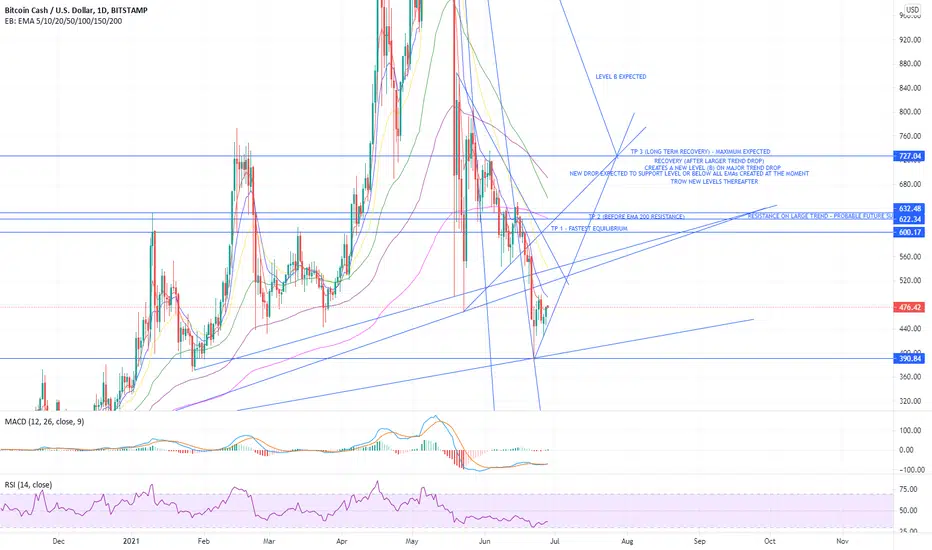
BITCOIN CASH - SHORT AND LARGE TPSame analysis with a bit of more information of:
I am sharing my operating trades with my personal analysis on the market. Let me know what you think, comments are welcome, if i am wrong on something or you have a difference perspective comments are welcome.
I don’t put stop losses on my trade as I use risk management of capital, and buy on low price. I close them manually when I feel my investment hasn’t done well or in a break-even situation which has worked well for me on the long run, I don’t use much leverage as for me trades are like an investment where you TP when it has hit your target or close them when you want to, trying to make sure that what you have earned at the end of the month surpasses your risk or losses, always watching RSI and EMAs from different timeframes as price normally fluctuates. I do not risk what I can’t afford to lose. Don’t trade what you cannot afford to lose on each trade, or if not suitable use stop-loss.
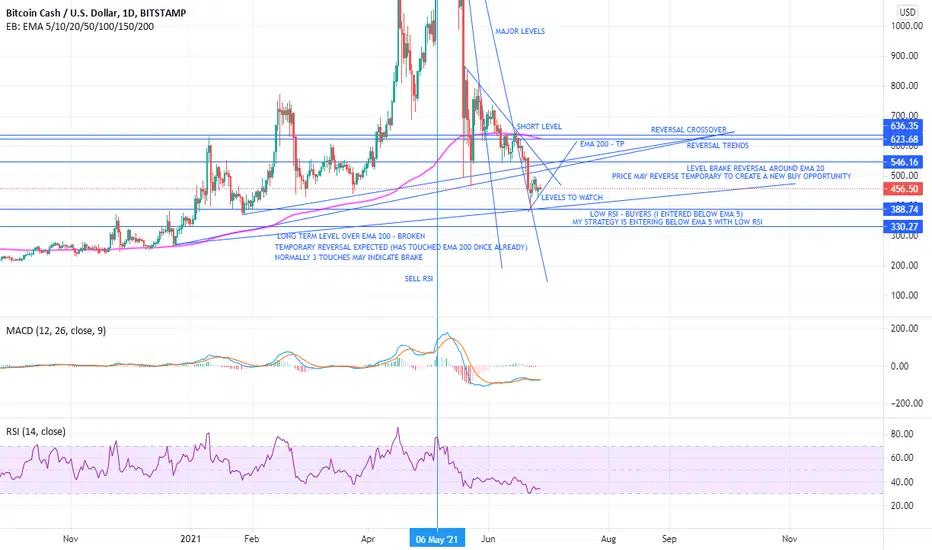
BITCOIN CASH - SHORT BUY TPI am sharing my operating trades. Let me know what you think, comments are welcome.
I don’t put stop losses on my trade as I use risk management of capital, and buy on low price. I close them manually when I feel my investment hasn’t done well or in a break-even situation which has worked well for me on the long run, I don’t use much leverage as for me trades are like an investment where you TP when it has hit your target or close them when you want to, trying to make sure that what you have earned at the end of the month surpasses your risk or losses, always watching RSI and EMAs from different timeframes as price normally fluctuates. I do not risk what I can’t afford to lose. Don’t trade what you cannot afford to lose on each trade, or if not suitable use stop-loss.
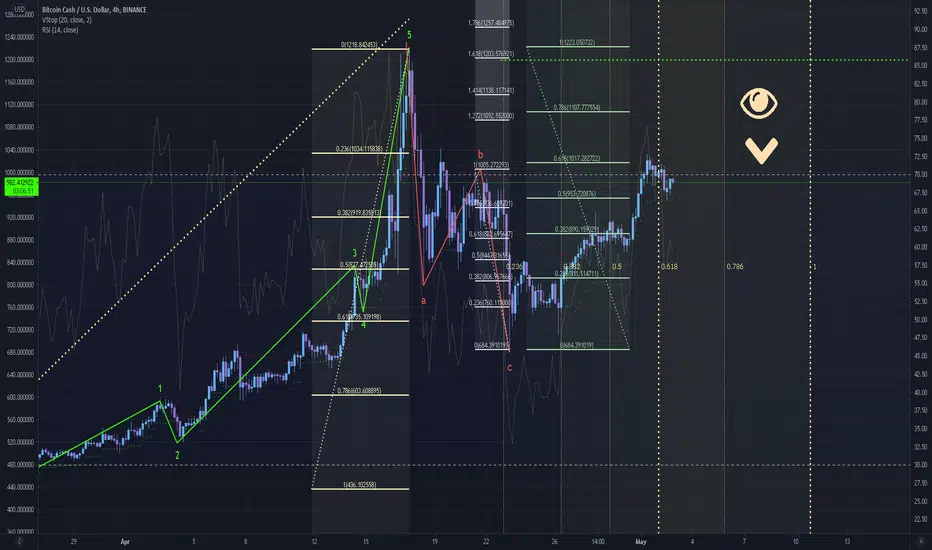
Looking for a downturn on Bitcoin Cash BCHUSDI just don't believe yet that we are impulsing again. This one is more likely to drop before it rises again.
FUTURE PRICE WAYPOINTSAlmost all the crypto's have done with price reset.
Now its the time for Long positions but it will take a while.
Most of retail brokers are going to either reduce the leverage or disable trading on the derivatives of Cryptocurrency due to the fact that they will loose lot of money by offering a leverage. We all know Brokers do not want their customer to make money_That's just business.

Buying opportunity of a lifetime! HODL till 4k!this is not financial advice nor fine aunt shall add vice

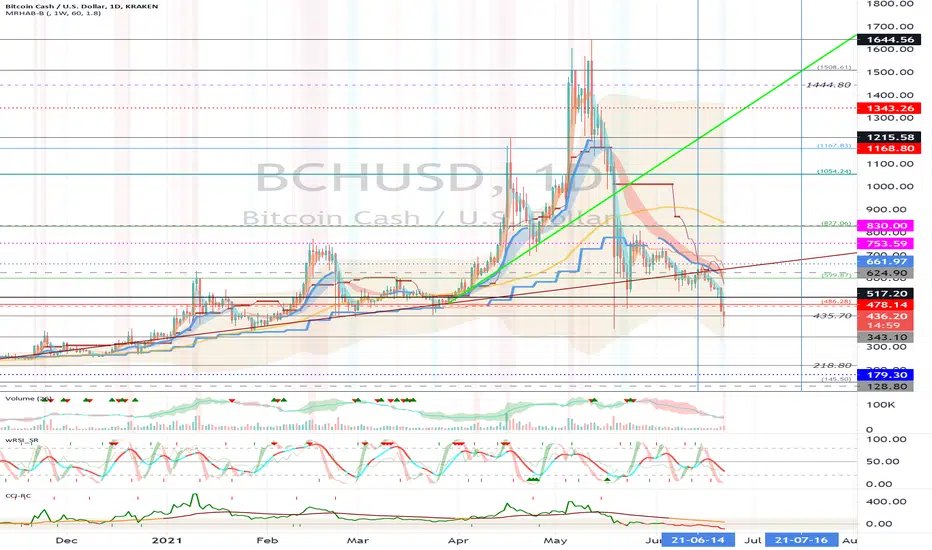
Bitcoin Cash (BCH) - June 23Hello?
Welcome, traders.
By "following", you can always get new information quickly.
Please also click "Like".
Have a good day.
-------------------------------------
(BCHUSD 1W Chart)
If the price holds above the 517.20 point, it is expected to turn into an uptrend.
(1D chart)
We need to see if we can find support at 435.70 and move up to the 486.28-599.87 section.
If it declines from the 343.10 point, there is a possibility of entering the mid- to long-term investment area, so careful trading is required.
The price should remain in the range 599.87-827.06 to convert into an uptrend.
However, it is recommended to check the BTC price movement as there is a possibility that the price may fluctuate depending on the movement of the BTC price.
-------------------------------------
(BCHBTC 1W chart)
You need to make sure you can sustain the price in the big box range 0.011530-0.048430.
In order to turn into an uptrend, the price must rise above the 0.024777 point and hold the price.
(1D chart)
We should see support at the 0.013651 point and see if we can move towards the 0.014655-0.016063 section.
If it continues to fall, it could touch the 0.011530 point, so you need to think about how to react.
The price should remain in the 0.016063-0.018878 range to convert into an uptrend.
------------------------------------------
We recommend that you trade with your average unit price.
This is because, if the price is below your average unit price, whether it is in an uptrend or in a downtrend, there is a high possibility that you will not be able to get a big profit due to the psychological burden.
The center of all trading starts with the average unit price at which you start trading.
If you ignore this, you may be trading in the wrong direction.
Therefore, it is important to find a way to lower the average unit price and adjust the proportion of the investment, ultimately allowing the funds corresponding to the profits to regenerate themselves.
------------------------------------------------------------ -----------------------------------------------------
** All indicators are lagging indicators.
Therefore, it is important to be aware that the indicator moves accordingly with the movement of price and volume.
However, for the sake of convenience, we are talking in reverse for the interpretation of the indicator.
** The wRSI_SR indicator is an indicator created by adding settings and options to the existing Stochastic RSI indicator.
Therefore, the interpretation is the same as the traditional Stochastic RSI indicator. (K, D line -> R, S line)
** The OBV indicator was re-created by applying a formula to the DepthHouse Trading indicator, an indicator disclosed by oh92. (Thanks for this.)
** See support, resistance, and abbreviation points.
** Support or resistance is based on the closing price of the 1D chart.
** All descriptions are for reference only and do not guarantee a profit or loss in investment.
Explanation of abbreviations displayed in the chart
R: A point or section of resistance that requires a response to preserve profits.
S-L: Stop Loss point or section
S: A point or section where you can buy to make a profit as a support point or section.
(Short-term Stop Loss can be said to be a point where profit and loss can be preserved or additional entry can be made through split trading. It is a short-term investment perspective.)
GAP refers to the difference in prices that occurred when the stock market, CME, and BAKKT exchanges were closed because they are not traded 24 hours a day.
G1 : Closing price when closed
G2: Opening price
(Example) Gap (G1-G2)
$BCH = Higher Highs, Higher LowsHigher highs higher lows with trend line and MA providing support on last correction
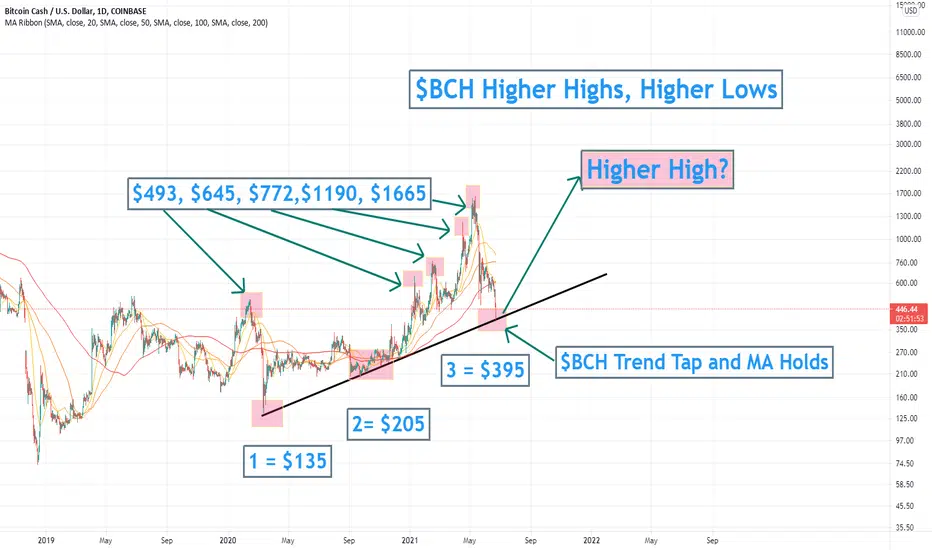
$BCH= Higher highs, higher lowsA Bull market is recognized as Higher highs and higher lows. $BCH, while extremely volatile has exhibited the HH $ HL's and has even held above both its weekly MA and Trendline after our last correction. New Highs head? Time will tell

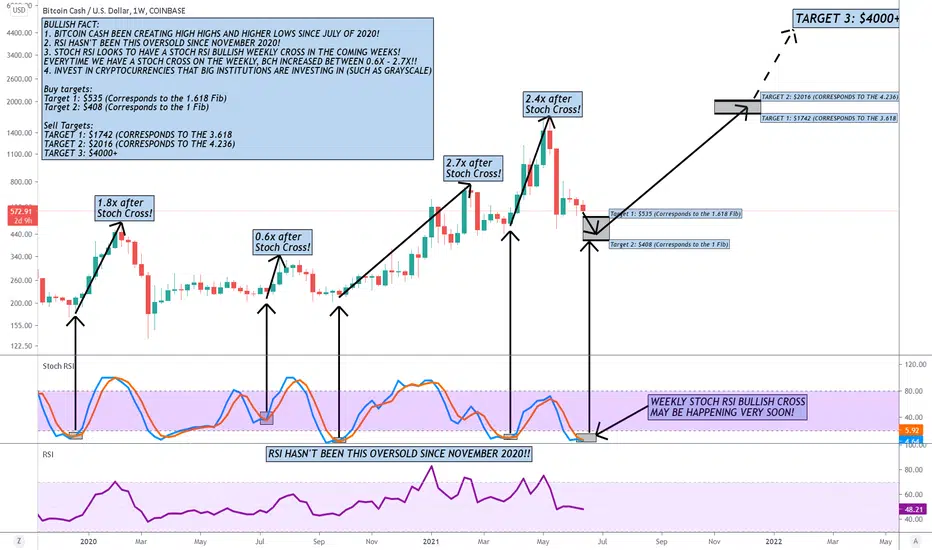
Bitcoin Cash (BCH) - Bullish Stochastic RSI cross coming soon??The ELITES will win this game and they are causing fear in the market so they can buy cheaper. DO NOT LET THEM WIN THIS TIME! Facts are in the charts!
PLEASE LET ME KNOW WHAT YOU THINK OF THE ANALYSIS.
Still in a bearish trend until confirmation of the Bullish Stochastic RSI Cross on the weekly!
BULLISH FACT:
1. BITCOIN CASH BEEN CREATING HIGH HIGHS AND HIGHER LOWS SINCE JULY OF 2020!
2. RSI HASN'T BEEN THIS OVERSOLD SINCE NOVEMBER 2020!
3. STOCH RSI LOOKS TO HAVE A STOCH RSI BULLISH WEEKLY CROSS IN THE COMING WEEKS!
EVERYTIME WE HAVE A STOCH CROSS ON THE WEEKLY, BCH INCREASED BETWEEN 0.6X - 2.7X!!
4. INVEST IN CRYPTOCURRENCIES THAT BIG INSTITUTIONS ARE INVESTING IN (SUCH AS GRAYSCALE)
Buy targets:
Target 1: $535 (Corresponds to the 1.618 Fib)
Target 2: $408 (Corresponds to the 1 Fib)
Sell Targets:
TARGET 1: $1742 (CORRESPONDS TO THE 3.618
TARGET 2: $2016 (CORRESPONDS TO THE 4.236)
TARGET 3: $4000+
Good Luck!
"If you can't beat the fear, do it scared!"
"Be fearful when others are greedy, and greedy when others are fearful!" - Warren Buffet.
"Markets are a device for transferring money from the impatient to the patient. - Warren Buffet
"Show me the charts, and I'll tell you the news." - Bernard Baruch
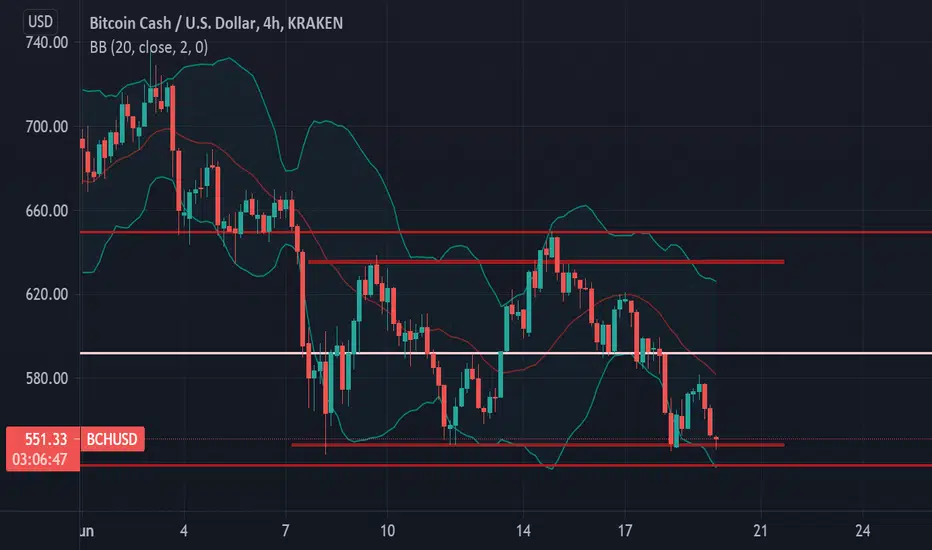
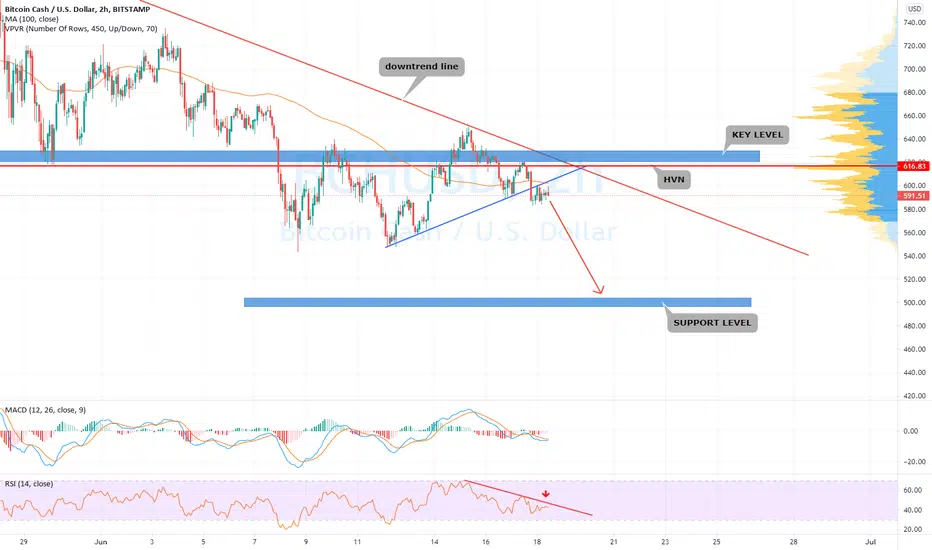
BITCOIN CASH ANALYSISBCHUSD trading in downtrend line
price rebounded from key level around 630
price below HVN around 620
price below SMA 100
RSI in downtrend line below 50
so its expect bearish movement to support level around 500
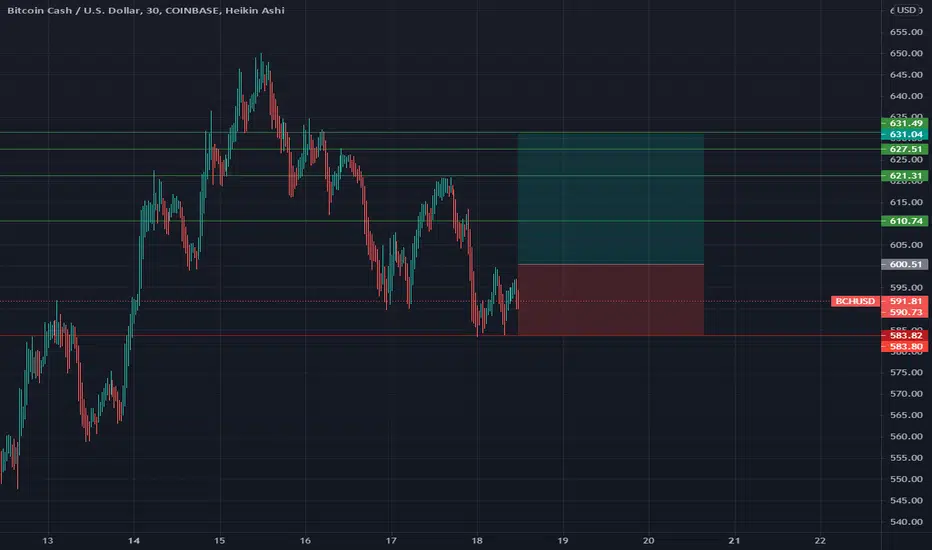
BCHUSD Go LongKey Levels
Buy @ 600.51
SL @ 583.82
TP 1 @ 610.74
TP 2 @ 621.31
TP 3 @ 627.51
TP 4 @ 631.49
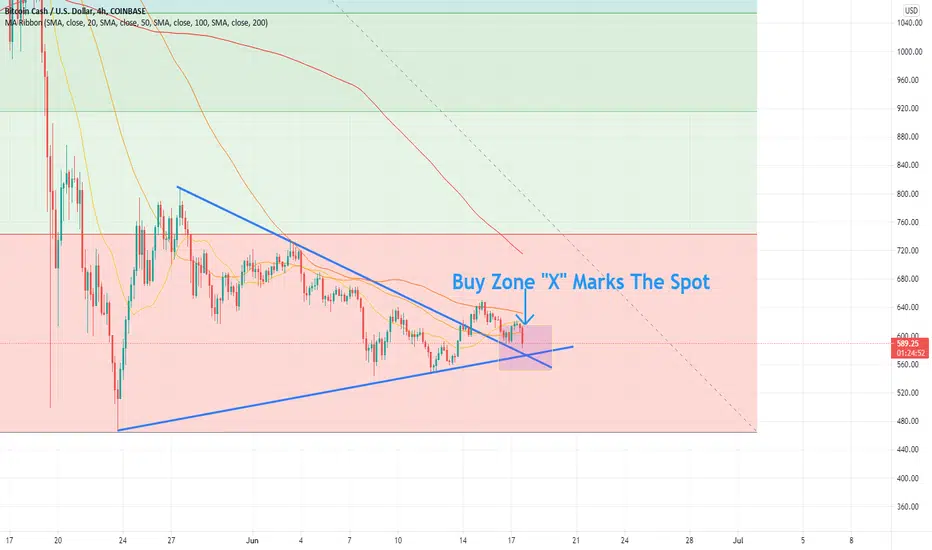
$BCH Update I have left my drawings from yesterday and today we are nearing the "X". Unless $BTC breaks down further, this is the buy zone.
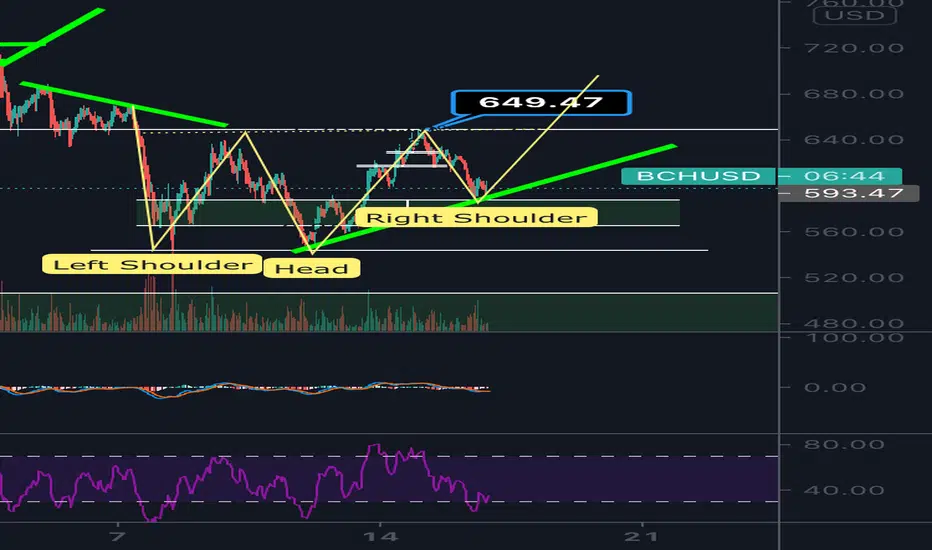
BchI tried to post this idea but for some reason it didn’t confirm the post that I see. I’m looking at a potential inverse head and shoulders here. I put a long in at 596 stoploss 586. Looks pretty solid. Neckline 650. Target 750$
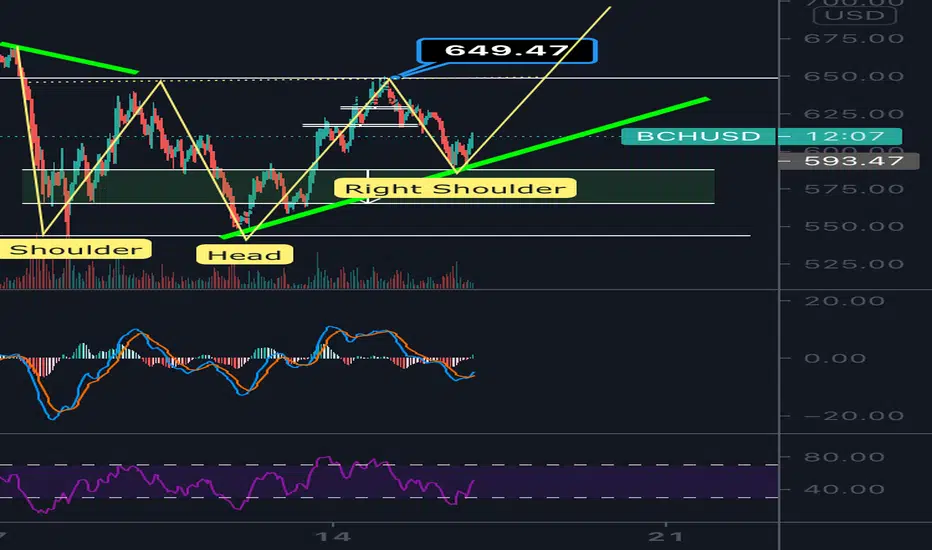
BchJust as an idea. Potential ascending traingle here. With an inverse head and shoulders trend reversal set up. Neckline is 650$ Target would be 750$ Main objective is to maintain above 590-588