BCHUSD trade ideas

BCH, With A Potential Finalization Of H-S-Formation Upcoming!Hi,
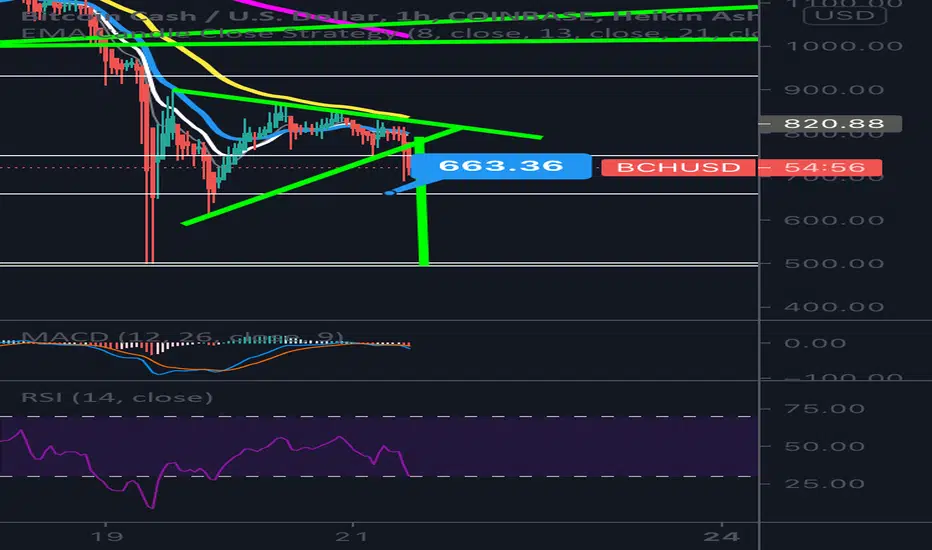
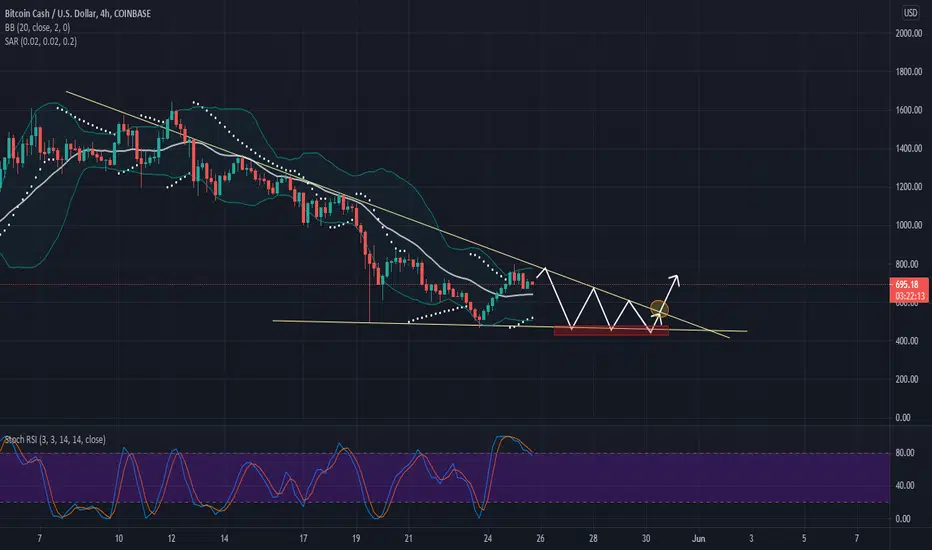
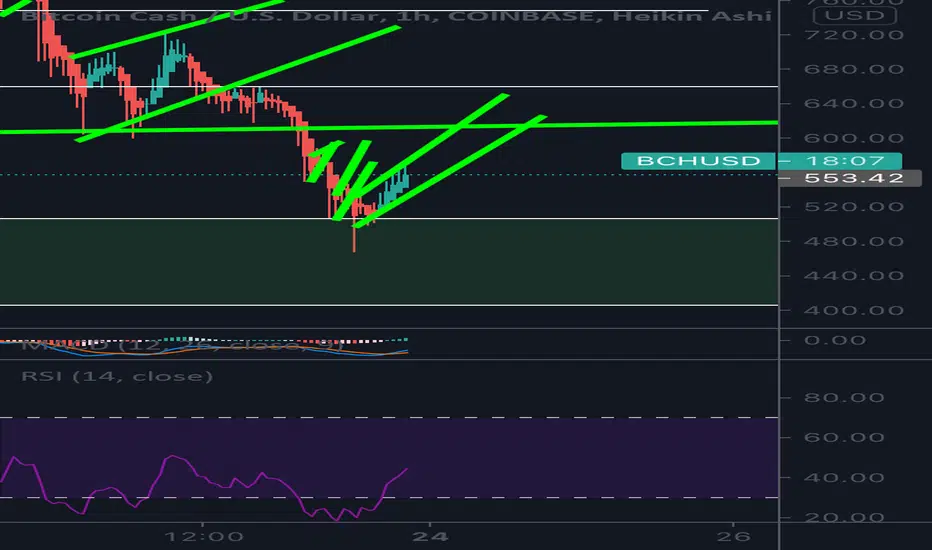
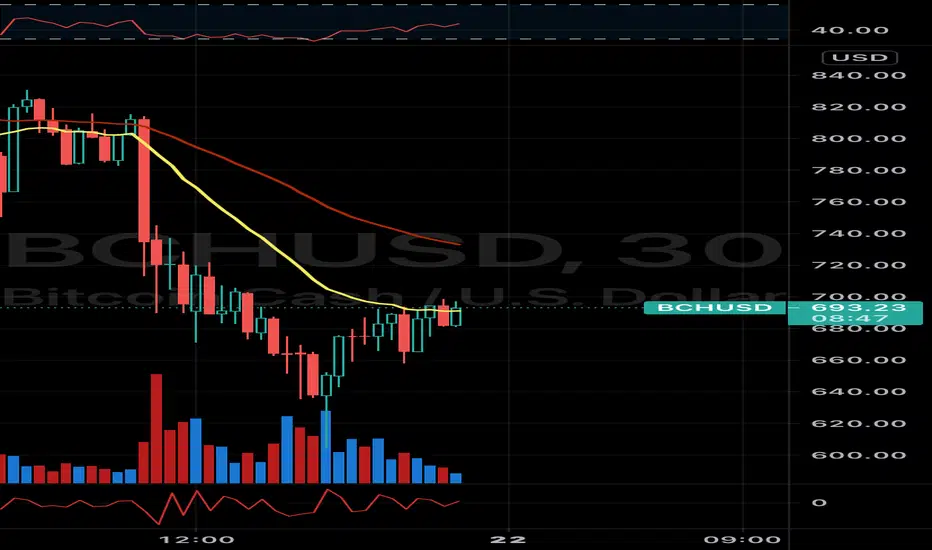
Welcome to this analysis about Bitcoin Cash, we are looking at the 45-minute timeframe perspectives. As Bitcoin Cash recently bounced in the structure and is somewhat holding the range I discovered a very interesting formation developing which is actually an inverse head-and-shoulder-formation with the left shoulder and the head already completed and now Bitcoin Cash is about to form the left shoulder in the structure, therefore, when Bitcoin Cash manages to bounce within the 100-EMA in red and the ascending-support in dashed-grey lying also in this structure this can be the sufficient origin of a breakout above the neckline which will complete the formation bullishly to the upside and will activate further continuations with the testing of resistances upper in the structure.
In this manner, thank you for watching the analysis and great contentment for everybody supporting, all the best!
"There are many roads to prosperity but one must be taken."
Information provided is only educational and should not be used to take action in the market.

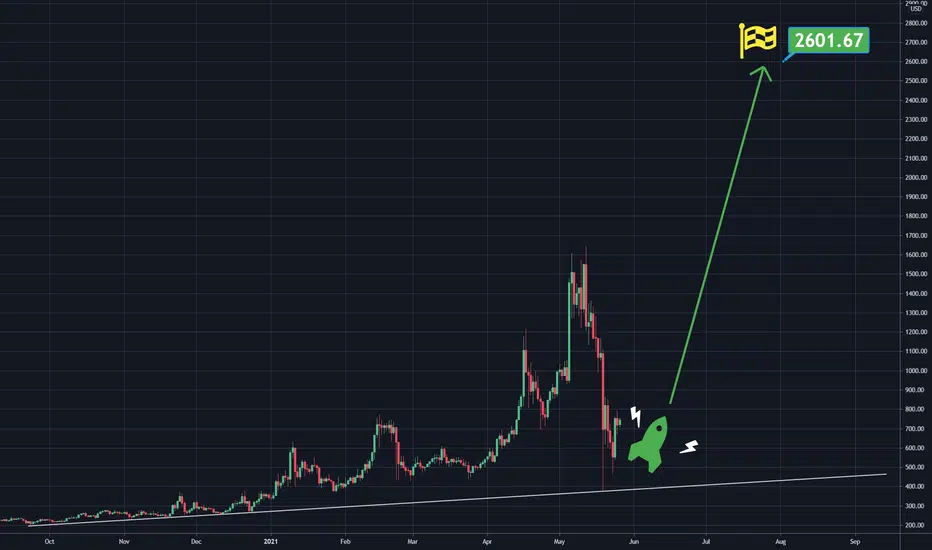
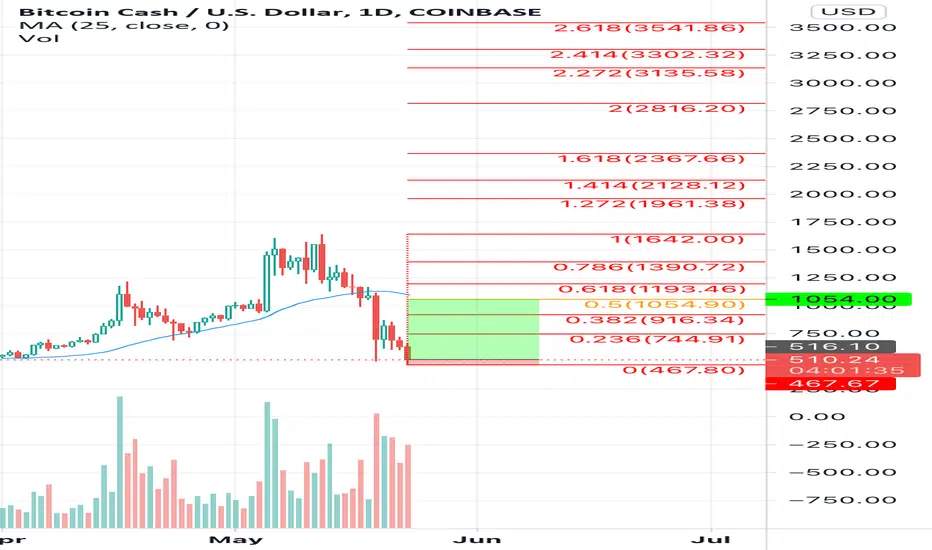
BCH trainnow is a good time to go long.. bottom was around $250 in the last 3 years.. we dip as low as $471 two days ago.. 3 months from now we might see this around $2k hopefully!!
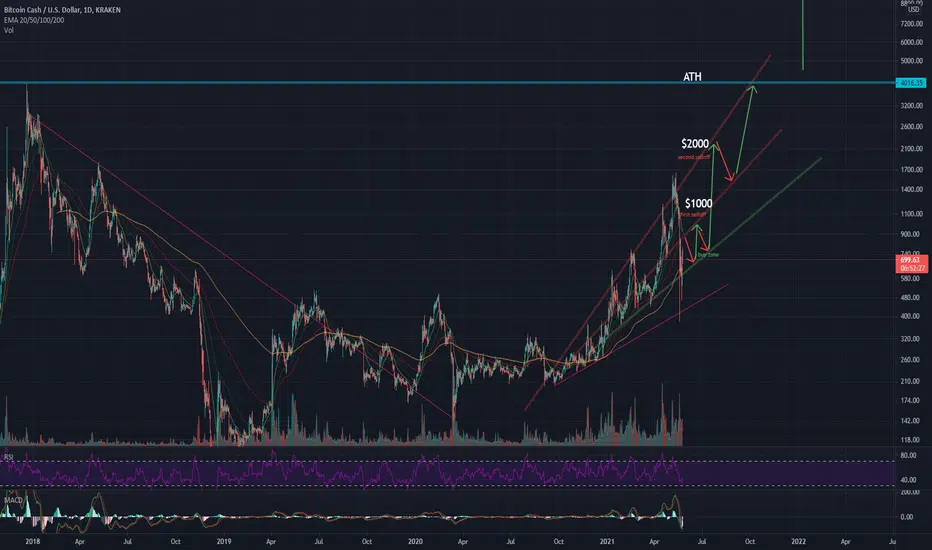
BCH SLOWING DOWN THEN BULLISHwere going to hit the first selloff point at around 1000 drop back down to the buy zone around 700 then takeoff to 2000.
not financial advice.
HODL!
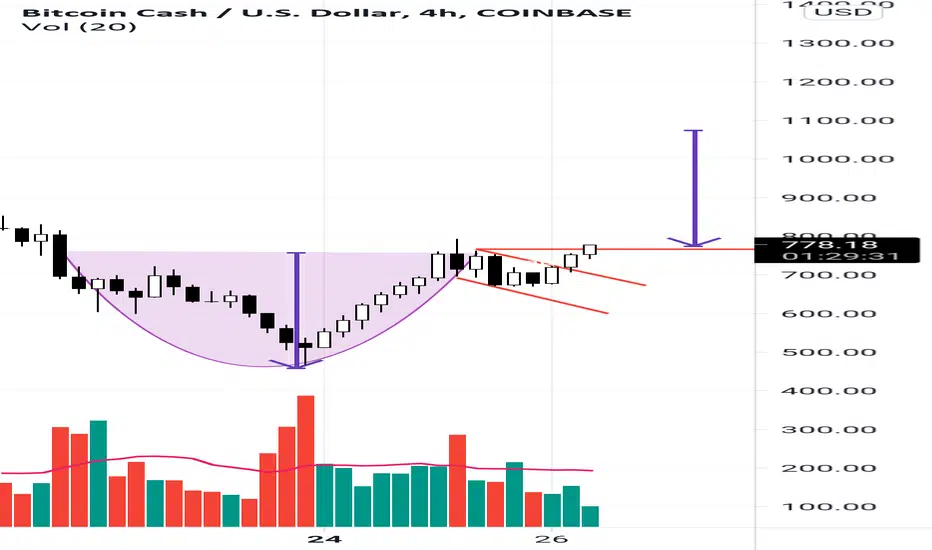
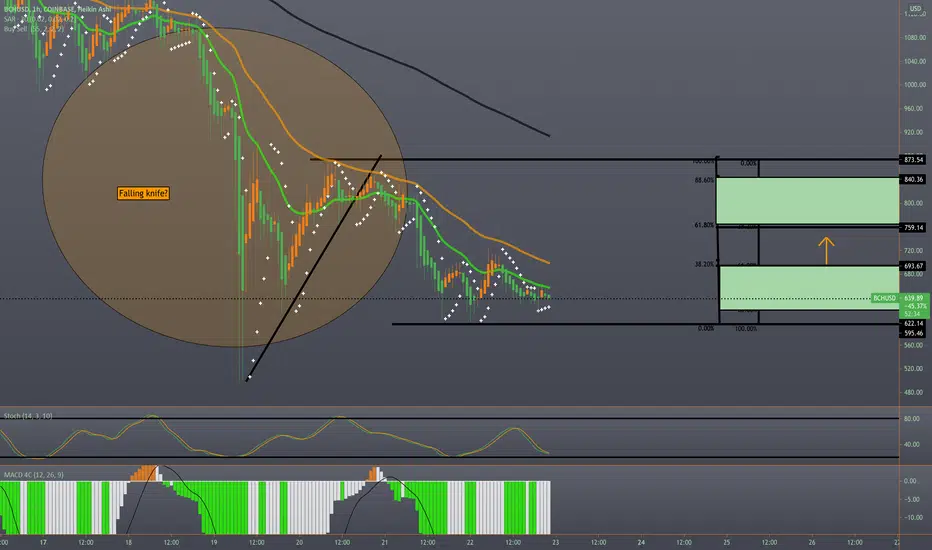
BchClearer view here. I went long around 615 as I talked about this morning how 611 was critical area. From this 747 area seeming to hold as of now I’m feeling this should be an easy run to my targeted mark. There we will find some stronger resistance
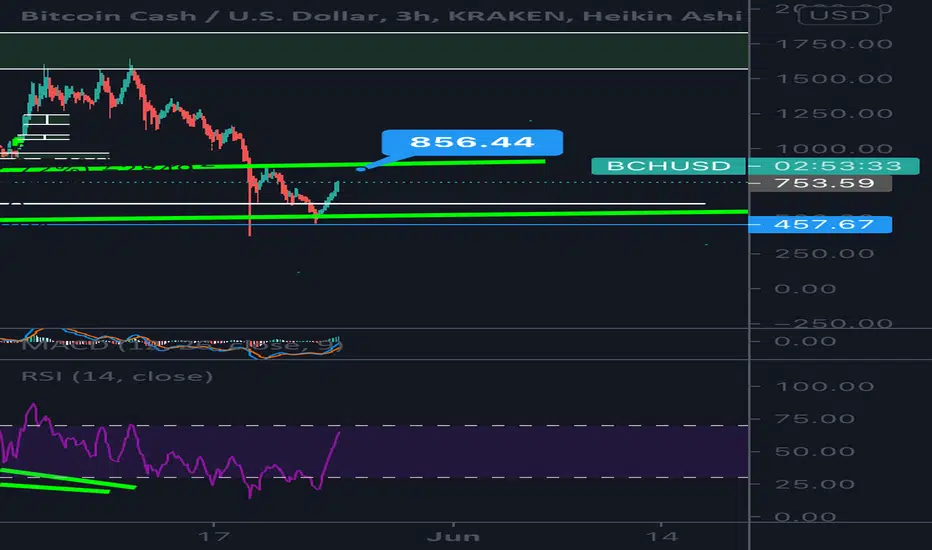
BchIf it can reclaim 747 as new support this could be pretty damn bullish short -mid term here
738-742 is also an area of confluence as a recent breakout from consildation below there
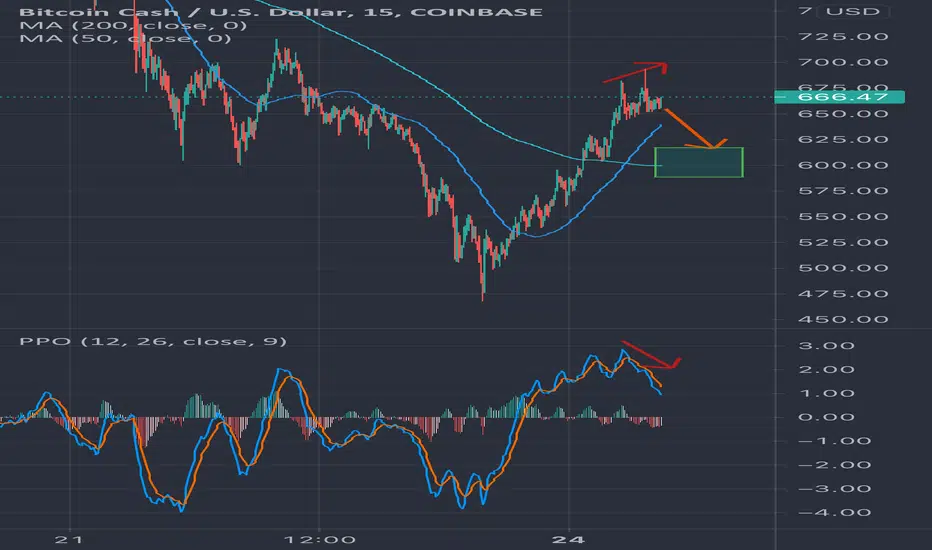
Bitcoin Cash back to $600?Spotted divergence between PPO on 15 min chart, reasonable to expect low $600 price point shortly here.
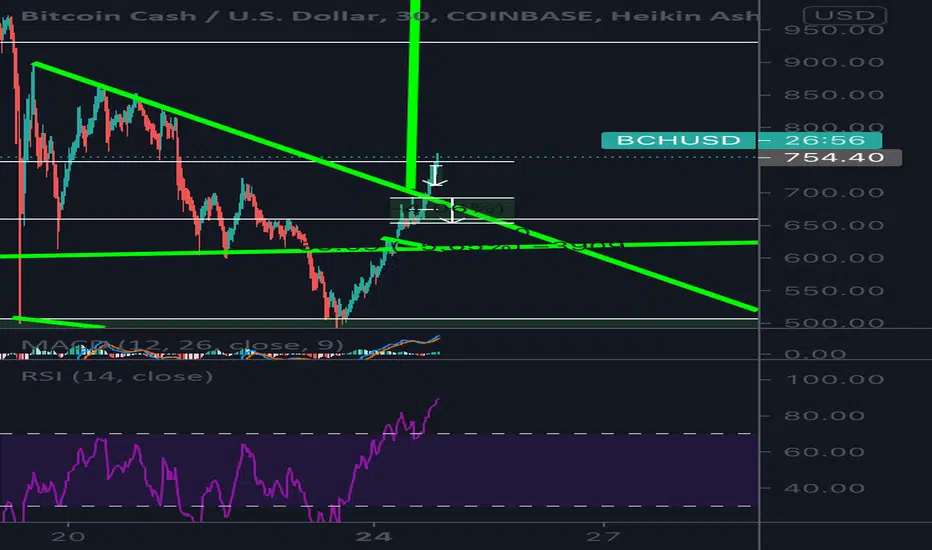
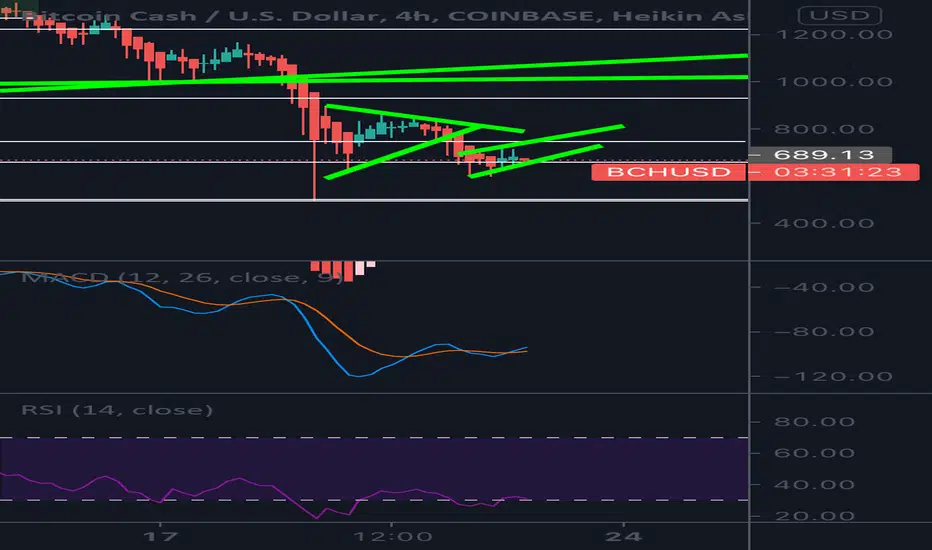
BchRising channel potentially ? Back test of breakdown ? That would
Be around 611$ if we back test breakdown. If we can find support above that could be bullish. Will run into resiatnce at 571 590 and this 611. Keep a close eye on this rising channel for a potential breakdown and also that 611$ If we can actually find support above or not
BchThis is where it gets compicated for me. So we were in this huge rising channel for BcH any time it tapped the bottom channel it was a buy and when it tapped the top channel it was a sell as one point as I’ve talked about we broke out of it and held support for some time on it. We eventually lost that support and here we are. Now 500$ is a key key support. Daily RSi is over sold. Personally I like this level but I’m ok with not getting a bottom. I want to see the trend turn around a bit. I longed BCh from 478 and sold at 1550 that was a great run for me. No here we are again. However since we are out of this channel. The break down of the channel is 280$.

bitcoin cashwhat do you think?
like follow agree disagree!
I see a new support bumping...how long before it shoots ups?
BchJust have to put this out there guys. Swing trades are great to buy dips and sell potential resiatnce but overall we are in downtrend, we are makin more and more continuation patterns over and over moving further lower. Lower highs and higher lows. Don’t spend all your money buying the dips.
We still have more ways to go in my opinion before we can turn around.
BchWe are getting breakdown. If Btc bounces at 37500 Bch could bounce at 663$ level short term. Still in down trend but may not make lower low which will be good signs