Bitcoin Cash, Anomaly or Predictive Signal?Some people can say that Bitcoin Cash right now is simply an anomaly, nothing to see here. But a closer look reveals nothing abnormal, more likely a very strong predictive signal that supports what we saw happening with the COIN stock and what was predicted recently to happen with ETHUSDT (Ethereum)
Bitcoin Cash BCH price analysisMore than 3 months have passed since the publication of the previous idea for #BCH, and the price itself has shown an increase of +40%
◆ Slowly but surely growing
◆ Does not react to the price fall CRYPTOCAP:BTC (for those who don't know, #BCH is the first CRYPTOCAP:BTC fork and probably the on

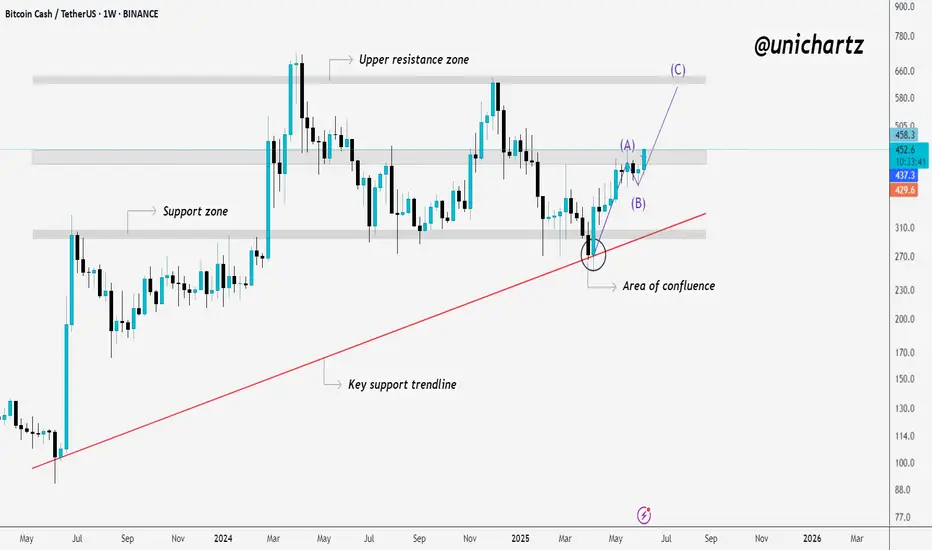
BCH Breaks Structure – Wave C Target in Sight?BCHUSDT Update:
After weeks of slow movement, BCH is finally breaking above the key resistance zone—a level that has acted as a strong barrier multiple times in the past.
This breakout is significant because it aligns with multiple technical confirmations. The support trendline has held firmly, a
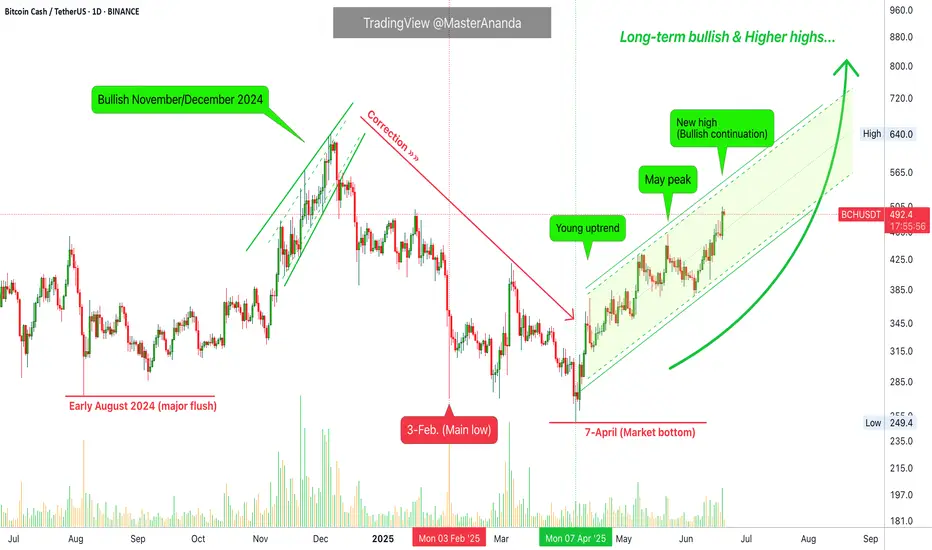
Bitcoin Cash Early Recovery & Bullish ContinuationToday's candle says it all. Bitcoin Cash moved to hit a low of $397, today, and the same session now trades at $449, the highest price since 23-May which was the date that produced the highest price since January 2025. This is an early recovery signal.
This signal is good and great but it needs one

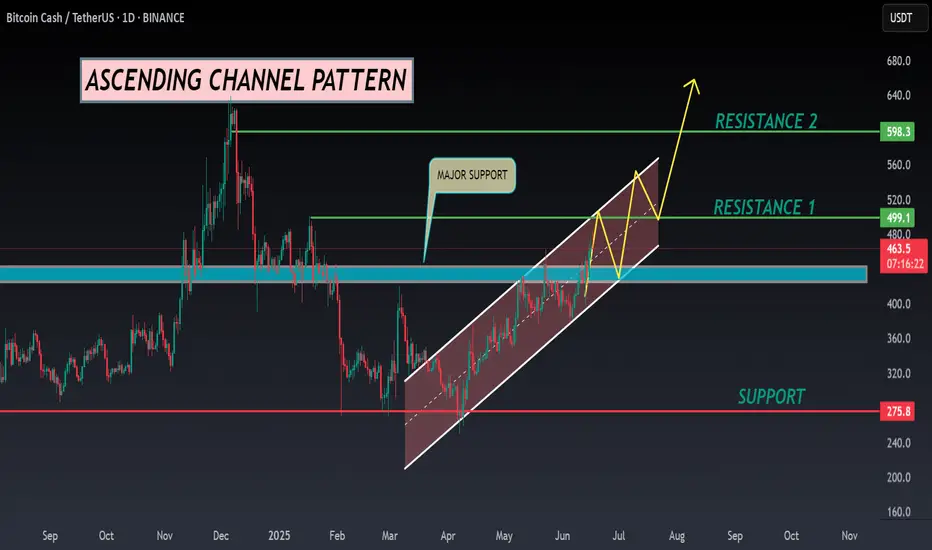
BCH ANALYSIS🔆#BCH Analysis : Channel Following ⛔️⛔️
As we can see that #BCH is following ascending channel on daily time frame. Also there is an instant resistance area. We can see a bullish formation here. And if it trade with good volume then we can see a proper bullish move in #BCH
🔖 Current Price: $463
⏳
Bitcoin Cash price action is interestingBINANCE:BCHUSDT price action in comparison with BTC and the remaining crypto assets price action is signaling that the coin is on to something, I expect this outperformance to continue. Anticipate price action is shown on the chart, long on the pullback towards 10 days moving average, stop level 45
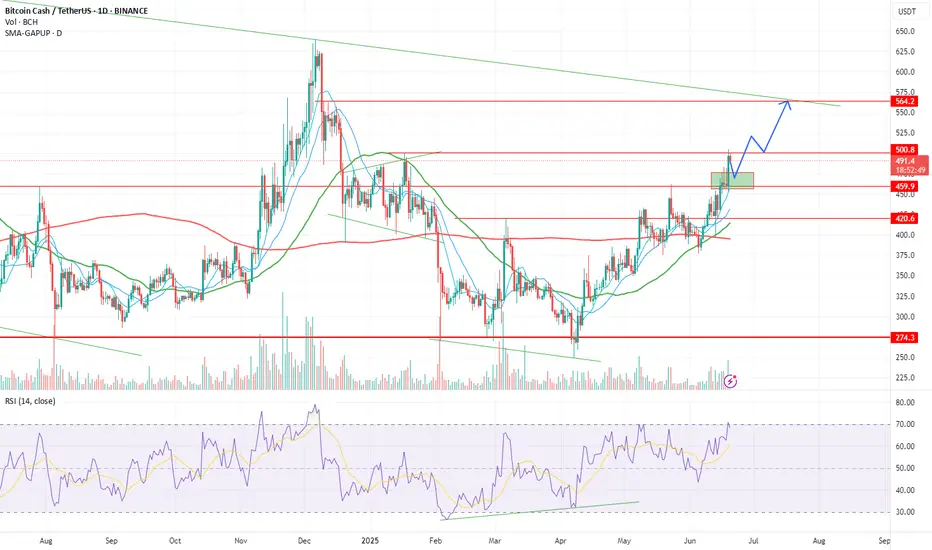
Bitcoin Cash Weekly Update, Moving Averages & Bullish PotentialI already looked at Bitcoin Cash recently, this time I want to see how the moving averages are doing here to compare with the other Crypto-projects. Good news for one pair is good news for other projects as well specially when they are in the same category. Bitcoin Cash is one of the big projects.
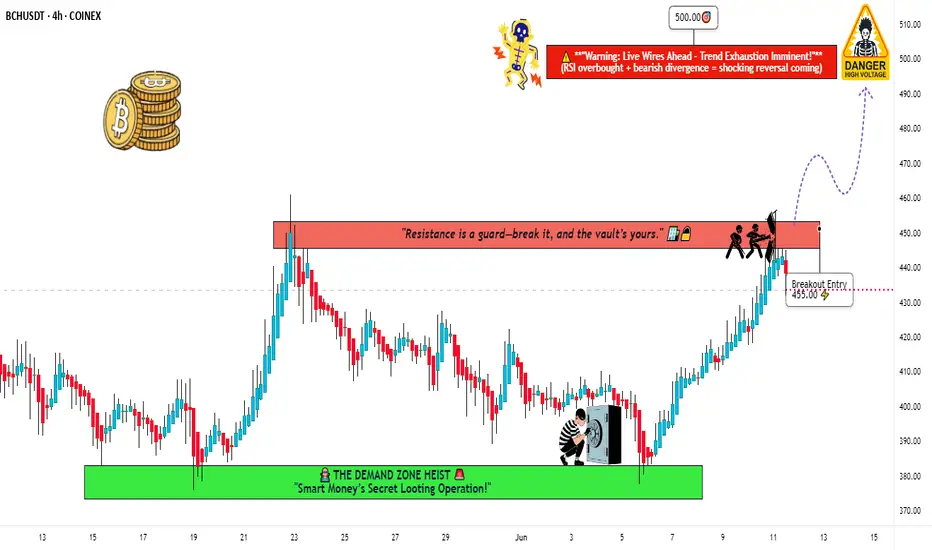
BCH/USDT Robbery Blueprint | Bullish Breakout Swing Trade Setup🚨 BCH/USDT Robbery Blueprint: The "Breakout Bandits" Bullish Heist Plan! 🚨
(Thief Trading Style – Swing Trade Setup)
🌟Hi! Hola! Ola! Bonjour! Hallo! Marhaba!🌟
Dear Money Makers & Market Robbers, 🤑💰💸✈️
We're about to pull off a high-stakes breakout heist on the BCH/USDT “BitcoinCash vs Tether” cryp
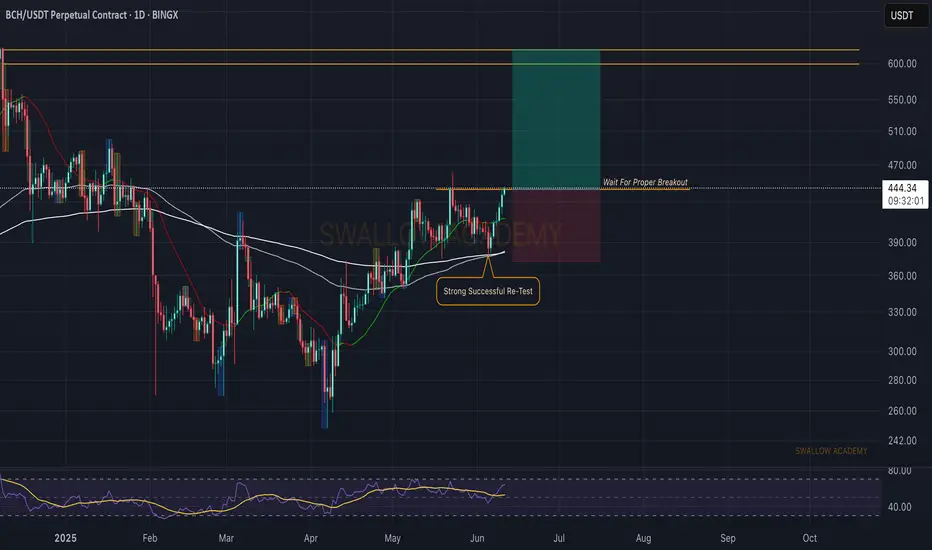
Bitcoin Cash (BCH): Breakout Incoming | Possible 1:4 TradeBCH is showing signs of a breakout where price is pushing and pushing, which eventually might result in a strong and volatile breakout from here.
As soon as we see it, we will be looking for further upward movement towards our target zone (resistance area).
Swallow Academy
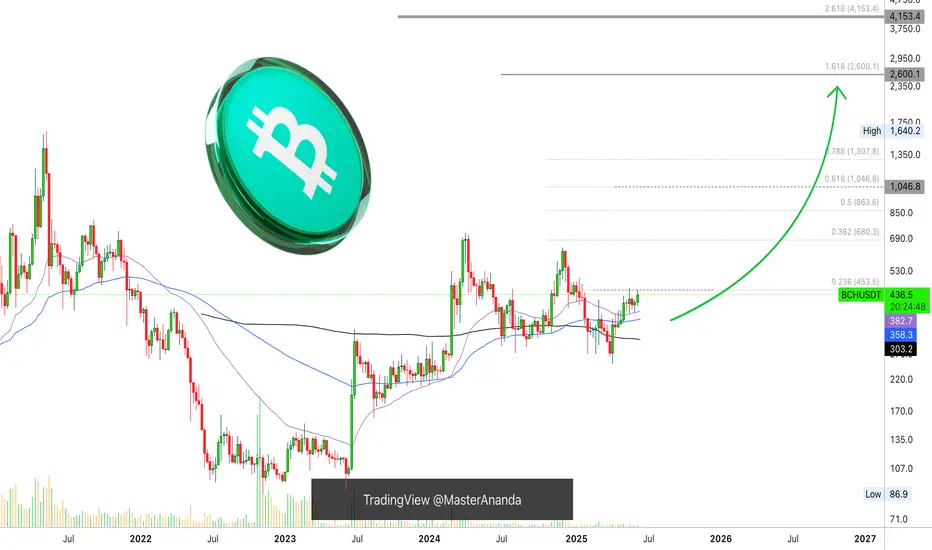
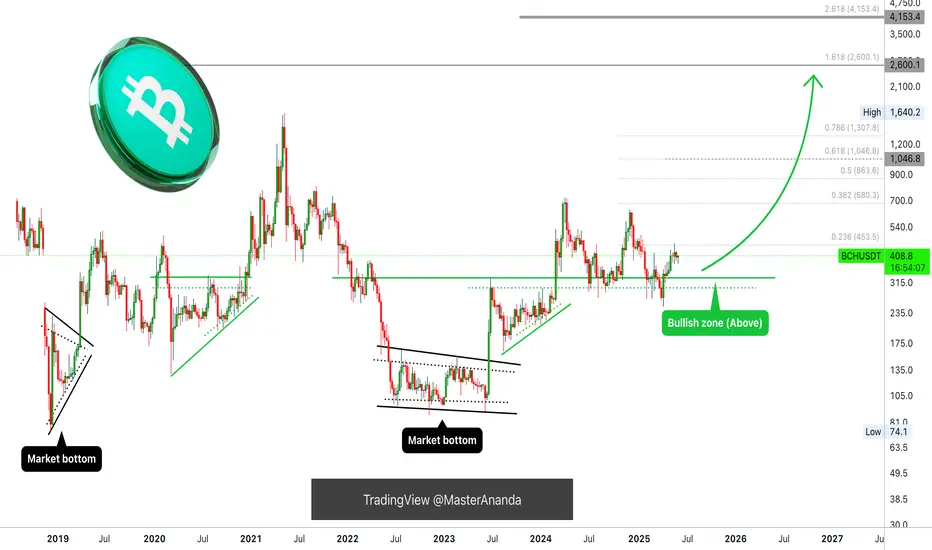
Everything Bitcoin Cash Points To a New ATH; $2,600 or $4,150?Bitcoin Cash is bullish, ready to grow within the bullish zone. There is zero doubt. I think it will be hard to know if the peak will happen around $2,600 or $4,150. There is a huge difference.
Knowing how erratic BCH has been in the past, we have to go with the second higher target; what do you th
See all ideas
Summarizing what the indicators are suggesting.
Oscillators
Neutral
SellBuy
Strong sellStrong buy
Strong sellSellNeutralBuyStrong buy
Oscillators
Neutral
SellBuy
Strong sellStrong buy
Strong sellSellNeutralBuyStrong buy
Summary
Neutral
SellBuy
Strong sellStrong buy
Strong sellSellNeutralBuyStrong buy
Summary
Neutral
SellBuy
Strong sellStrong buy
Strong sellSellNeutralBuyStrong buy
Summary
Neutral
SellBuy
Strong sellStrong buy
Strong sellSellNeutralBuyStrong buy
Moving Averages
Neutral
SellBuy
Strong sellStrong buy
Strong sellSellNeutralBuyStrong buy
Moving Averages
Neutral
SellBuy
Strong sellStrong buy
Strong sellSellNeutralBuyStrong buy
Displays a symbol's price movements over previous years to identify recurring trends.