Bitcoin Cash, Anomaly or Predictive Signal?Some people can say that Bitcoin Cash right now is simply an anomaly, nothing to see here. But a closer look reveals nothing abnormal, more likely a very strong predictive signal that supports what we saw happening with the COIN stock and what was predicted recently to happen with ETHUSDT (Ethereum), that is, a very strong bullish breakout is the next main major market move.
Good morning my fellow Cryptocurrency trader, I hope this day finds you well.
How are you feeling?
Introduction —The market is one
In isolation, the market is tricky and hard to predict. Within a bigger context, we can easily predict what will happen next. Just look at Bitcoin Cash, it shows exactly what will happen because it has been being in perfect syntony with the rest of the market.
Many pairs are consolidating or retracing. My view is that a bullish move comes next.
Let's see how Bitcoin Cash has been behaving lately and compare this to the rest of the market. The fact that it is bullish now predicts that also the other pairs will be bullish because they are moving in the exact same way.
Price action —Past history
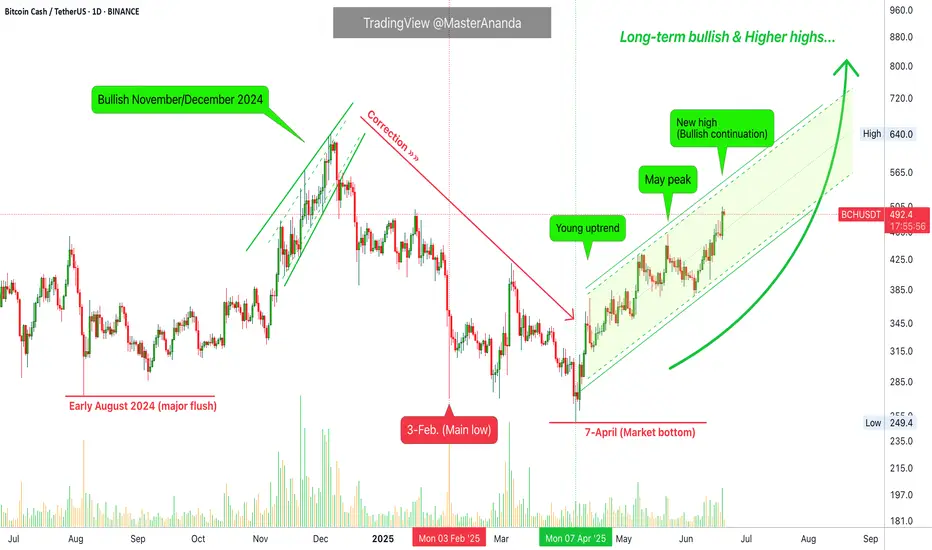
A crash ends in early August 2024. By late 2024 the action goes bullish. November 2024 marks the start of a month long advance that ends December 2024. This is true for most of the altcoins market.
The December 2024 peak leads to a correction with the main low happening 3-February. Another low and market bottom happens 7-April 2025. From this point on, we have a recovery and after a high in late May, the market goes into retrace.
Present day
This retrace is where we are today for most of the pairs. 100% of these are trading within a higher low compared to 7-April. Here BCHUSDT ended its retrace and moved ahead of the pack to hit a higher high compared to May. It also produced the highest price since January 2025.
The future
This is not an anomaly. Bitcoin Cash's price action simply reveals what is coming to the rest of the market. As it moved in perfect synchrony with other projects for months or even years, it will continue to do the same. The fact that it is trading higher now, means the other pairs will follow, in fact, some other pairs are already there; a bullish continuation.
Soon everything will grow.
Thank you for reading.
Namaste.
BCHUSDT.P trade ideas
Bitcoin Cash BCH price analysisMore than 3 months have passed since the publication of the previous idea for #BCH, and the price itself has shown an increase of +40%
◆ Slowly but surely growing
◆ Does not react to the price fall CRYPTOCAP:BTC (for those who don't know, #BCH is the first CRYPTOCAP:BTC fork and probably the only one that survived. Then there were 8-10 more of them in 2017-2018... but hey...)
◆ It has been moving in its own direction for more than a year, when OKX:BCHUSDT is cheaper than $300, it is actively bought back by someone.
We have slightly revised the growth target for #BitcoinCash, but why not consider this asset as a long-term investment from $350-400 to $900 and $1250
_____________________
Did you like our analysis? Leave a comment, like, and follow to get more

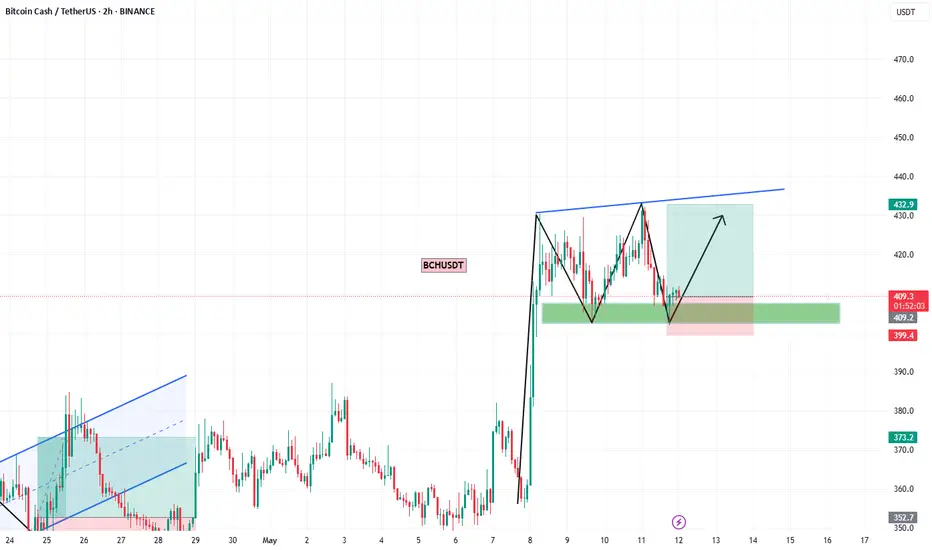
BCH Breaks Structure – Wave C Target in Sight?BCHUSDT Update:
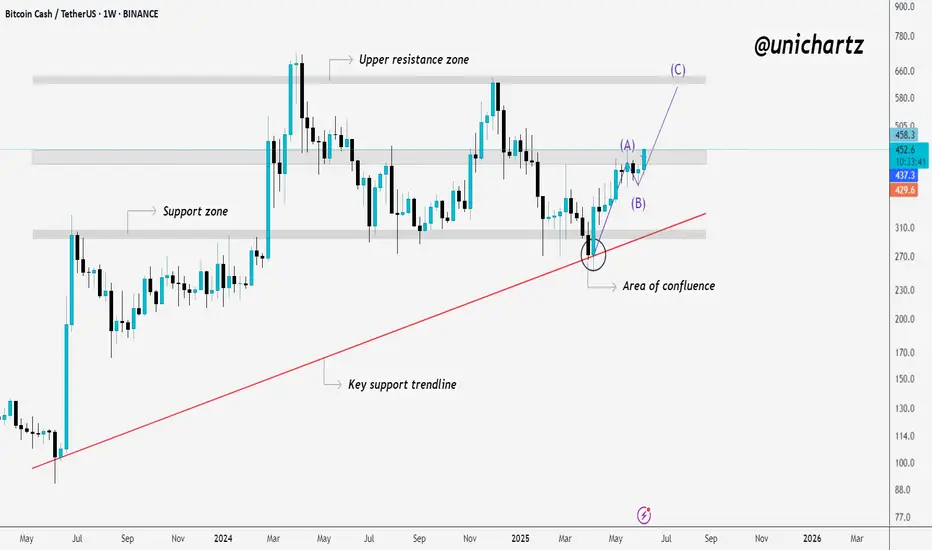
After weeks of slow movement, BCH is finally breaking above the key resistance zone—a level that has acted as a strong barrier multiple times in the past.
This breakout is significant because it aligns with multiple technical confirmations. The support trendline has held firmly, a higher low has been established, and the price has pushed upward from a well-defined area of confluence.
If this breakout sustains, there is a strong possibility of continuation toward the upper resistance zone, completing the projected wave structure. It’s important to monitor this closely, as a successful retest and follow-through could confirm the beginning of the next bullish phase.
Thank you for your precious time.
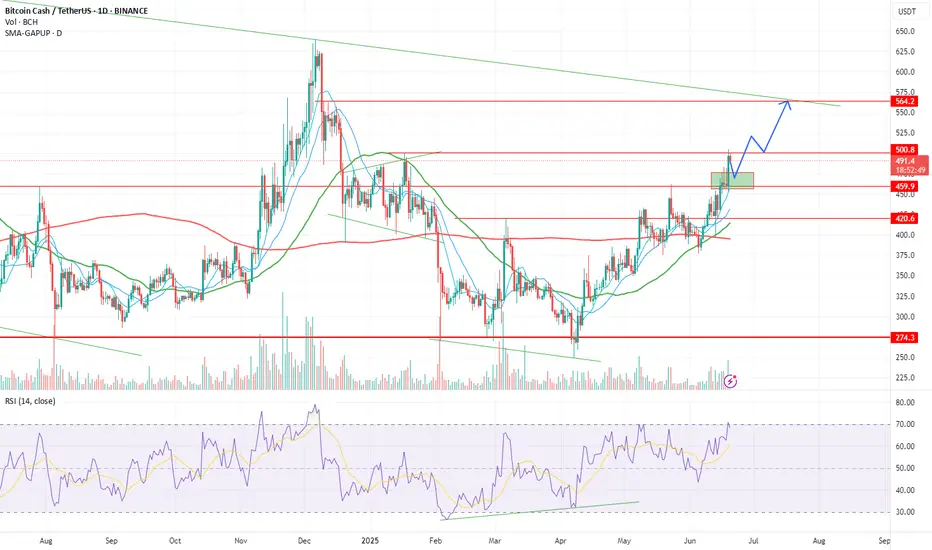
Bitcoin Cash Early Recovery & Bullish ContinuationToday's candle says it all. Bitcoin Cash moved to hit a low of $397, today, and the same session now trades at $449, the highest price since 23-May which was the date that produced the highest price since January 2025. This is an early recovery signal.
This signal is good and great but it needs one final bit to be confirmed, and that is a continuation tomorrow. The week is about to end and the close is what determines the next move. If the action closes above the 23-May high, $462, then ultra-bullish confirmed. If the session closes below then there is still room for some more shakeouts, retraces and corrections. But the early recovery signal is in. What one does, the rest follows.
Now, not all pairs will move in the same way. Some will continue lower, retrace, while some others produce an early recovery and move ahead.
Today's session is just too strong, we can easily say that Bitcoin Cash is ready to resume its bullish wave of growth. $684 next target, followed by additional growth.
Thanks a lot for your continued support.
Namaste.

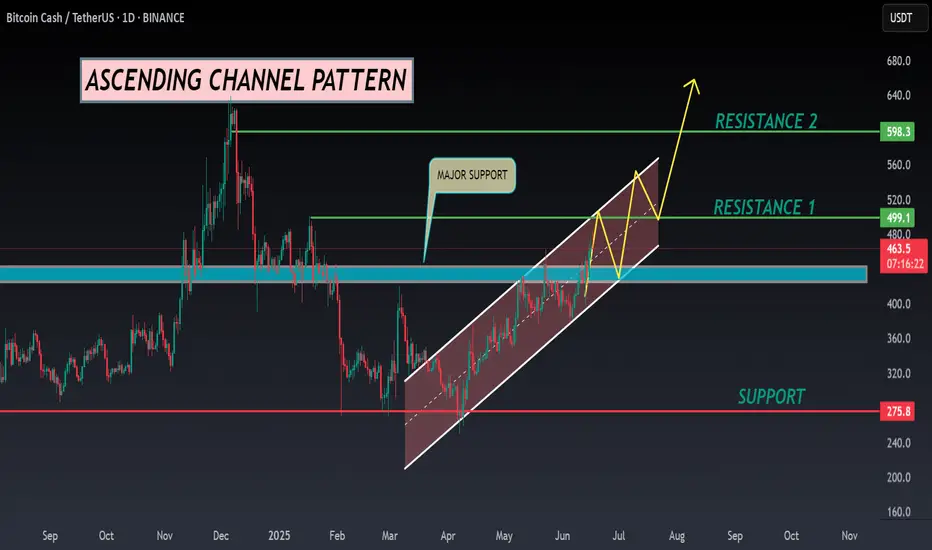
BCH ANALYSIS🔆#BCH Analysis : Channel Following ⛔️⛔️
As we can see that #BCH is following ascending channel on daily time frame. Also there is an instant resistance area. We can see a bullish formation here. And if it trade with good volume then we can see a proper bullish move in #BCH
🔖 Current Price: $463
⏳ Target Price: $598
⁉️ What to do?
- Keep your eyes on the chart, observe trading volume and stay accustom to market moves.🚀💸
#BCH #Cryptocurrency #ChartPattern #DYOR
Bitcoin Cash price action is interestingBINANCE:BCHUSDT price action in comparison with BTC and the remaining crypto assets price action is signaling that the coin is on to something, I expect this outperformance to continue. Anticipate price action is shown on the chart, long on the pullback towards 10 days moving average, stop level 450$.
PS. My views only, not financial advice!
Bitcoin Cash Weekly Update, Moving Averages & Bullish PotentialI already looked at Bitcoin Cash recently, this time I want to see how the moving averages are doing here to compare with the other Crypto-projects. Good news for one pair is good news for other projects as well specially when they are in the same category. Bitcoin Cash is one of the big projects.
Here we can see BCHUSDT trading weekly above EMA34, EMA89 and MA200, while rising.
Resistance was found at $453, a fib. extension level. Once this level is broken as resistance you can expect a swift advance toward $680. It will be nice and easy. This is the last barrier and current price action is kind of mix.
It is good because this week trades at the highest since November 2024 coming from a low. It is bad because it is lower compared to 19-May on the wick but the week is yet to close.
A weekly close above $420 is highly desirable and favors the bulls, anything lower and we continue with a mixed situation. Make no mistake, the situation is mixed only short-term. The chart shows a clear bullish bias and there will be additional growth in the coming weeks and months. Only the short-term is questionable.
Bitcoin Cash, Bitcoin and the entire Cryptocurrency market is set to grow.
Thanks a lot for your continued support.
Namaste.
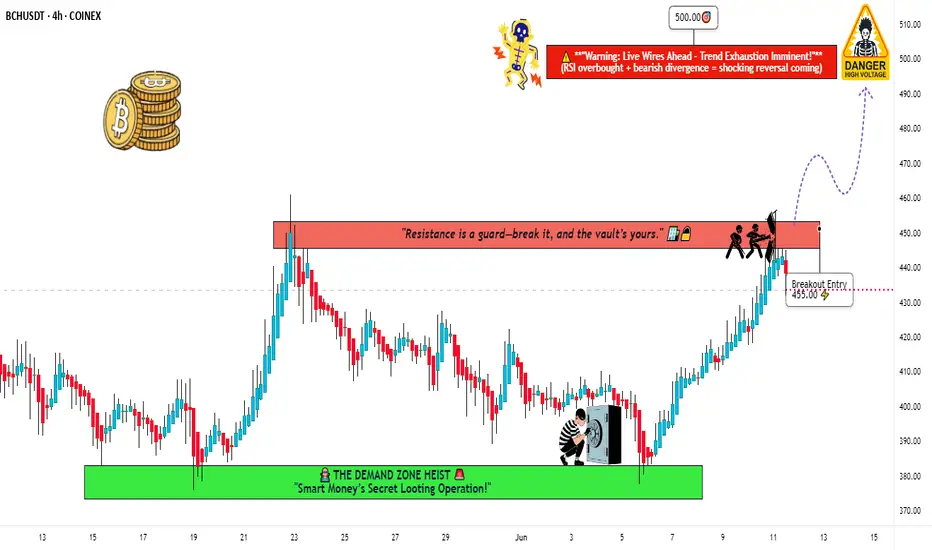
BCH/USDT Robbery Blueprint | Bullish Breakout Swing Trade Setup🚨 BCH/USDT Robbery Blueprint: The "Breakout Bandits" Bullish Heist Plan! 🚨
(Thief Trading Style – Swing Trade Setup)
🌟Hi! Hola! Ola! Bonjour! Hallo! Marhaba!🌟
Dear Money Makers & Market Robbers, 🤑💰💸✈️
We're about to pull off a high-stakes breakout heist on the BCH/USDT “BitcoinCash vs Tether” crypto market using the legendary 🔥Thief Trading Style🔥 — powered by technical + fundamental recon.
🎯 Mission Objective: Long Entry
"The vault is cracking open... our move starts above the 455.00 MA breakout level. Set your traps smart!"
✅ Buy Stop: Above MA @ 455.00 – The breakout point to initiate the heist.
✅ Buy Limit: Look for pullbacks on 15m or 30m swings for a sneaky entry at key levels.
📌 Set an alarm – don’t blink or you’ll miss the breach!
🛑 Escape Plan – Stop Loss
🔊 Yo crew, hear this:
If you're rolling with a buy stop, don’t drop your stop loss too early – wait till we’re inside!
📍 Ideal SL @ 425.00 on 4H swing lows — keep it smart, based on risk + lot sizing.
You’re the captain of this getaway — protect the loot!
🏴☠️ Target Zone
💰Profit Point: 500.00
(or escape earlier if heat increases 🔥)
Get out before the cops (bearish robbers) regroup!
📊 Heist Intelligence:
Market’s flashing bullish vibes, driven by:
🧠 Fundamentals | 📈 Macros | 🧾 COT Report | 🔗 On-chain Data | 🌀 Sentiment | 🔄 Intermarket Forces
👉 Check our bi0 link for the full briefcase of intel 🔍🧠
⚠️ Trading Alert – News & Volatility Risk
📢 Avoid entries during high-impact news
🔒 Use trailing SLs to protect profits + survive crossfire
💖 Show love to the crew! 💥 Hit that Boost Button 💥
Support our robbery squad – grow stronger, smarter, richer!
Trade like a thief. Rob the markets daily. 🎯💪🏆🚀💸
I'll be back soon with another crypto vault raid – stay tuned, legends! 🐱👤🤑🤩
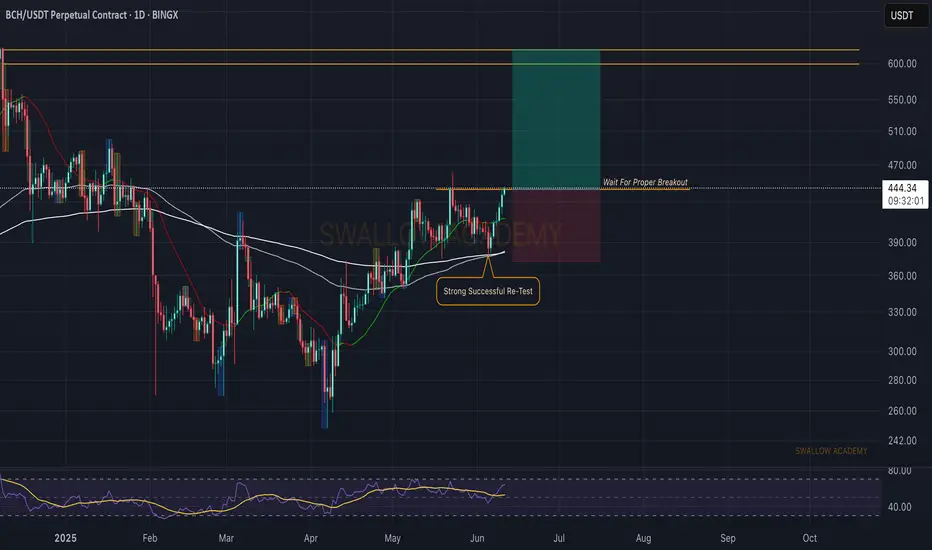
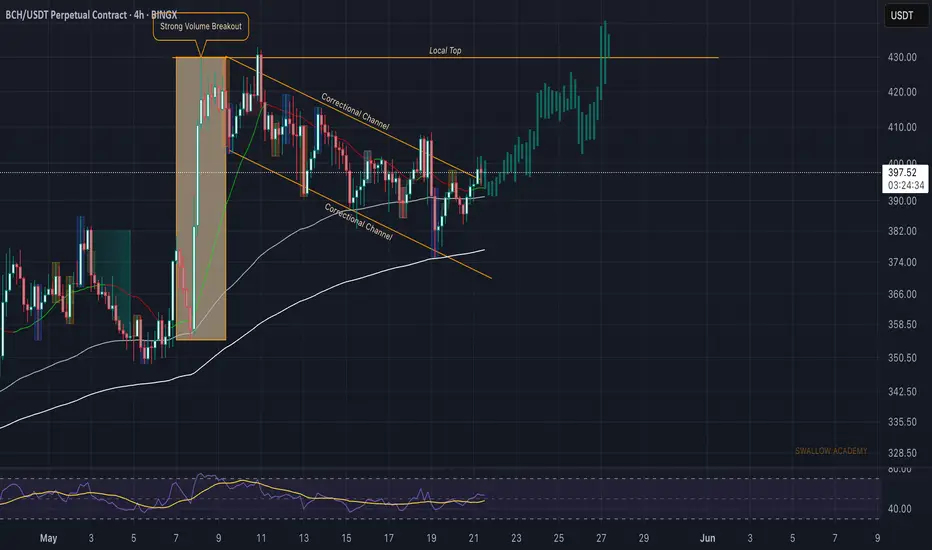
Bitcoin Cash (BCH): Breakout Incoming | Possible 1:4 TradeBCH is showing signs of a breakout where price is pushing and pushing, which eventually might result in a strong and volatile breakout from here.
As soon as we see it, we will be looking for further upward movement towards our target zone (resistance area).
Swallow Academy
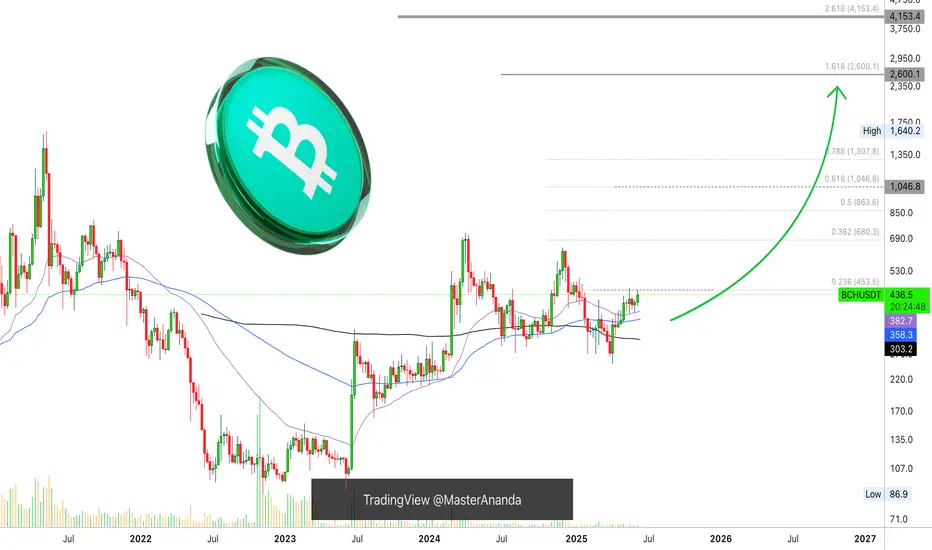
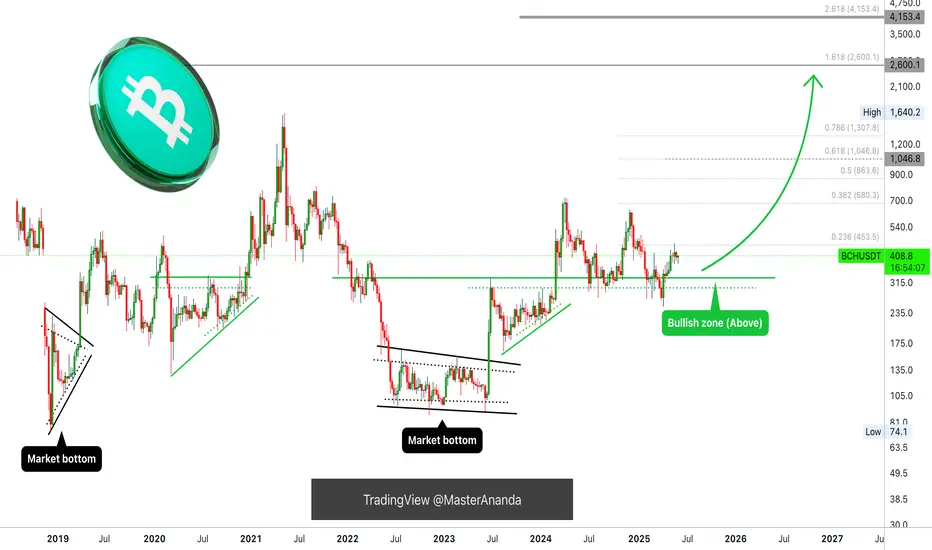
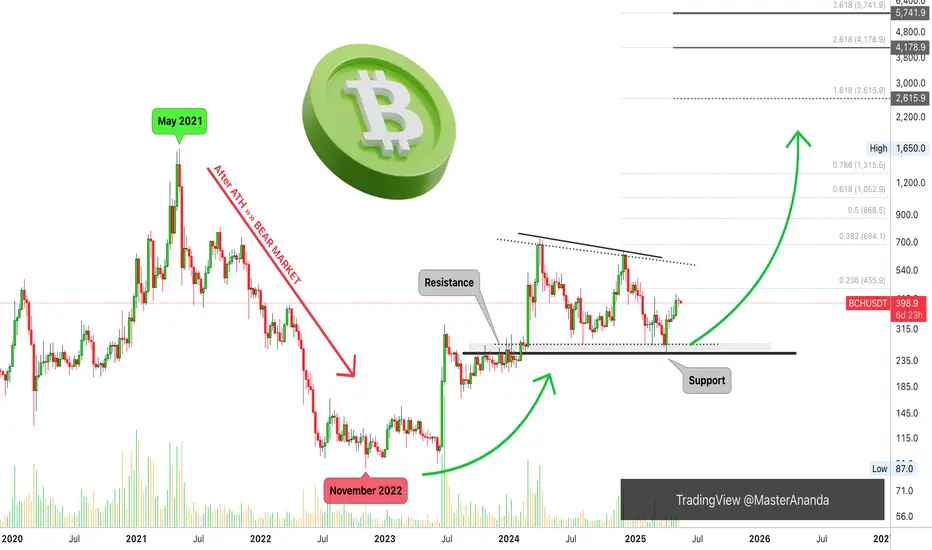
Everything Bitcoin Cash Points To a New ATH; $2,600 or $4,150?Bitcoin Cash is bullish, ready to grow within the bullish zone. There is zero doubt. I think it will be hard to know if the peak will happen around $2,600 or $4,150. There is a huge difference.
Knowing how erratic BCH has been in the past, we have to go with the second higher target; what do you think?
It is hard to say but we have two targets mainly for late 2025. There is no doubt that we will get a new all-time high we just don't know how high.
I will go with the second one just in case. Say this bull market top for Bitcoin Cash will reach somewhere around $4,000. Can be more or less.
You can leave a comment with your number.
How far up do you think Bitcoin Cash will go?
And remember, the bullish bias is already confirmed. Everything points up. The chart, the indicators, the patterns, the signals, the overall market, everything... Thank you for your continued support.
If you enjoy the content make sure to follow.
Namaste.
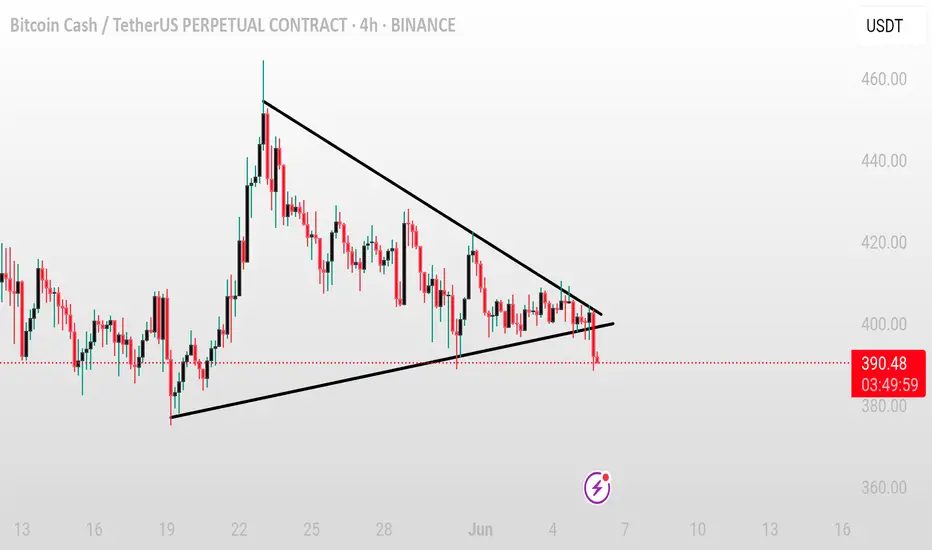
BCH/USDT – Symmetrical triangle breakdown confirmedBCH/USDT – Symmetrical triangle breakdown confirmed
BCH has broken down from the symmetrical triangle pattern, signaling a bearish shift in momentum. If the price continues to trade below the breakdown level with increased volume, further downside can be expected.
Key levels to watch:
* Breakdown resistance zone
* Retest confirmation
* Next support levels below
Monitor closely — staying below the triangle support may lead to extended bearish movement.
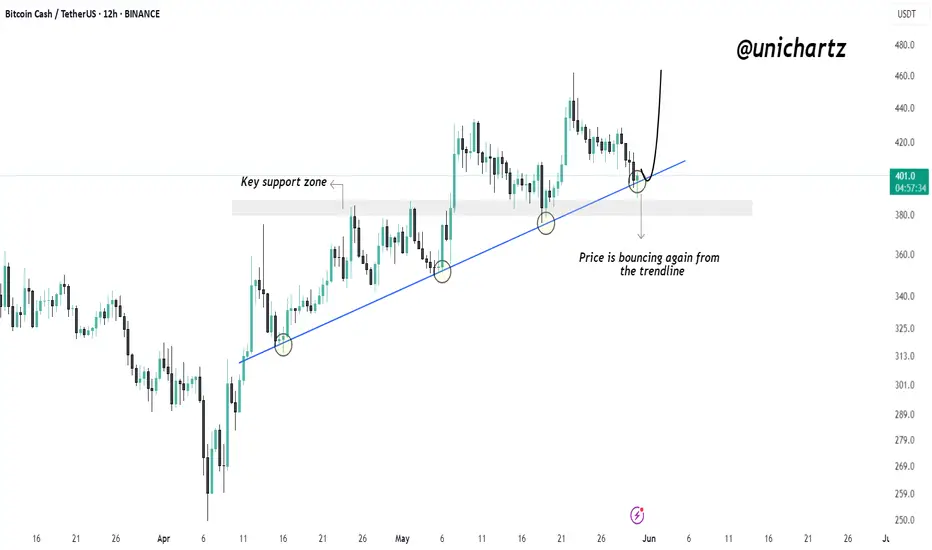
Bitcoin Cash Respects Trendline Again – Is Another Rally LoadingBitcoin Cash is showing strong trendline respect, with multiple successful bounces from the ascending support.
Price is once again bouncing off this trendline, signaling bullish intent. As long as this structure holds, the uptrend remains intact and a potential move toward higher levels looks likely.
Key support and trendline confluence continues to act as a launchpad.
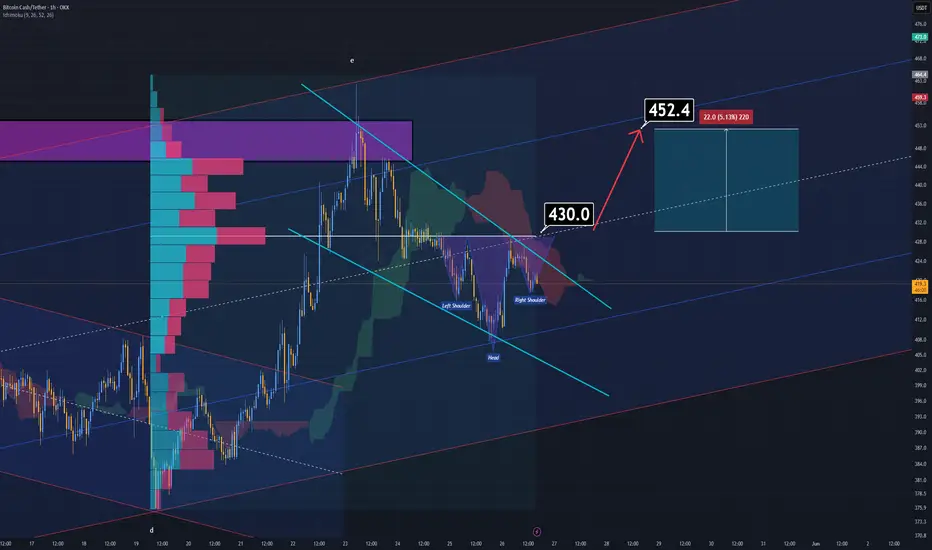
BCH Analysis for Scalpers (1H)Bitcoin Cash (BCH) is currently showing multiple technical signals that support a potential bullish continuation.
A reversed Head and Shoulders pattern is in the process of forming, and it aligns well with several key confluences — including the Ichimoku Cloud and volume profile support zones.
A breakout above the $430 level would not only confirm the pattern but also activate a bullish flag formation, adding further momentum to the setup. In that case, the next immediate target would be around $452.4.
This setup remains valid only upon confirmation of the breakout. Until then, caution is advised — a clean break and retest would offer the most favorable entry.
— Thanks for reading.
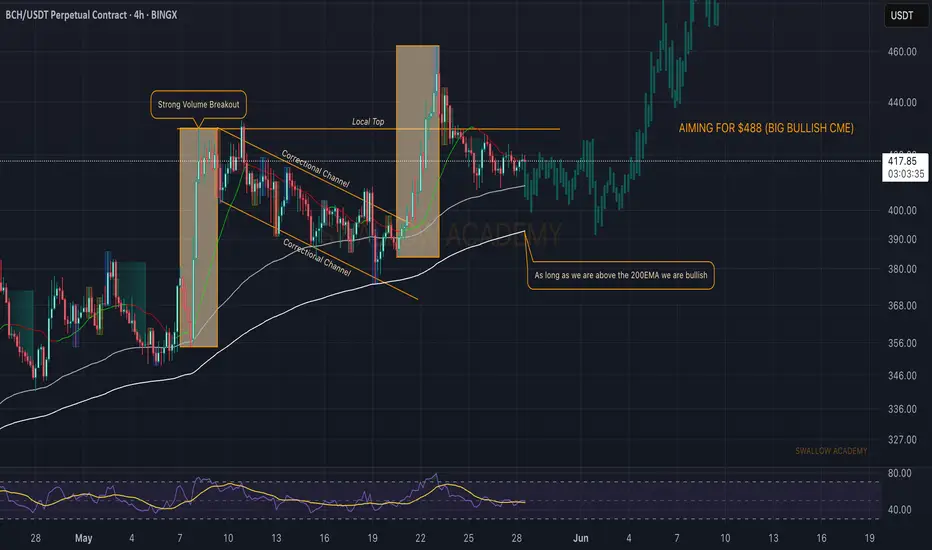
Bitcoin Cash (BCH): Seeing Similar Pattern | Next Target $488BCH has reached our previous target, and after reaching the local top, we have been having a slight downside movement. What we are seeing is the similar pattern where we are looking yet for another movement like last time.
Overall, we are aiming to see the $488 area reached, where we have a HUGE CME gap waiting to be filled.
P.S: As long as we are above the 200 EMA, we are bullish.
Swallow Academy
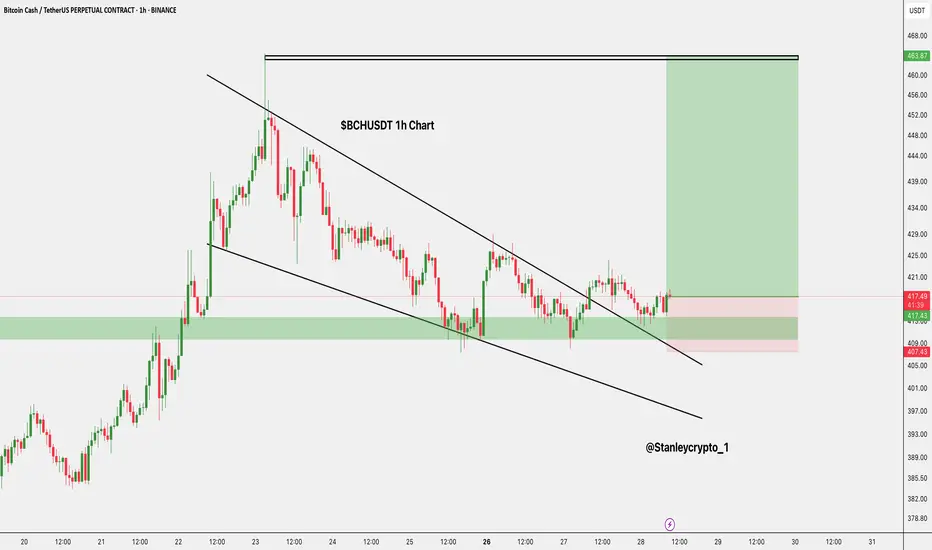
$BCHUSDT falling wedge 1H chartSET:BCH is breaking out of a falling wedge on the 1H chart!
Price bouncing from the demand zone with strong bullish momentum.
- Entry: $416 / $418
- SL: $407
- Target: $461+
DYRO, NFA
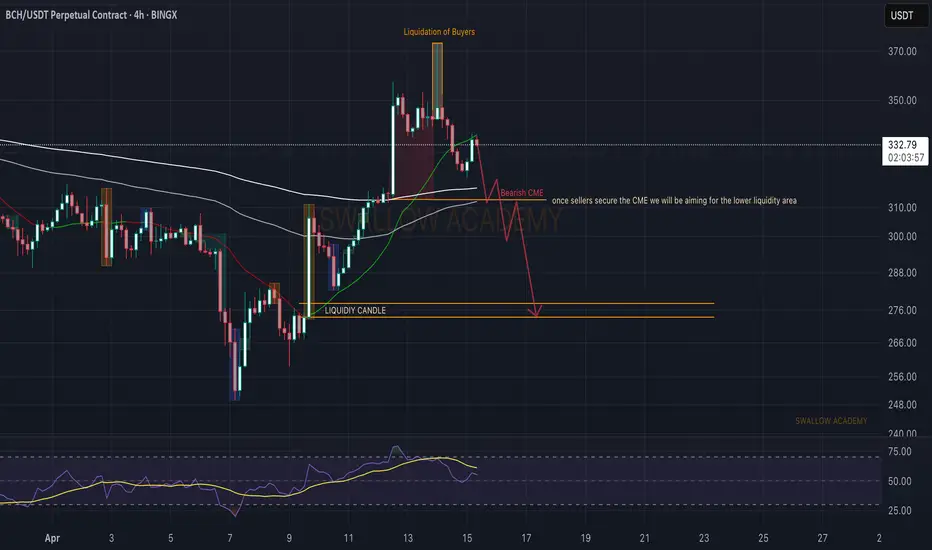
Bitcoin Cash (BCH): Bearish CME + Lower Liquidation ZoneWe are seeing an unfilled bearish CME gap on BCH coin, which might send the price even lower.
We are looking for the CME gap to be filled, whereupon seeing further pressure from sellers, we are going to look for a possible breakdown to form there, which then would send the price to our next target zone at $276.
Swallow Academy
TradeCityPro | BCHUSDT Bitcoin Fork Ready to Hit New Highs?👋 Welcome to TradeCityPro Channel!
Let’s dive in and analyze the Bitcoin fork, BCH, to understand why this altcoin is performing much better than the broader market and is being supported at higher levels.
🌐 Overview Bitcoin
Before starting the analysis, I want to remind you again that we moved the Bitcoin analysis section from the analysis section to a separate analysis at your request, so that we can discuss the status of Bitcoin in more detail every day and analyze its charts and dominances together.
This is the general analysis of Bitcoin dominance, which we promised you in the analysis to analyze separately and analyze it for you in longer time frames.
📊 Weekly Time Frame
In the weekly time frame, we see that BCH is in a much better position compared to other altcoins and continues to form higher highs and higher lows!
After hitting the 707 resistance and getting rejected, we’ve been ranging in a large box. However, it’s fair to say that buyers have the upper hand in this box because, after touching the critical 268 support, we engulfed the previous three weekly candles and experienced a sharp move up to 424.
Currently, we’re at a critical point: we could either form a lower high relative to the previous resistance or undergo a mid-term correction and re-enter after breaking 424!
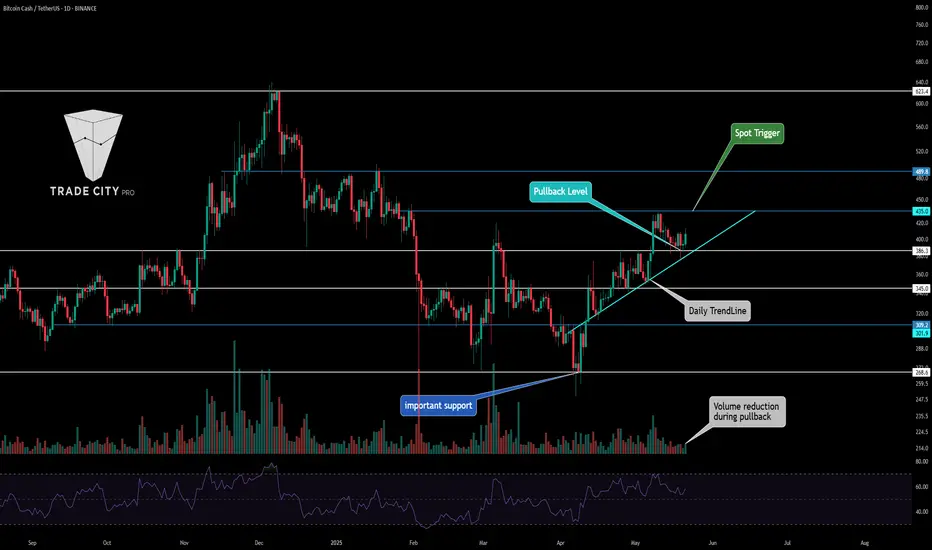
📉 Daily Time Frame
In the daily time frame, the situation is similarly favorable, and BCH is continuing its trend with good momentum. The formation of higher highs and higher lows provides a sense of calm to the uptrend.
After the heavy decline in February, it was natural for us to enter a ranging period before forming a new structure. This happened, and after retesting the 268 support, we started forming higher highs and lows, with our first entry at the 345 level.
Currently, after a rejection from 435, we’ve corrected to 386, which was a low-volume move, technically considered a pullback. If we see a supportive candle at this level, it’s a trigger for a buy, and breaking 435 will be the next trigger!
✍️ Final Thoughts
Stay level headed, trade with precision, and let’s capitalize on the market’s top opportunities!
This is our analysis, not financial advice always do your own research.
What do you think? Share your ideas below and pass this along to friends! ❤️
Bitcoin Cash (BCH): Seeing Possible Breakout To HappenBitcoin Cash seems to go for a smaller breakout after we had a huge liquidity movement and a correction following it. We had a nice touch to EMAs and bounced from there, where now we are testing the upper side of the bearish channel and buyers are not showing any remorse.
We are looking for a breakout here, which would give us a humble 8% movement to upper zones.
Swallow Academy
Bitcoin Cash, The Map! Technical Analysis GeniusEvery time I look at the chart I consider the possibilities of a bear market. You've seen me bullish, you know I am bullish and I share the signals, but I always stay open to being wrong so I keep on looking to see if I can find something that I might be missing.
To be honest, if the signals were there I wouldn't be able to see them, I am too hypnotized by hundreds of charts hitting bottom and recovering from this bottom to think that a bear market is just starting now. Bear markets tend to start from a major wave high or new All-Time High.
Here we have Bitcoin Cash, see May 2021.
The ATH, the top, leads to a strong bear market. Notice that a bear market does not happen from bottom prices but from peak prices; obviously duh!
Ok, ok... My job is to clear all doubts for you but since you are reading this and you are my follower, you already know what is happening and we agree.
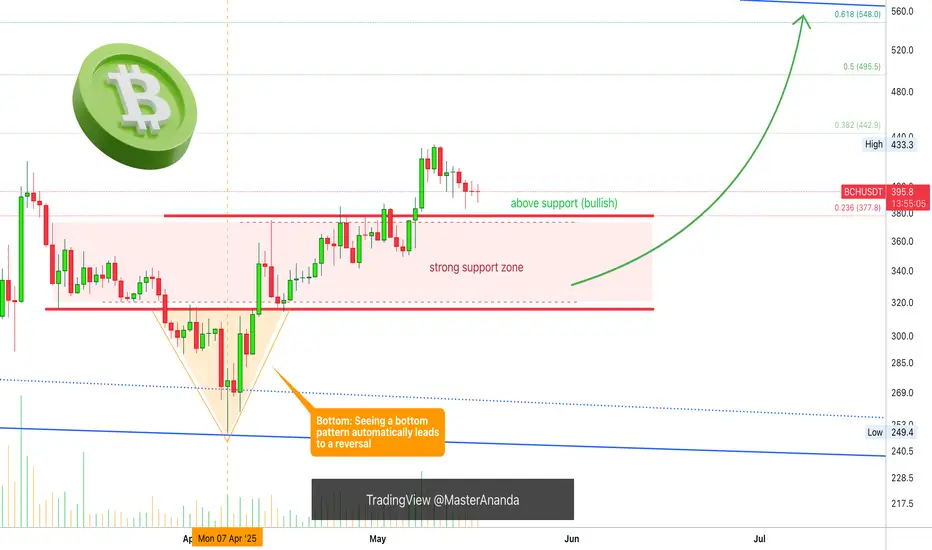
The zone that worked as resistance in late 2023, worked as support in April 2025, last month.
There was a bottom in November 2022. From the bottom we grow.
This bottom signaled the start of the new bull market.
The low in April is a long-term higher low. From this low we will experience the latter part of this long-term growth period, but it continues.
The incoming bullish wave will produce a new All-Time High. This ATH will be followed by a bear market. The bear market will end in a long-term higher low. This higher low we will call a bottom, the bottom of that bearish cycle and from this bottom a new wave of growth and so on. It keeps on happening long-term.
This is good for today.
Enjoy the chart for the All-Time High targets.
Thank you for reading.
Namaste.
Bitcoin Cash Short-Term: Trading Above Support And...Ever since 7-April, which marks the correction bottom and trend reversal, the maximum we have is three consecutive days closing red. This is great news.
Currently BCHUSDT closed the last three days red. This is the fourth day.
1) It can happen that this day also closes red, this puts pressure on tomorrow being green based on past action.
2) It can happen that todays ends up closing green and the market starts to turn.
This is not only true for this period but also other periods. Whenever Bitcoin Cash is rising, long sequences of bearish days are rare to come by.
If the market starts to turn, the current down period will result in nothing more than a very short stop with minimum retrace before additional growth. This is a transition period. The whales move billions of dollars and the algorithms need to be recalibrated, "reprogrammed," after just a few weeks.
Each time a set of Altcoins move forward for several weeks, there is a small pause, the programs are updated, the money is positioned and a new set of Altcoins will grow. The previous set can continue growing but the top performers tend to change. You will see this happening week after week after week throughout the entire bull market.
The trick to achieve high profits is to forget about catching the next big wave. Choose your pair and hold, if you look closely, it has been growing day after day after day. When you try to catch the next wave, it is always too late, but everything is growing slowly, we are soon to be one level up marketwide. I predicted 2-3 levels up by the end of the month. Watch!
Bitcoin Cash already produced more than 70% growth since the 7-April bottom. It will continue rising long-term, this is only the start.
Diversification can be a good strategy if you want to catch those moving up strong. But it is better to focus on strategy and sure success rather than excitement and perceived high gains. The market is growing anyway and it is not going away.
Do it right and you will earn more mid-, short- and long-term.
Namaste.
BCH/USDT Bullish Heist: Crack the Vault & Grab the Loot!🔥 **BCH/USDT Bullish Heist Plan** 🔥
Hey Profit Pirates & Chart Chasers! 🤑 Ready to pull off a slick move on the Bitcoin Cash vs. Tether (BCH/USDT) crypto market? 📈 This *Thief Trading Style* blends sharp technicals with market vibes to hunt a bullish breakout. Stick to this plan, ride the surge, and slip out before the Red Zone danger hits. Let’s stack those gains as a crew! 💪🎯
📊 Heist Blueprint: BCH/USDT
- Market: BCH/USDT (Crypto) 🌐
- Bias: Bullish Breakout 🌟
- Timeframe: 1D (Swing Trade) ⏰
Entry Points 📈
- **Breakout Entry (Entry 1)**: "Crack the vault! Spot the MA breakout at 430.0 and jump in—bullish riches are calling!"
*Pro Move*: Set buy stop orders above the Moving Average or buy limit orders at the latest 15/30-min swing low/high for pullback entries. 📣 Add a chart alert to snag the breakout!
- **Pullback Entry (Entry 2)**: "The job’s on! Wait for the MA pullback in the Market Makers Trap/Heist Zone at 350.0, then strike—guts win big!" 📍
*Trader Hack*: Set a TradingView alert for the 430.0 breakout to stay one step ahead! 🔔
Stop Loss 🛑
- **Breakout Traders**: Once the breakout confirms, place Stop Loss below the recent 1D swing low at (Entry 1) 380.0 & (Entry 2) 310.0 to shield against reversals. ⚠️
- **Pullback Traders**: Customize Stop Loss to your risk tolerance (e.g., 1-2% of account). Tweak based on lot size and multiple orders. 📏
- **Risk Warning**: This heist’s high-octane! Keep position sizing tight to protect your stash. 🔥
Target 🎯
- Aim for 500.0, close to the Red Zone (overbought territory ripe for consolidation or reversal). 🏴☠️
- **Exit Play**: Cash out early if bearish clues (e.g., high volume, reversal candles) pop up near 500.0. 💸
Scalpers 👀
- Focus on Long-side scalps with tight trailing stops. Team up with swing traders for the full heist or grab quick profits if your funds allow. 💰
📡 Why This Trade’s Got Juice (May 17, 2025)
BCH/USDT is primed for action with a neutral trend and bullish sparks, fueled by:
- **Technicals**: A breakout above the 50-day MA (not 108000, correcting to ~430.0), paired with higher lows on the 1D chart, screams momentum. 📊
- **Sentiment Analysis (May 17, 2025)**: Social media buzz on platforms like X shows 68% positive sentiment for BCH, with traders hyping altcoin season. Fear & Greed Index at 72 (Greed), signaling bullish vibes but caution near overbought levels. 😎
- **Fundamentals**: The latest COT report (May 16, 2025) from CFTC shows institutional long positions in crypto futures up 12% WoW, hinting at big-player confidence. 📰
- **Seasonal Edge**: Q2 historically favors Bitcoin and altcoins, aligning with our setup. 📅
- **Market Flow**: USD softness (DXY down 0.8% this week) and altcoin strength boost BCH’s upside. 🌎
⚠️ Risk Management: Lock Your Loot
- **News Alert**: Dodge new trades during high-impact events (e.g., CPI, FOMC) to sidestep volatility traps. 🗞️
- **Trailing Stops**: Activate trailing Stop Loss as price nears 500.0 to secure profits. 🔒
- **Position Sizing**: Cap risk at 1-2% per trade for a smooth heist. 🚨
💥 Ignite the Heist! 💥
Join the *Thief Trading Style* squad—like, comment, and follow for more electrifying trade setups! 🚀 Your support powers our market raids, paving the way for precise wins. Let’s dominate BCH/USDT together! 🤝🏆🎉
**Stay Locked In**: Another heist plan’s brewing. Keep your charts ready, traders! 🐱👤😎
---
🔥 **Real-Time Data (May 17, 2025, UTC+1)** 🔥
- **BCH/USDT Price**: ~425.0 (based on aggregated exchange data).
- **COT Report (May 16, 2025)**: Institutional long positions in crypto futures up 12% WoW, per CFTC.
- **Sentiment**: 68% positive, Fear & Greed Index at 72 (Greed).
- **USD Index (DXY)**: Down 0.8% WoW, supporting altcoin strength.

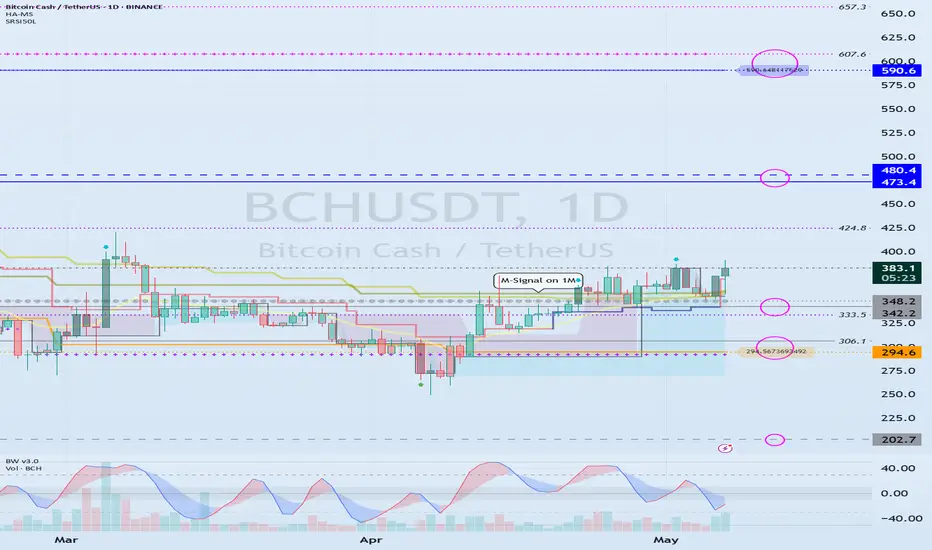
BCHUSDT LONG/BUYBy utilizing Fibonacci retracement levels, historical patterns, , we can formulate a hypothesis that the market might follow a similar trajectory if bullish sentiment prevails.
Mid-term uptrend starts: 333.5-348.2 or higher
Hello, traders.
If you "Follow", you can always get new information quickly.
Please click "Boost" as well.
Have a nice day today.
-------------------------------------
(BCHUSDT 1D chart)
The M-Signal indicators on the 1M, 1W, and 1D charts are showing an upward trend in a convergent state.
Accordingly, if the price is maintained above 333.5-348.2, it is expected to continue the uptrend in the mid- to long-term.
If the uptrend continues,
1st: 473.4-480.4
2nd: 590.6
You should respond depending on whether there is support near the 1st and 2nd above.
If it falls below 333.5, you should check if it is supported around 294.6.
-
Thank you for reading to the end.
I hope you have a successful trade.
--------------------------------------------------
- Here is an explanation of the big picture.
I used TradingView's INDEX chart to check the entire range of BTC.
I rewrote it to update the previous chart while touching the Fibonacci ratio range of 1.902 (101875.70) ~ 2 (106275.10).
(Previous BTCUSD 12M chart)
Looking at the big picture, it seems to have been maintaining an upward trend following a pattern since 2015.
In other words, it is a pattern that maintains a 3-year bull market and faces a 1-year bear market.
Accordingly, the bull market is expected to continue until 2025.
-
(Current BTCUSD 12M chart)
Based on the currently written Fibonacci ratio, it is displayed up to 3.618 (178910.15).
It is expected that it will not fall again below the Fibonacci ratio of 0.618 (44234.54).
(BTCUSDT 12M chart)
Based on the BTCUSDT chart, I think it is around 42283.58.
-
I will explain it again with the BTCUSD chart.
The Fibonacci ratio ranges marked in the green boxes, 1.902 (101875.70) ~ 2 (106275.10) and 3 (151166.97) ~ 3.14 (157451.83), are expected to be important support and resistance ranges.
In other words, it seems likely that they will act as volume profile ranges.
Therefore, in order to break through these ranges upward, I think the point to watch is whether they can receive support and rise near the Fibonacci ratios of 1.618 (89126.41) and 2.618 (134018.28).
Therefore, the maximum rising range in 2025 is expected to be the 3 (151166.97) ~ 3.14 (157451.83) range.
In order to do that, we need to see if it is supported and rises near 2.618 (134018.28).
If it falls after the bull market in 2025, we don't know how far it will fall, but based on the previous decline, we expect it to fall by about -60% to -70%.
Therefore, if it starts to fall near the Fibonacci ratio 3.14 (157451.83), it seems likely that it will fall to around Fibonacci 0.618 (44234.54).
I will explain more details when the bear market starts.
------------------------------------------------------