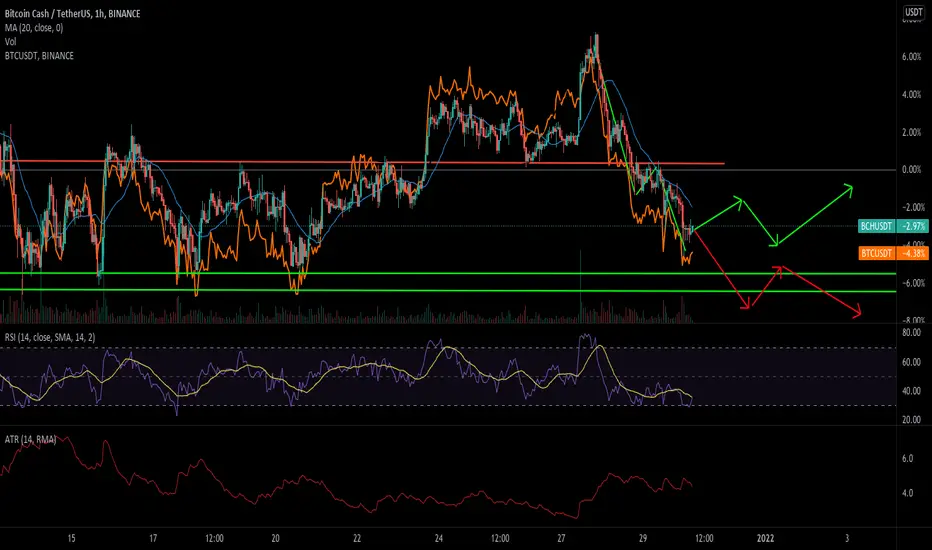
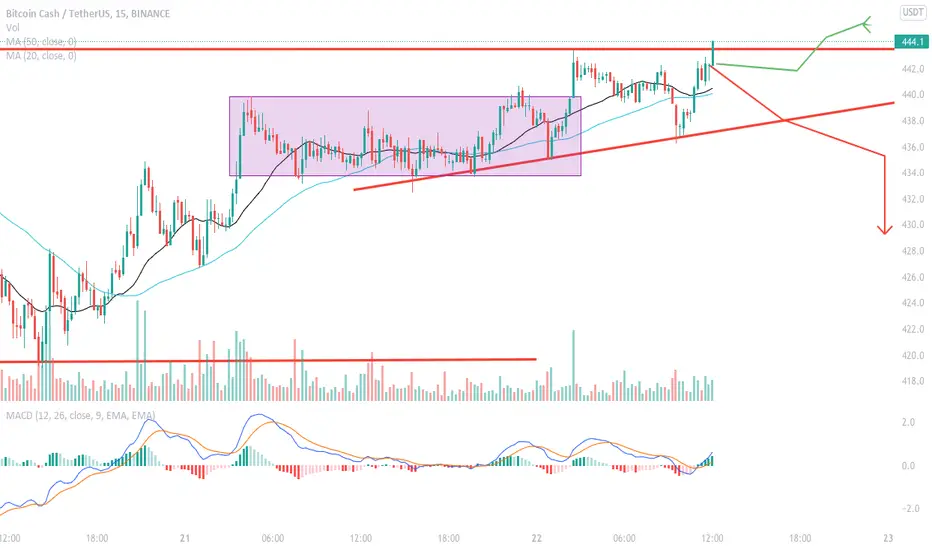
Analysis of BCHUSDTBCH is exactly following the price action of BTC. They both come to a high-value zone which has been tested two many times since 4th Dec's freefall. Regarding RSI, it is still on the margin of 30. And the Average range goes to the recent high so the likelihood of narrow waving is high and tomorrow would be new year's eve. For the coming few days, I tend to think the price of fluctuation remains very low.
sell 437/ buy 426/ stop 443
BCHUSDT trade ideas
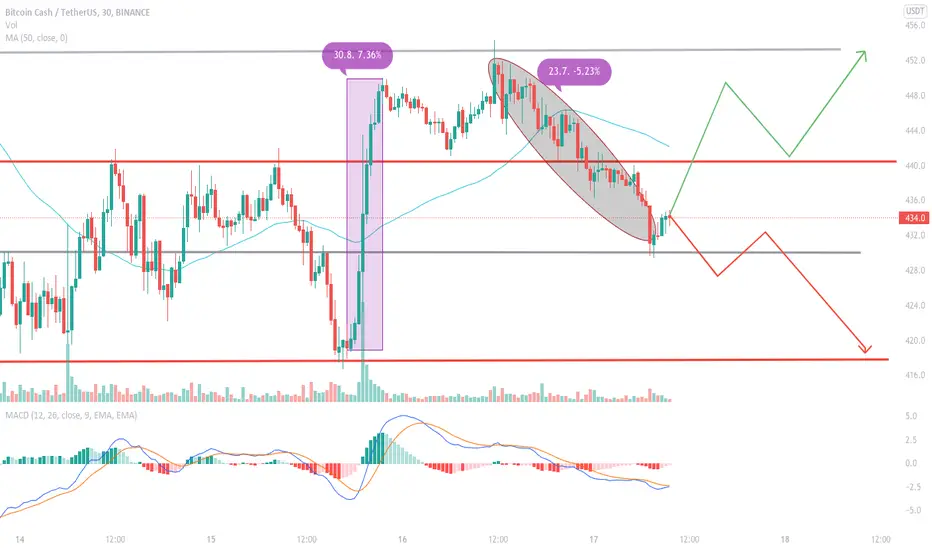
One day analysis of BCHUSDTthe uptrend has been reversed. Short-term resistance:445,next support: 435. Even though the trend direction has changed, it's still unlikely to suffer a big freefall.
@Bullish view: the market will try to conquer the resistance again and stand above it to continue the consolidation, the wave range might go to 440-480.
@Bearish view: 445 this resistance will become the pullback high and start another falling round lower than 433. Swap to 15 mins we can see this position has been tested 2 times and the second bounce is less than the previous time, so for 15mins if the price goes below 438 it's a good time to go short.

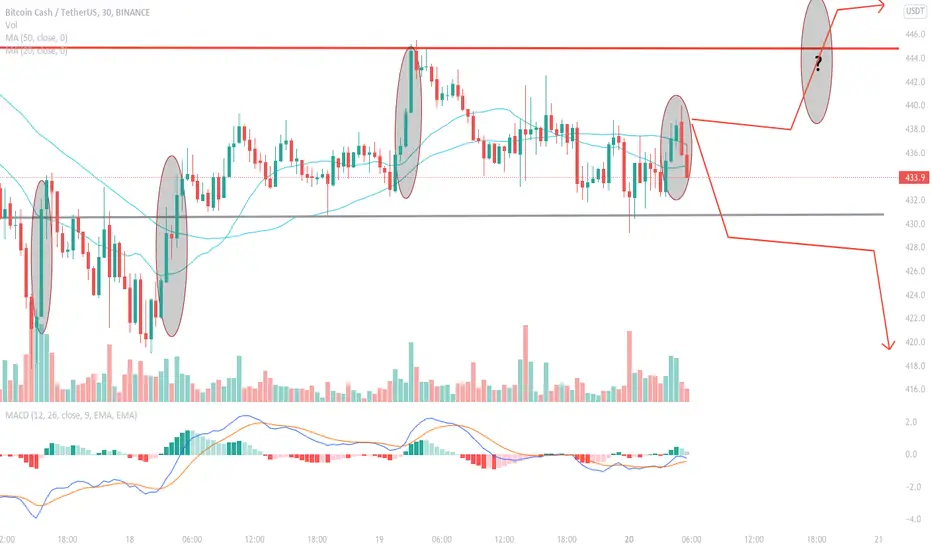
One day analysis of BCHUSDTnow a really critical position with one hand it was the previous neckline, and the other hand the last major swing level. The weird thing is the high volume that happened on 27th Dec now keeps silent, we can't even see a notable buy volume shows when it's falling down. This means the individuals were not that interested or they don't think it's a good time to buy at the dip. Either way is negative toward the future market. Without individuals' passion, the whale wouldn't make much effort to push the price up. Price can struggle here to remain above 445 in order to keep the uptrend.

One day analysis of BCHUSDTAfter 24th's breakthrough, the highest price went to 461.2 on Binance. it doesn't have the power to keep conquering higher positions so the price started to pull back and with no surprise, tested the previous resistance(44-450). Also the previous double bottom's neckline. We can imagine how big the support is in this high-value area. When changing the timeframe to 1 hour, the chart shows an uptrend line with higher lows which is another good signal. As long as the price didn't go blow 440, it can still be seen as an uptrend now as we should seek for a long position.
BCHUSDT ANALYSISIf you're investing 1,000$ into BCH
buy 20% now at support
buy 30% when the candle open / close above downtrend line (blue)
buy 50% when you get 2 BUY signals from Robo

Merry Christmas! Crypto top volume analysis.Merry Christmas (Happy Holidays) to all my friends in the TradingView community! I wish you all health, happiness and prosperity. Here's a unique, side by side, analysis of the top Cryptos exchanged by gross volume with a net volume indicator. This helps to magnify and look "under the hood" of what's going on underneath the surface of the crypto market, to find patterns, divergence and/or correlations. I'm not sure if this is going to publish all scrunched up, but on my end I can "toggle maximize" or "full screen" mode.
Top 10 crypto market gross volume 24hr:
USDT = $60,096,402,005
BTC = $24,318,186,877
ETH = $12,591,356,372
BCH = $5,451,150,219
BUSD = $4,231,732,311
XRP = $3,915,445,810
LUNA = $3,830,973,100
USDC = $3,406,533,339
SOL = $2,248,034,112
SHIB = $2,120,395,623
Do your own due diligence, your risk is 100% your responsibility. This is for educational and entertainment purposes only. You win some or you learn some. Consider being charitable with some of your profit to help humankind. Good luck and happy trading friends...
*3x lucky 7s of trading*
7pt Trading compass:
Price action, entry/exit
Volume average/direction
Trend, patterns, momentum
Newsworthy current events
Revenue
Earnings
Balance sheet
7 Common mistakes:
+5% portfolio trades, capital risk management
Beware of analyst's motives
Emotions & Opinions
FOMO : bad timing, the market is ruthless, be shrewd
Lack of planning & discipline
Forgetting restraint
Obdurate repetitive errors, no adaptation
7 Important tools:
Trading View app!, Brokerage UI
Accurate indicators & settings
Wide screen monitor/s
Trading log (pencil & graph paper)
Big, organized desk
Reading books, playing chess
Sorted watch-list
Checkout my indicators:
Fibonacci VIP - volume
Fibonacci MA7 - price
pi RSI - trend momentum
TTC - trend channel
AlertiT - notification
tradingview.sweetlogin.com

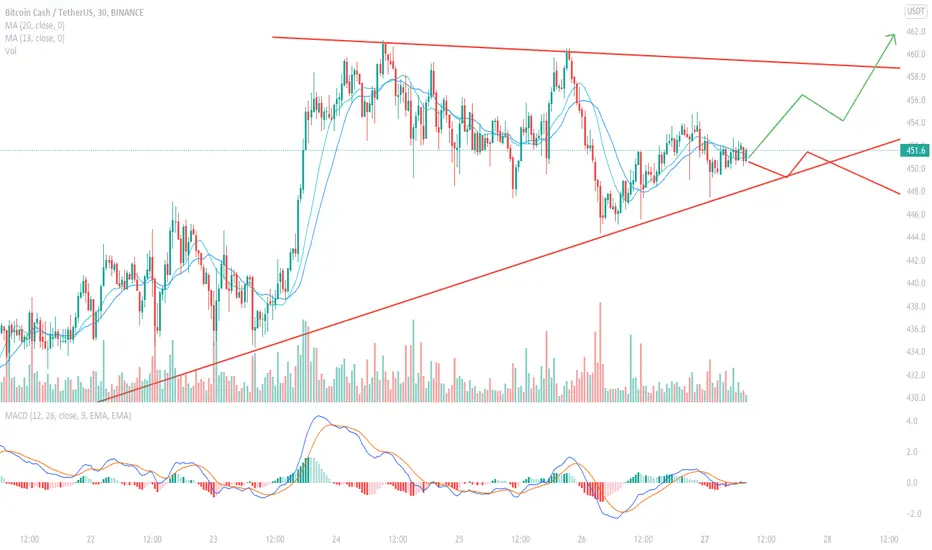
One day analysis of BCHUSDTSo yesterday was totally wrong, instead of going back and forth, the price directly breakthrough to the upside after hitting 435 (before this position has supported price many times) .
No more pullbacks. Now the chart shows double bottoms usually a trend reversal formation,(if look back a little bit, can be seen as three bottoms, the price formed three valleys, and forwarding one wasn't able to go below the prior one). then price broke the neckline and kept moving up.
By calculating the distance between the bottom and neckline, the next swing high target is around 472. If pullback occurs to test the neckline, it would provide another entry point. Still need to break through the previous high first then it can be seen as the trend reversal and we are in long trades.

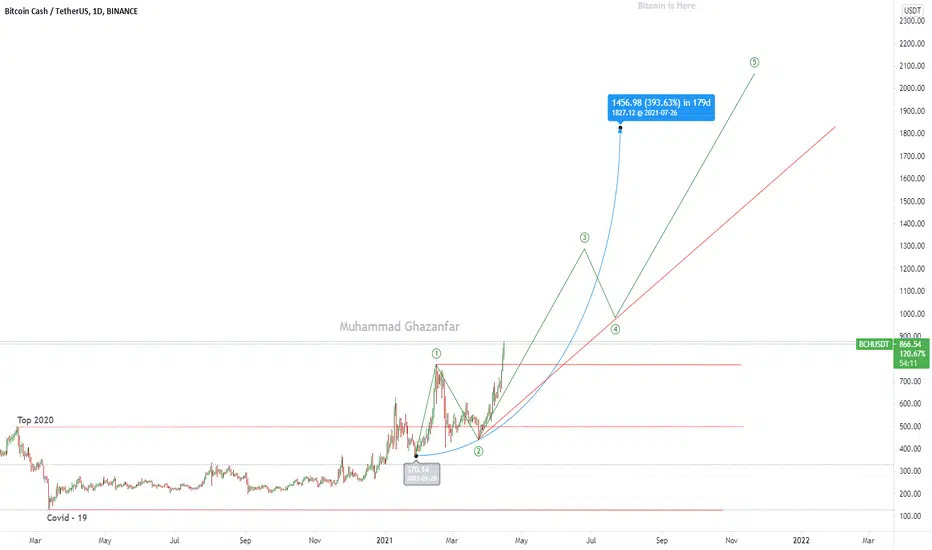
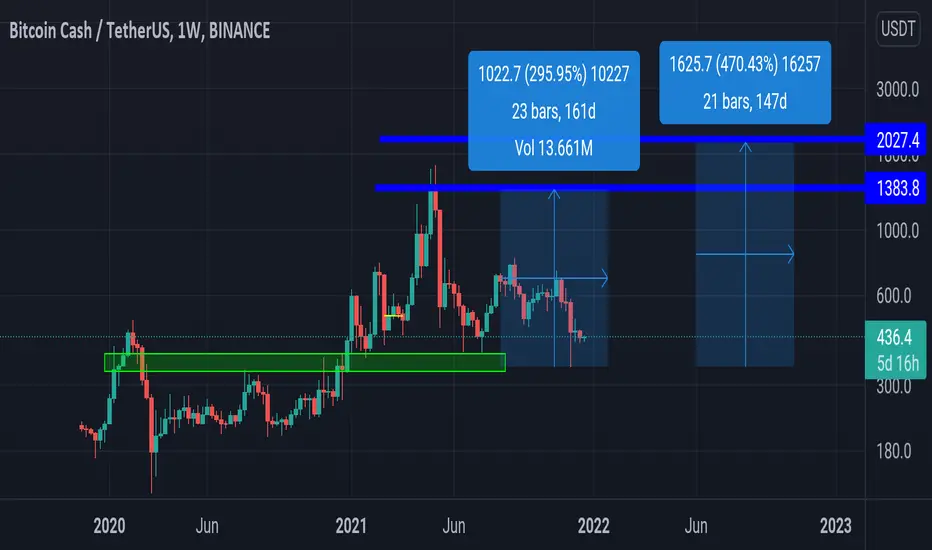
BCH/USDT - One Day Chart - Next Target 1,200I follow the chart pattern strategy a lot of is trading in the area zone and $BCH Still training in the Bottom line.
$BCH will go $2,000 in a couple of weeks by Elliott wave and we entered the second Elliott wave phase and The Market is extremely bullish for the long term.
One day analysis of BCHUSDTfeels like another correcting is happening and the price will go back to 418. Price's range of fluctuation is 418-445. Lucky there's a midpoint at 432. It might not be able to go back within the day so tend to think it will hit the midpoint then back and forth for a while. When looking at the smaller timeframe like 5mins, the situation isn't very positive. Since 8:30 22nd Dec, We can find many times of slow rise, the rapid fall.
One day analysis of BCHUSDTwith 15 mins chart creating higher lows, the price is pushing up to the resistance level and narrowing the waving range. Seems the bulls have gathered enough power to conquer it. Would it still be so hard to stand above and crush back? below the short-term support 440. It might have the chance to try one more time. with a 1-hour chart, 3 bullish candles are forming and it is also critical to see whether the close price can be above 444. for now tend to think of any withdraw as a chance to buy it.
Bchusdt possible opportunityI think bch can go up again
Do your analys
Also dont forget money management
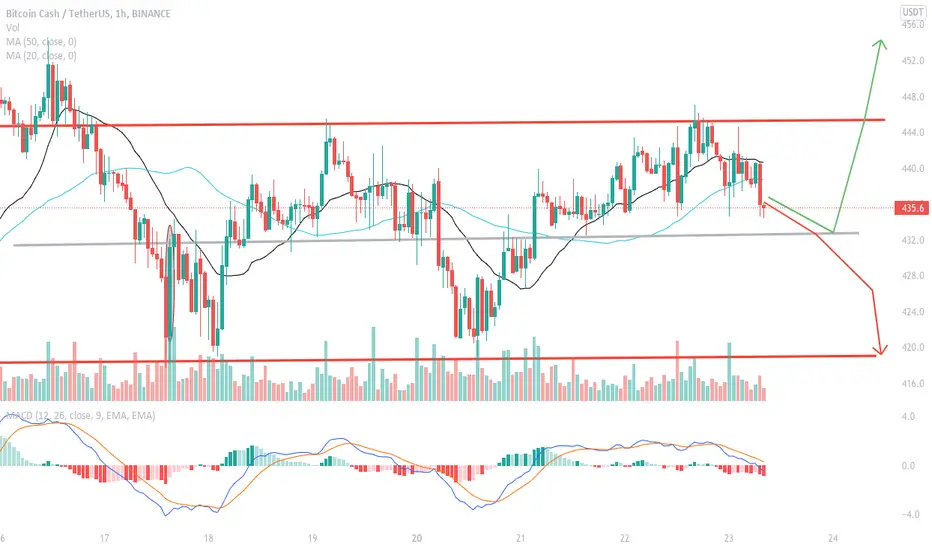
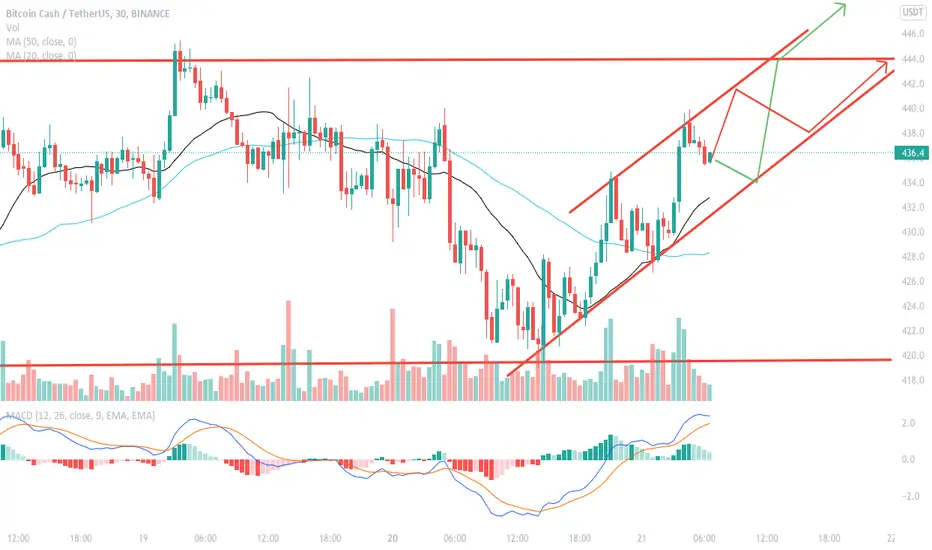
One day analysis of BCHUSDTdon't have too much to say. 15mins and 30 mins look like an uptrend channel. For the long-term view, the price has been supported at around 418 for 5 times:6th, 13th,15th,17th, and 20th. It is still under a consolidation, We'd probably see a breakthrough soon, at least going back to 500 if it can stand above 450.
One day analysis of BCHUSDT We can spot there are three price push-ups starting with 17th Dec afternoon. The first two times can be seen as a temporary double bottom. In terms of each time's shaking fall, it's likely the whale is absorbing the chips. Now the support is still in the previous midpoints(430) meanwhile formed two hammers when it is hit. The next rise should be cross the midpoint of this new range (around 430-445), and better to stand above 445 when it finished the soar.
435 buy /445 sell / 430 stop
One day analysis of BCHUSDTThe two grey lines are the midpoints of the two ranges respectively. leading the new waving range to 430-453. The recent market has been trickled persistently lower, without the churning volatility. This also shows that the previous soaring has been taken back almost 80%. Though there does appear some supports at the midpoint, the volume is not good. It’s more of a symbolic rebound. 4 hours MACD indicates a death cross is forming as well as 1-hour MACD keeps its bearish trend.
sell 436, buy 422, stop 443
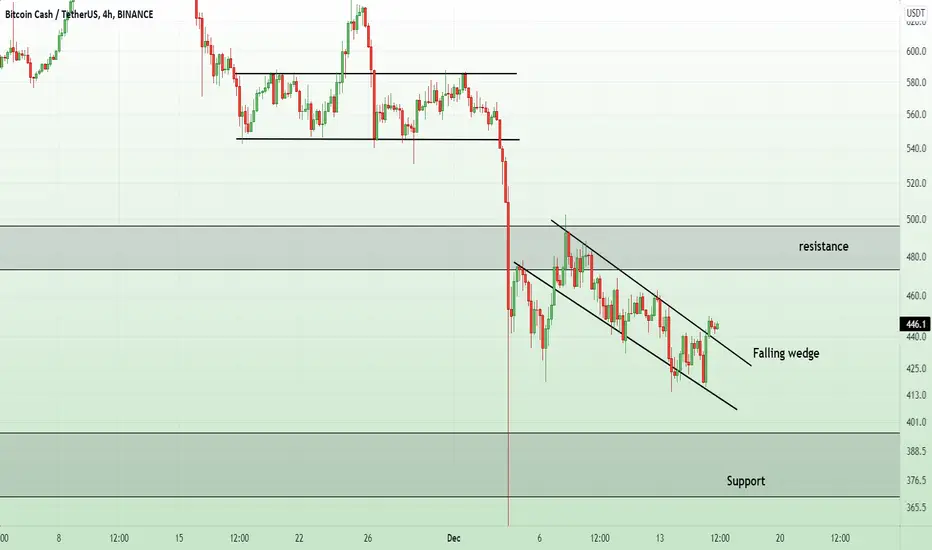
BCH/Breakdown of the falling wedge upwardThe price is at the best support level and has broken the wedge upwards, a false signal is possible, so you should be careful with decisions on this issue.
BCH analysisThe market has bottom out. Now the confidence has got back a little bit. Next target 467 or it would have another deep dive? For now it more likely to have a period of consolidation again, so the price fluctuation might not be very volatile. Potential range 440~453. If BTC do not have very good news then BCH's whale still unwilling to push the price up I guess.
441 buy/ 451 sell / 436 stop
