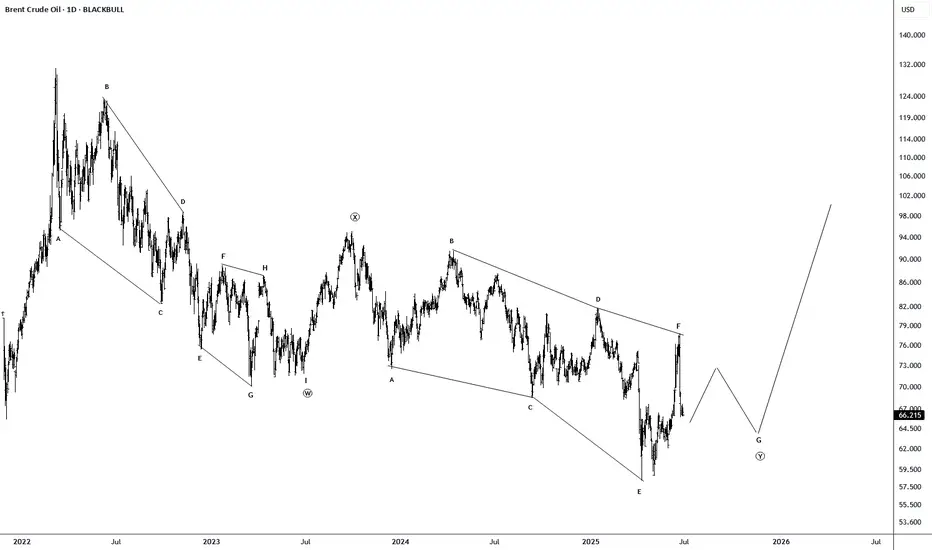
Crude oil $ukoil - Final falling oil has been a barometer of the financial market for the last decades.
I look at the formations and I see that we will see a renewal of the bottom in the coming months, I will not say the reasons, you just need to wait a little.
I've been talking about the fall for a long time, but it's not over yet.
After the final fall, I expect a renewal of the highs, due to the worsening situation in the Middle East, this will be after September
Best Regards EXCAVO
BCOUSD trade ideas
Middle East Tensions vs. Global Demand Hello Traders 🐺
🧠 Fundamental Insight:
Recent geopolitical developments in the Middle East — particularly tensions involving Iran, Israel, and unrest around the Red Sea shipping routes — have reignited fears of supply shocks in the oil market.
But how much of this is just market sentiment, and how much is a real, structural threat?
It’s important to note that most oil-producing nations in the Middle East are heavily reliant on oil revenue to sustain domestic budgets.
Prolonged disruption in oil supply would backfire economically, forcing them to eventually restore production — or risk budget deficits, currency devaluation, or inflation.
Moreover, while global efforts are pushing toward electrification and renewable energy, a large portion of electricity is still generated using fossil fuels — many of which are petroleum-based.
So even as demand shifts in form (from gasoline to electricity), crude oil remains embedded in the global energy matrix.
🇺🇸 The U.S. & 🇨🇳 China: Macro Drivers at Work
The U.S. remains the world’s largest oil producer thanks to shale output. Any significant rise in Brent can be quickly counterbalanced by a ramp-up in U.S. production.
The Fed’s monetary policy also plays a role. A stronger USD (via rate hikes) generally pressures oil prices downward.
China, as the largest importer of crude, has a decisive influence on demand. Weak industrial output or real estate troubles in China can nullify even a strong supply shock.
Watch for China’s stimulus policies — any sign of renewed growth can boost Brent significantly.
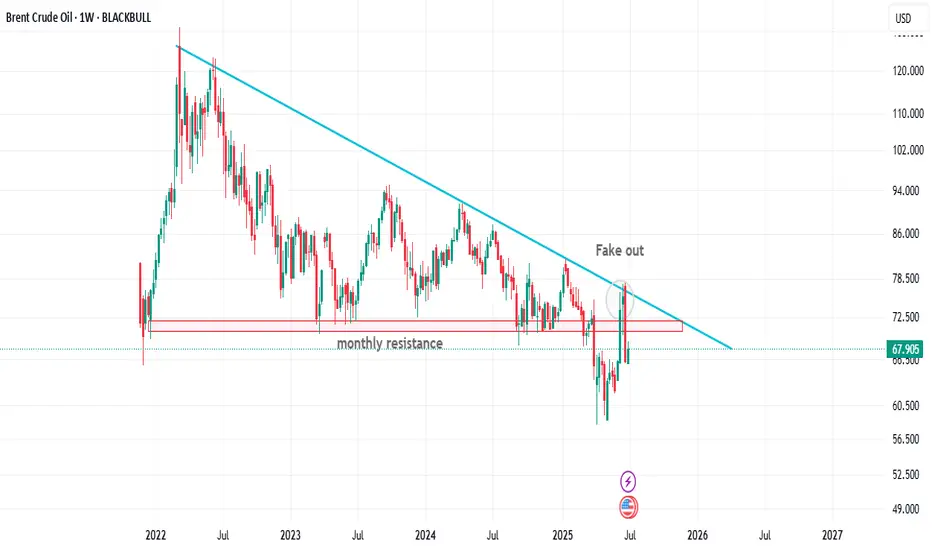
📉 Technical Outlook (Brent Crude - Weekly Chart Hypothesis):
As you can see on the weekly chart , price was trying to pump above the monthly resistance area however It's turned into the fake out and all of us knows that this is a massive sign of weakness for BRENT but I still think that price is currently could goes a little bit higher than the current level and break above the blue trend line in the mid term .
Any news-driven spike (e.g., new conflict headlines) must be validated by volume and follow-through — otherwise, it's a fade opportunity.
🎯 Conclusion:
Don’t blindly buy into every geopolitical headline.
While the Middle East remains a key risk factor for Brent, true price action will depend on the balance between physical disruptions and global demand signals — particularly from the U.S. and China.
In this market, the chart reacts first, but macro confirms the move.
As traders, we must track both — not just price, but purpose.
let me know what you are thinking about the current situation in the comment section down below !
and as always remember :
🐺 Discipline is rarely enjoyable , but almost always profitable 🐺
🐺 KIU_COIN 🐺
Brent Crude Oil Long Swing Setup – Support Break at Key LevelBrent Crude Oil OANDA:BCOUSD has broken to the next key support level after a cease-fire announcement in the Middle East. A long position is considered only if support holds at $69.00.
📌 Trade Setup:
• Entry Zone: $69.00
• Take Profit Targets:
🥇 $73.50 – $76.00
🥈 $79.00 – $83.00
• Stop Loss: Daily close below $67.00
#BrentCrude #OilTrading #ForexTrading #LongPosition #SupportLevel #TradeSetup #CrudeOil #MarketAnalysis #TradingOpportunities #Commodities #OilMarket #Investing #PriceAction #OilPrices #TradingStrategy #ForexCommunity #InvestmentOpportunities #MarketUpdate
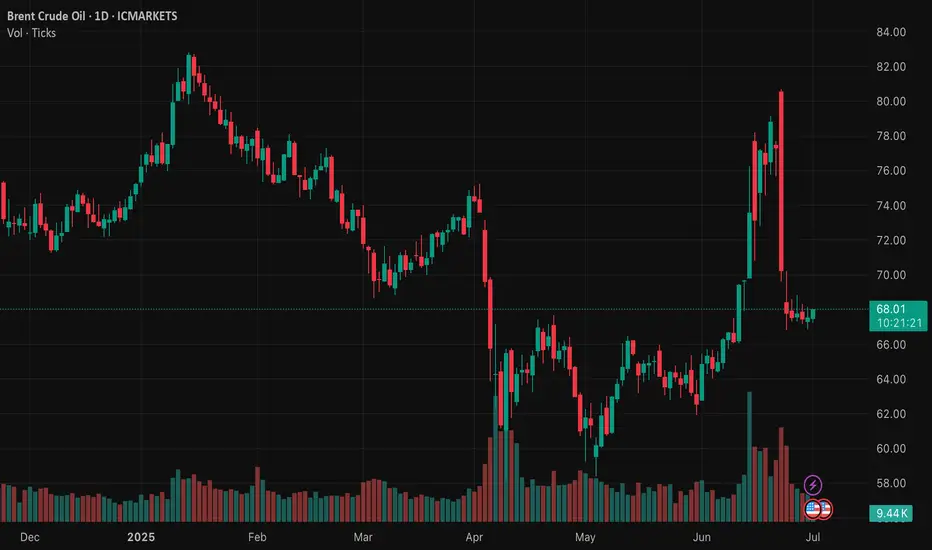
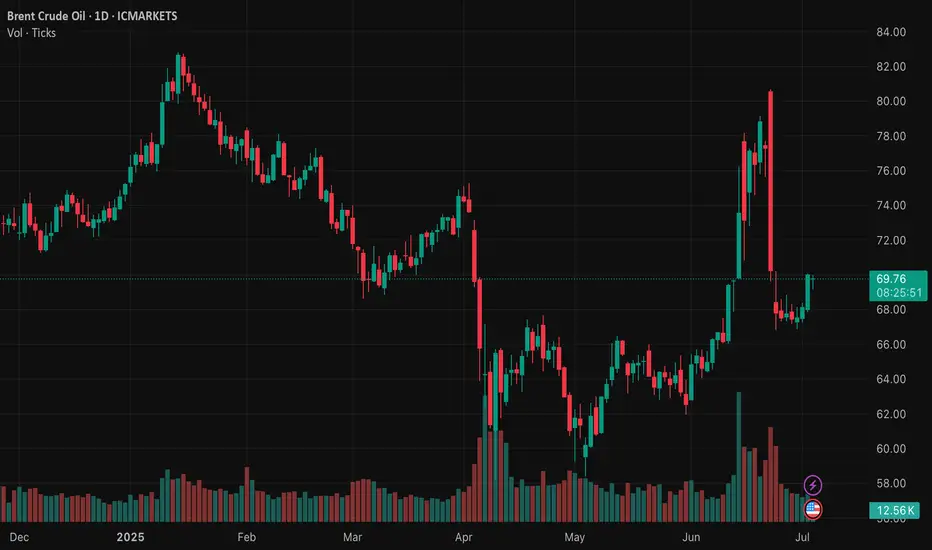
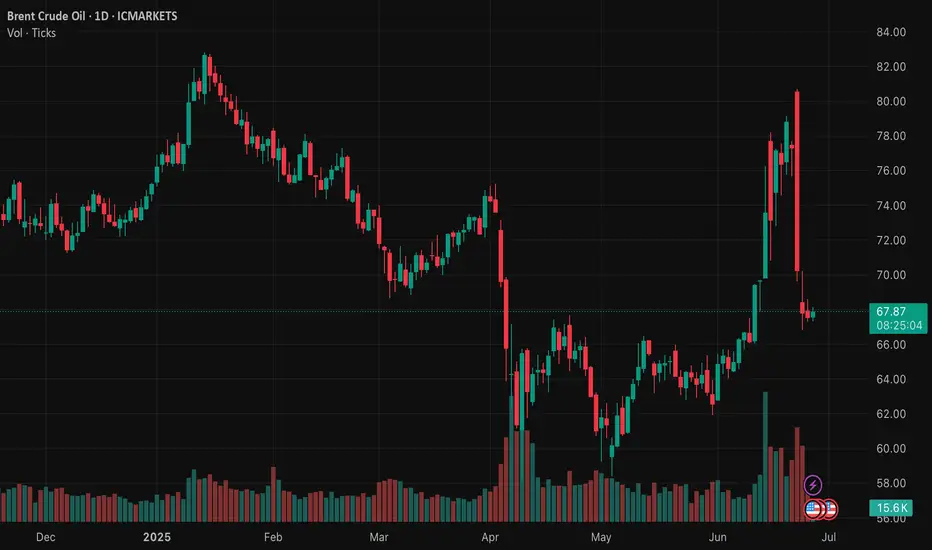
Here's why oil prices continue to slumpBrent Crude remains under pressure and has really caught our eye. The weakness in recent weeks is significant. The price recently failed to hold above its 200-day moving average, reinforcing downside risks. Without momentum, prices could revisit June lows unless short-term hurdles at US$69 and US$72 are decisively cleared.
This weakness aligns with BP's latest Energy Outlook, which is due out this week (usually in July each year). We'll be keeping a close on global wind and solar capacities, which are projected to increase eightfold and fourteenfold, respectively, by 2050. This rapid growth in renewables, coupled with declining oil demand, suggests a structural shift in energy markets.
China is leading this shift. By 2030, it is projected to install over 500 gigawatts of solar capacity annually, surpassing the United States' total annual energy production. This underscores the scale of China's renewable energy expansion.
The technical rejection at the 200-day moving average, combined with BP's forecasted demand peak, indicates a bearish outlook for oil. Unless Brent can reclaim and sustain levels above key resistance points, further declines are likely.
The convergence of technical weakness and shifting demand dynamics underscores a bearish stance on oil. Traders should monitor key technical levels and remain cautious amid these evolving market conditions.
The forecasts provided herein are intended for informational purposes only and should not be construed as guarantees of future performance. This is an example only to enhance a consumer's understanding of the strategy being described above and is not to be taken as Blueberry Markets providing personal advice.

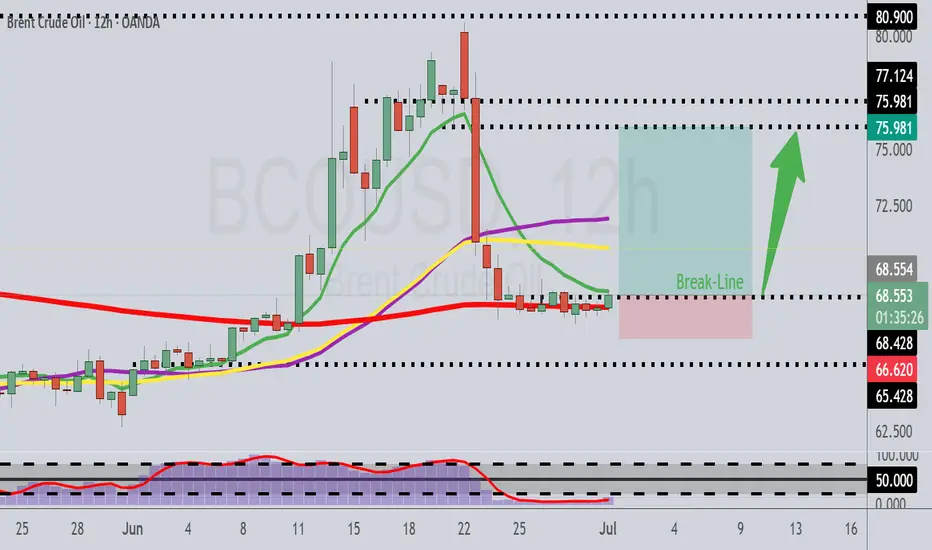
Breakout In Crude OilHey fellow traders! Looks like we could have a breakout in crude oil!
Summer's here so, no surprise we would see a rise.
Target price is 75.981 area.
Beat the summer increase in gas prices by joining in on the action and long the crude futures.
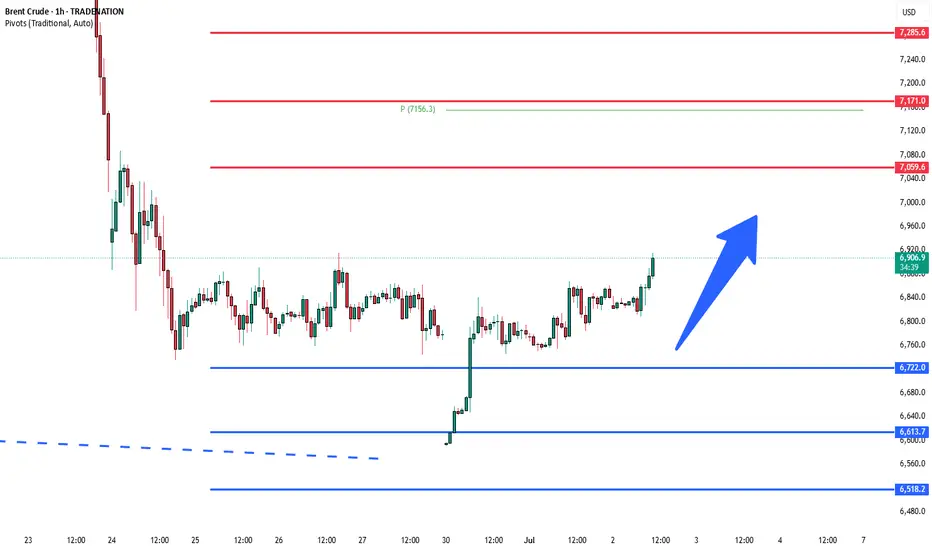
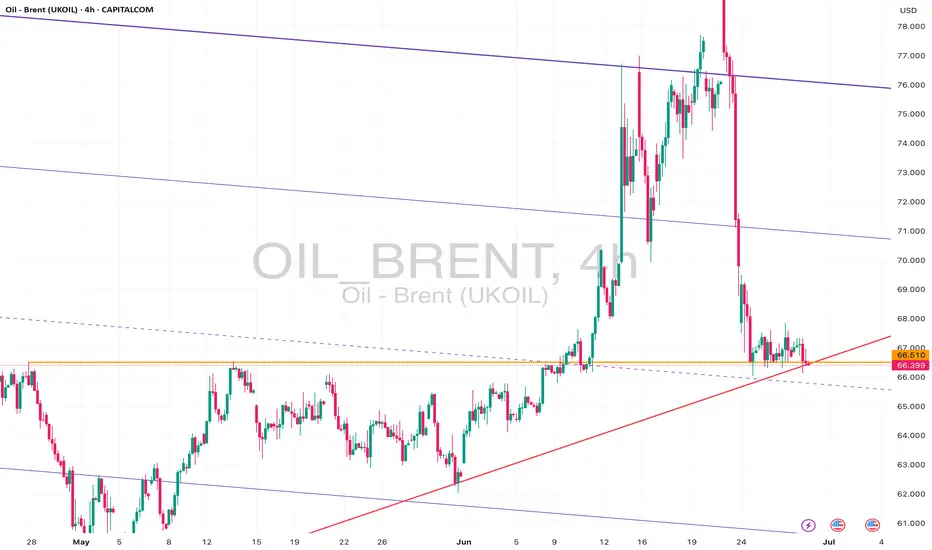
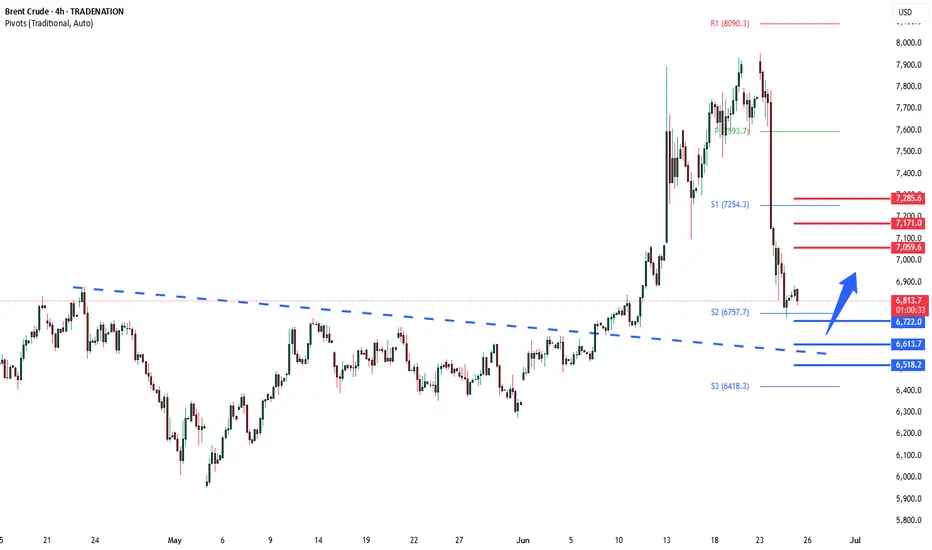
Brent Crude support at 6720Key Support and Resistance Levels
Resistance Level 1: 7060
Resistance Level 2: 7170
Resistance Level 3: 7280
Support Level 1: 6720
Support Level 2: 6610
Support Level 3: 6520
This communication is for informational purposes only and should not be viewed as any form of recommendation as to a particular course of action or as investment advice. It is not intended as an offer or solicitation for the purchase or sale of any financial instrument or as an official confirmation of any transaction. Opinions, estimates and assumptions expressed herein are made as of the date of this communication and are subject to change without notice. This communication has been prepared based upon information, including market prices, data and other information, believed to be reliable; however, Trade Nation does not warrant its completeness or accuracy. All market prices and market data contained in or attached to this communication are indicative and subject to change without notice.
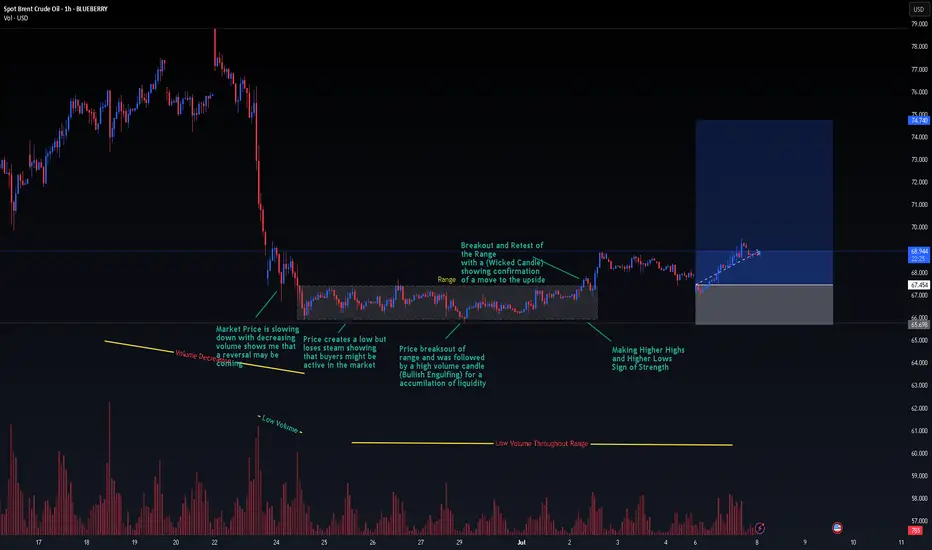
Brent Crude Oil Long Setup: Breakout, Retest, and Bullish StructOn the 1-hour timeframe, price formed a tight range after a strong downtrend. Selling pressure weakened, and buyers started stepping in. A bullish engulfing candle broke the range with high volume, signaling accumulation.
Price then retested the breakout with a wick, confirming strength. Since then, we’ve seen higher highs and higher lows — a clear sign buyers are in control and price is ready to move higher.
XBRUSD is testing the Support Level 66.10 👀 Possible scenario:
Oil prices were steady on July 1 as investors awaited the expected OPEC+ decision to raise output by 411,000 bpd in August. If confirmed at the July 6 meeting, it would bring this year’s total increase to 1.78 million bpd—over 1.5% of global demand.
The move, led by Saudi Arabia, aims to curb overproduction and regain market share. Meanwhile, easing geopolitical tensions and weak Chinese manufacturing data added downward pressure. Trade talks also remain in focus ahead of Trump’s July 9 tariff deadline, which could raise global trade uncertainty. Morgan Stanley sees Brent falling to $60 by early 2026 on oversupply and waning risks.
✅ Support and Resistance Levels
Now, the support level is located at 66.10.
Resistance levels are now located at 77.50 .
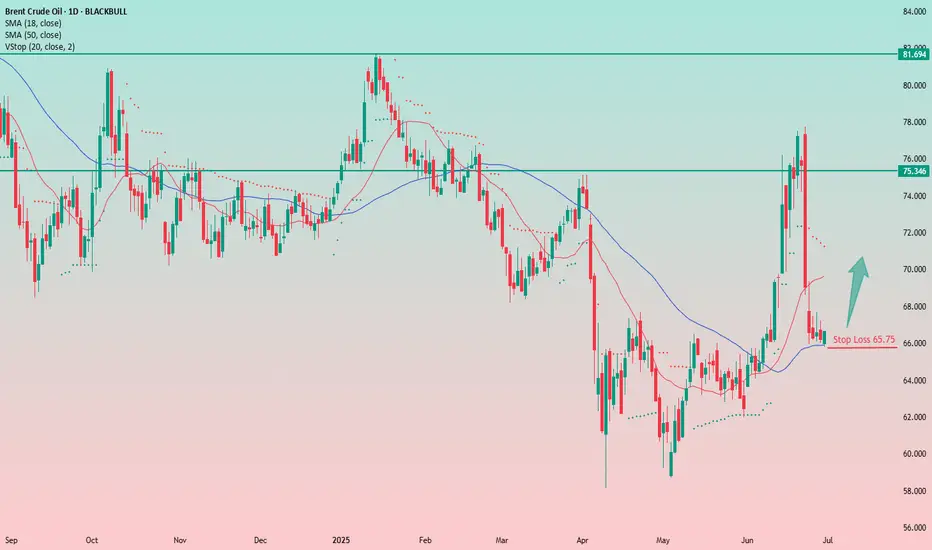
Crude Oil Bounce PlayAn interesting setup in crude oil with a tight stop at $65.75 and the first target in the $70–71 range.
It’s a bounce play. I'm usually not a big fan of these, but here I like the tight stop, the broader macro context, the sharp drop from the $76 level, and the subsequent consolidation around $66.5.
Let’s see how it plays out — I’ve entered long!
Brent Oil – Bearish Break or Bounce from Long-Term Support?Brent Oil is hovering just above critical support near 66.00, with a clear bearish structure visible across timeframes:
🔎 15m & 1h:
Price action is consolidating near the ascending support trendline drawn from early June lows. Short-term price structure shows lower highs and lower lows, suggesting continued downside pressure.
📉 4h & 1D:
The recent sell-off from above 78.00 has pushed Brent back into the lower region of the broad descending channel. Daily and 4h charts show price testing confluence between the horizontal support at ~66.00 and a long-term rising trendline. A confirmed close below this level could accelerate bearish momentum towards 64.00 or even 62.00.
⚠️ Key Levels:
• Support: 66.00, 64.00, 62.00
• Resistance: 67.00, 69.00
• Bias: Bearish – price remains in a clear downtrend unless buyers reclaim above 67.50 with strong volume.
📌 Outlook:
As long as Brent holds below 67.00 and the descending trendline caps rallies, my bias is bearish. A breakdown of 66.00 on higher timeframes would open the door for a move towards lower channel support levels. However, if buyers defend and push back above 67.50, we could see a short-term relief rally.
Brent crude: why I'm not trading oil right nowBrent crude surged earlier this month on war headlines, and our trade setups nailed the moves. But right now, the market offers no edge. Volatility is fading and price is stuck in a large triangle. Unless you have geopolitical insight, there's no clear reason to trade. In this video, I explain why I'm staying out and what I’ll look for next.
This content is not directed to residents of the EU or UK. Any opinions, news, research, analyses, prices or other information contained on this website is provided as general market commentary and does not constitute investment advice. ThinkMarkets will not accept liability for any loss or damage including, without limitation, to any loss of profit which may arise directly or indirectly from use of or reliance on such information.

Brent Oil Robbery: The Thief’s Guide to Energy Market Profits! 🚨💰 THE OIL VAULT HEIST: UK OIL SPOT/BRENT TRADING STRATEGY 💸🔫
🌟Hi! Hola! Ola! Bonjour! Hallo! Marhaba!🌟
Dear Money Makers & Robbers 🤑💰💸✈️
Based on our 🔥Thief Trading style analysis🔥 (both technical and fundamental), here’s the master plan to heist the UK Oil Spot/Brent Energy Market. Follow the blueprint carefully—this strategy focuses on long entries, with a daring escape planned near the high-risk RED MA Zone where bearish robbers and consolidation traps await. 🏆💸 Take your profit and treat yourself, fellow traders—you earned it! 💪🏆🎉
🕵️♂️ Entry 📈
💥 The vault is wide open! Time to swipe that bullish loot—heist is on!
Place buy limit orders within the 15 or 30-minute timeframe, near swing lows/highs for pullback entries.
🛑 Stop Loss 🛑
📍 Thief’s SL—recent swing low and below the moving average (4H timeframe) for day/swing trades.
📍 Adjust SL based on risk, lot size, and number of orders.
🎯 Target
🏴☠️💥 70.800 (Aim for the big loot!) OR escape before the target
🔥 Market Heist Overview
The UK Oil Spot/Brent market is currently showing bullishness 🐂, driven by key factors—perfect for a day/scalping trade robbery! ☝☝☝
📰 Additional Tools & Analysis
📊 Get the Fundamental, Macro, COT Report, Quantitative Analysis, Sentiment Outlook, Intermarket Analysis, Future Targets—check our bi0 liinks 👉👉👉🔗🔗
⚠️ Trading Alert: News Releases & Position Management
📰 News can rattle the vault! 💥
✅ Avoid new trades during news releases.
✅ Use trailing stop-loss orders to protect profits.
💖 Supporting our heist plan?
💥 Smash the Boost Button 💥 to empower the robbery team.
Let’s make money every day in this market with the Thief Trading Style! 🏆💪🤝❤️🎉🚀
👀 Stay tuned for the next robbery plan, thieves! 🤑🐱👤🤗🤩
OILI think this scenario can be considered for oil. Could the reason be the ongoing military conflict between Iran and Israel?
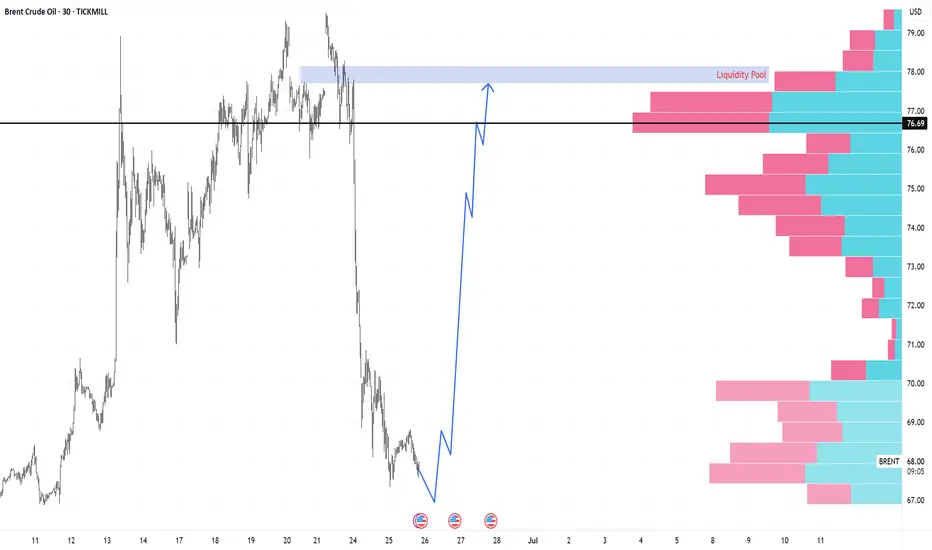
BRENT likely to reach 77.73 levelBRENT moved higher level due to war situation. BRENT is currently in downtrend and consolidating.
After consolidation BRENT is likely to rise back to 77.73 level.
This is for educational purpose only. Not an investment or financial advise.
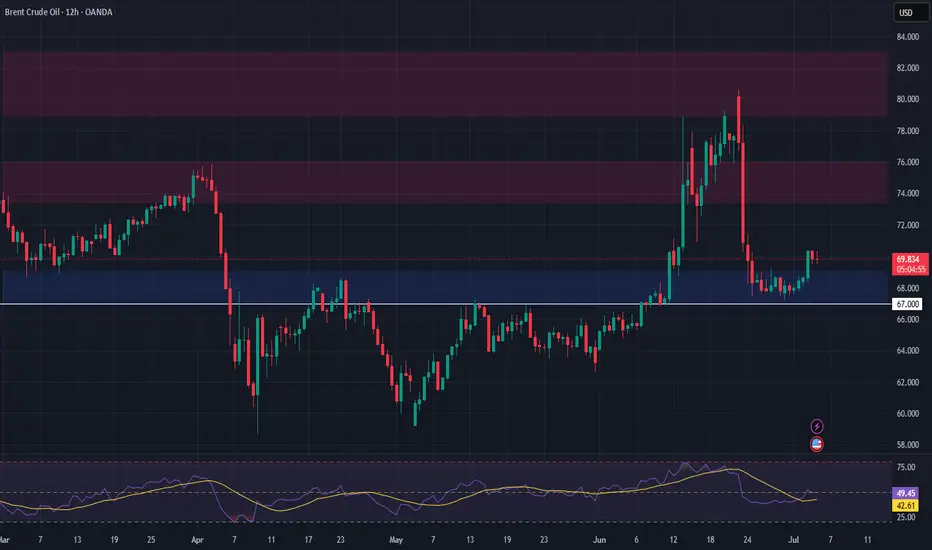
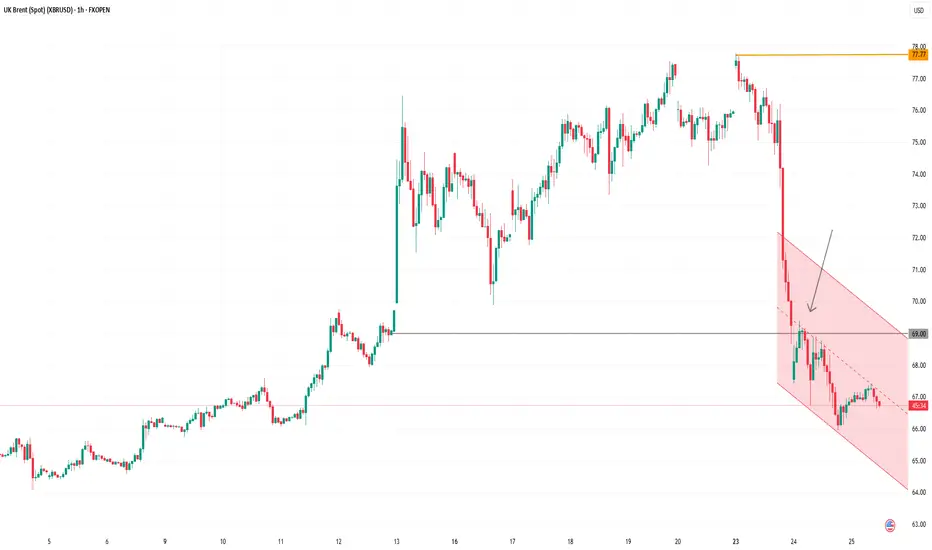
Oil Price Falls Below $69Oil Price Falls Below Pre-Escalation Levels of Middle East Conflict
According to the XBR/USD chart:
→ Prior to Israel’s airstrikes on Iran on 13 June, the price of Brent crude was hovering around the $69.00 mark;
→ Following US bombings in Iran, the price spiked at the Monday market open, reaching a high of approximately $77.77 (as we reported on 23 June).
However, after President Trump announced a ceasefire between Iran and Israel — later confirmed by statements from both sides — oil prices dropped sharply. This morning, Brent is trading around $68, which is even lower than the level seen before the initial strikes.
Media outlets report that analysts broadly agree that fears have eased, even if the ceasefire appears fragile. Market participants seem to view the likelihood of the conflict escalating into a full-scale ground war — involving US troops and the closure of the Strait of Hormuz — as low. Shipping through the strait is reportedly returning to normal.
Technical Analysis of the XBR/USD Chart
Interestingly, the $69 level — from which prices surged on 13 June — acted as resistance yesterday (as indicated by the arrow on the chart).
It can be assumed that the longer the ceasefire holds, the less relevant the fears that have served as bullish drivers. In that case, Brent crude prices may continue fluctuating within a downward channel, outlined in red, with the possibility of a short-term rise toward its upper boundary.
Nevertheless, the key drivers for oil prices will remain the fundamental backdrop and official statements regarding the situation in the Middle East and other geopolitical factors.
This article represents the opinion of the Companies operating under the FXOpen brand only. It is not to be construed as an offer, solicitation, or recommendation with respect to products and services provided by the Companies operating under the FXOpen brand, nor is it to be considered financial advice.
XBRUSD is moving within the 66.10 - 69.10 range👀 Possible scenario:
Crude oil fell to $68.00 on July 3 as markets braced for the possible return of higher U.S. tariffs after July 9 and a likely OPEC+ output hike of 411,000 bpd this weekend. Brent rebounded to $68.70.
Weak Chinese service data and a surprise 3.9M-barrel U.S. crude stock build added pressure. Gasoline inventories rose by 4.2M barrels, while distillates fell by 1.7M. Analysts expect short-term rallies to fade as bearish fundamentals—rising supply, weaker demand, and the loss of OPEC’s price support—begin to outweigh geopolitical risk. With the July 4 holiday ahead, traders are avoiding large positions.
✅Support and Resistance Levels
Now, the support level is located at 66.10.
Resistance levels are now located at 69.10 and 77.50 .
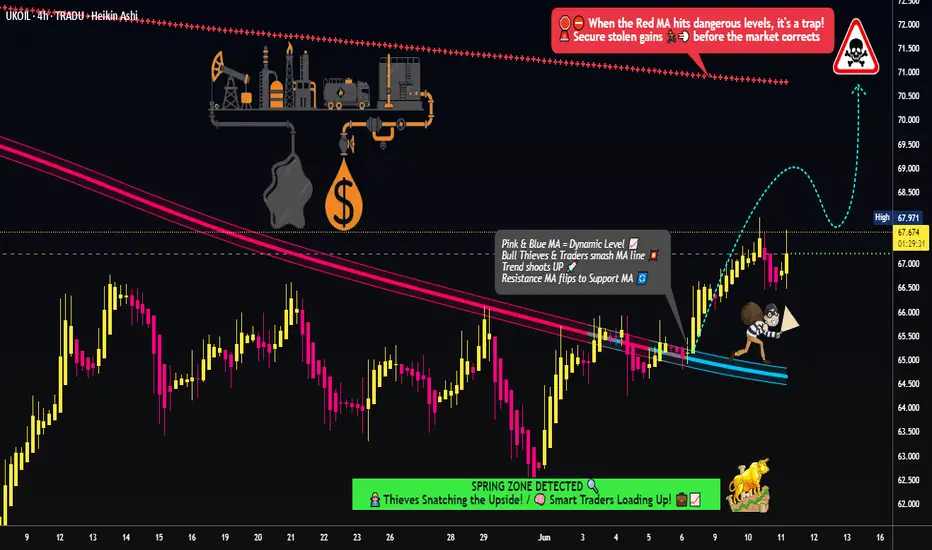
Brent Oil Breakout Heist – Bullish Robbery in Progress!🕶️ Brent Oil Job in Motion – Market Robbery Blueprint by The Chart Bandits 💼💸
What’s up, gang? 👋 Hola, Ola, Bonjour, Hallo, Marhaba! 🌍
Calling all market robbers, trend thieves, and slick profit snatchers! 🤑💰💥
We’ve got eyes on the UK Oil Spot / Brent Energy Market – and this time, it’s a clean breakout job. According to our Thief Trading Code (yeah, that’s the street manual we use), the setup’s lit and the vault’s wide open. Here’s the drill:
📈 Entry Plan – The Break-In Point:
The score begins above MA level 65.400. When that line cracks, it’s time to move.
You can either:
🔹 Set buy stop orders just above the breakout zone
🔹 Or wait for a pullback to a 15m or 30m swing low/high and enter with style
🚨 Pro tip: Set your alerts. Real thieves don’t sleep on breakouts.
🛑 Stop Loss – Safety First, Bandits:
Let the breakout breathe. Don’t slam the SL too early.
Once it confirms, tuck your SL near the 4H swing low – around 64.000.
Lot size, risk appetite, number of positions – all play into where you hide your exit door.
Just don’t blame the crew if you jump in blind. ⚠️
🎯 Take Profit – The Escape Route:
Target set at 70.000 – hit it, grab the bags, and disappear before the bears sniff us out. 🏃♂️💨
📊 Why This Heist Works:
The market’s lookin’ bullish – real heat from fundamentals like:
Macro setups
COT positioning
Intermarket analysis
Sentiment vibes
Storage & inventory updates
🔍 Want the full blueprint? Fundamentals, charts, deep dives – check my profille for the linkss 🔗👀
⚠️ Heads-Up – News Drops Can Wreck the Getaway:
Don’t enter during high-impact news
Protect profits with a trailing SL
Always expect the unexpected, robbers 🚧📉
💥 Smash the Boost Button if you’re part of the Thief Crew!
We’re not just trading – we’re executing blueprints and stealing clean gains.
Stay tuned for the next setup. You know what time it is...
🕶️ Trade smart, loot fast, vanish smooth. 🐱👤💸🚀

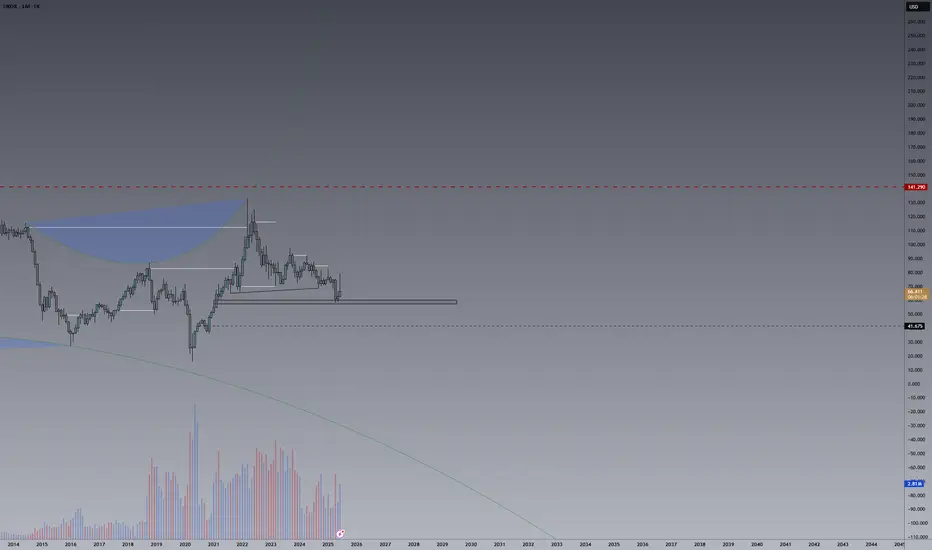
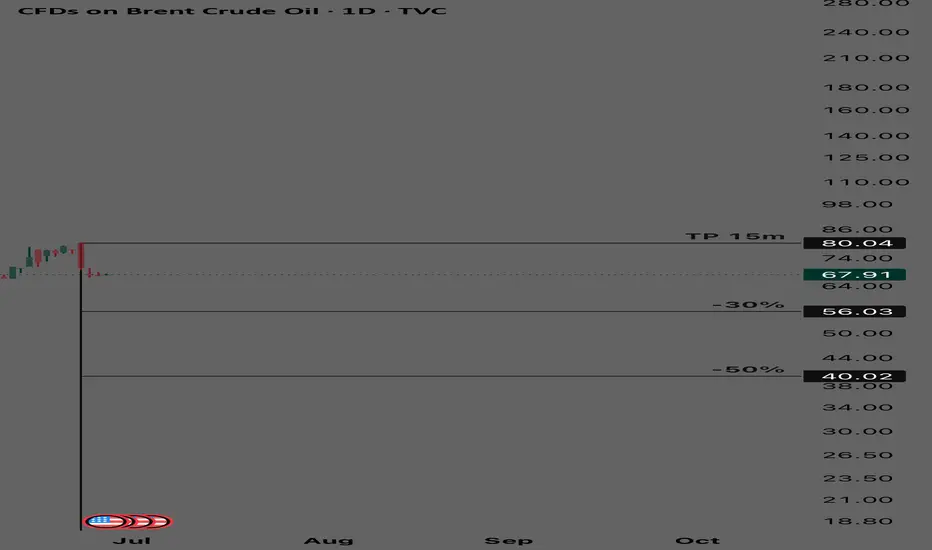
UKOIL - Midterm Buy Cycle UKOIL
MIDTERM BUY CYCLE
TP@80.04
% Bubble Ratio
Currently in a negative bubble with fair value at 80… cycle is midterm and expecting to reach the TP in less than a year…
Spot Trading Plan:
Entry starts at -30% bubble ratio and below
XBRUSD is testing the Support Level 66.10 👀 Possible scenario:
Oil prices steadied on June 26 after erasing earlier gains as investors remained cautious about the Iran-Israel ceasefire and refocused on market fundamentals. Brent crude is trading around $66.80 per barrel.
U.S. crude oil and fuel inventories fell sharply in the week ending June 20, with crude stocks dropping 5.8 million barrels—well above the expected 797,000-barrel decline, the Energy Information Administration (EIA) reported. Crude production rose slightly by 9,000 barrels per day to 13.43 million b/d. Meanwhile, crude imports decreased by 102,000 b/d to 6 million b/d, and exports fell by 8,000 b/d to 3.96 million b/d. OPEC+ may accelerate output hikes by about a year, according to Rosneft’s CEO. Analysts noted oil prices tracked equities lower amid these mixed signals.
✅ Support and Resistance Levels
Now, the support level is located at 66.10.
Resistance levels are now located at 77.50 .
Bren Crude Oil important support at 6720Key Support and Resistance Levels
Resistance Level 1: 7060
Resistance Level 2: 7170
Resistance Level 3: 7280
Support Level 1: 6720
Support Level 2: 6610
Support Level 3: 6520
This communication is for informational purposes only and should not be viewed as any form of recommendation as to a particular course of action or as investment advice. It is not intended as an offer or solicitation for the purchase or sale of any financial instrument or as an official confirmation of any transaction. Opinions, estimates and assumptions expressed herein are made as of the date of this communication and are subject to change without notice. This communication has been prepared based upon information, including market prices, data and other information, believed to be reliable; however, Trade Nation does not warrant its completeness or accuracy. All market prices and market data contained in or attached to this communication are indicative and subject to change without notice.
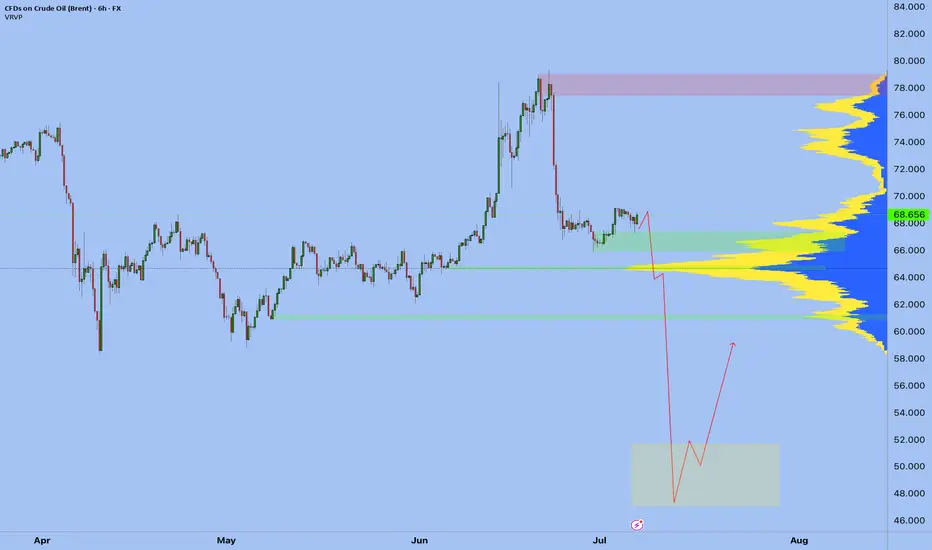
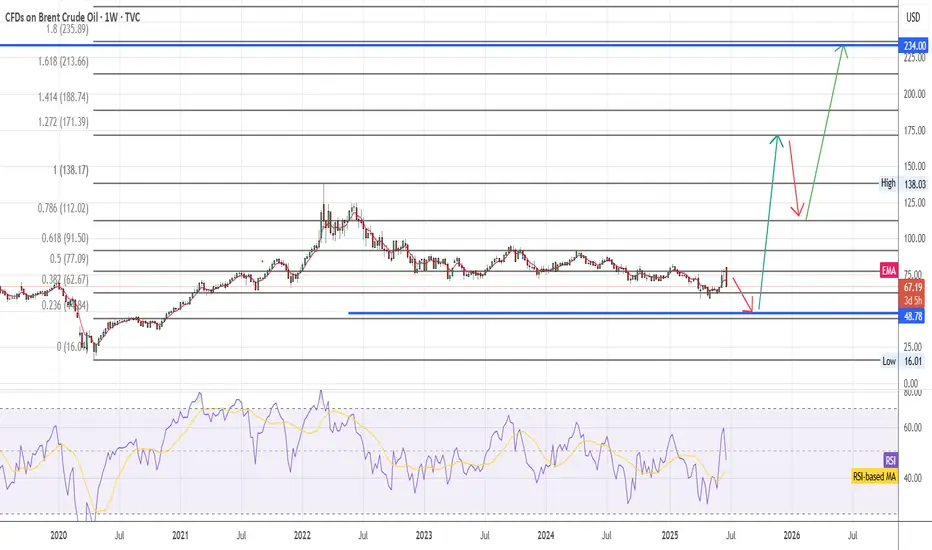
Brent Update - fall to 48$ area before trend reversalIn my updated view brent long term bearish trend has not stopped to 58$ area I expect in the short term a fall to 48$ area then the reversal my targets are 171$ and 234$
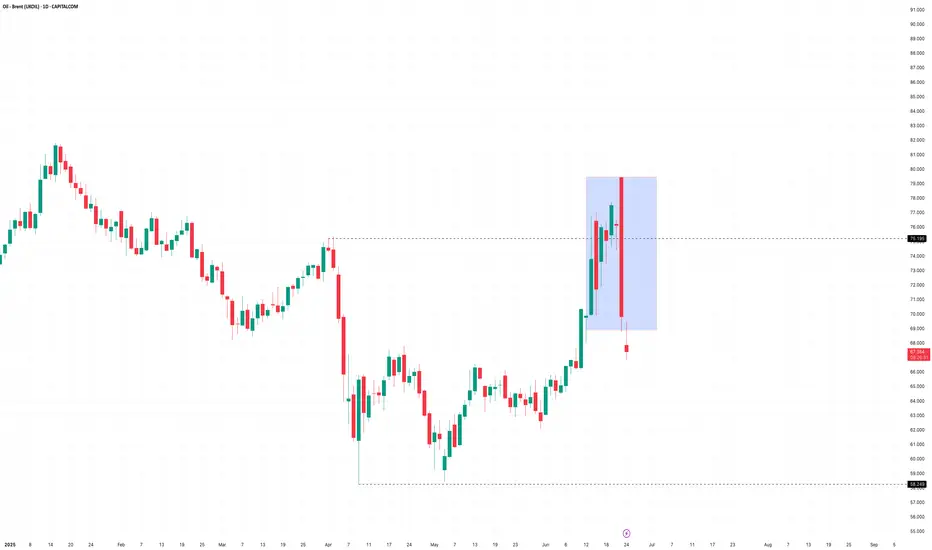
Brent Forms Bearish Engulfing Candle Amid De-escalation ShiftCrude oil’s conflict-driven rally may have run its course. After surging into resistance last week, Brent has now reversed sharply on signs of de-escalation in the Middle East.
Ceasefire Hopes Trigger a Sharp Reversal
Last week we highlighted that crude oil’s rally on the back of the Middle East conflict had taken the market right into a confluent area of resistance. While prices managed to break and hold above that resistance towards the end of the week as the conflict escalated, Monday’s session saw a sharp change in tone. The market gapped higher at the open following news of President Trump’s decision to bomb Iranian nuclear facilities, but those gains quickly unravelled.
What followed was a heavy sell-off as traders responded to rumours of a ceasefire agreement and interpreted Iran’s missile strike on a US base in Qatar as a calibrated, face-saving gesture. Market participants drew parallels with the 2020 playbook, where Tehran signalled retaliation while quietly coordinating with Washington to avoid further escalation. By the close, crude had surrendered all its intraday gains, and the conflict premium began to rapidly unwind.
Brent Crude (UKOIL) Daily Candle Chart
Past performance is not a reliable indicator of future results
Bearish Engulfing Pattern Shifts Momentum
Technically, the Monday’s price action left behind a large bearish engulfing candle which is a strong reversal signal where the day’s range eclipses the trading ranges of previous sessions. In this case, the engulfing candle swallowed the prior six days of price action, reinforcing its importance. The structure of this move consisting of a gap higher followed by a persistent sell-off suggests that buyers were caught offside and forced to capitulate.
The top of Monday’s candle now marks a key short-term high. It is the point where the rally met decisive selling pressure and provides a clear reference level for traders tracking short-term momentum. With the broader trend still defined by a series of lower highs and lower lows, the failure at resistance realigns the short-term outlook with the bigger picture.
That said, this remains a highly volatile and fluid situation. Geopolitical tensions can flare up again without warning, and markets are likely to remain headline-sensitive. Traders should use tools like the average true range (ATR) to calibrate risk appropriately in this fast-moving environment.
Brent Crude (UKOIL) Bearish Engulfing Pattern on Daily Candle Chart
Past performance is not a reliable indicator of future results
Disclaimer: This is for information and learning purposes only. The information provided does not constitute investment advice nor take into account the individual financial circumstances or objectives of any investor. Any information that may be provided relating to past performance is not a reliable indicator of future results or performance. Social media channels are not relevant for UK residents.
Spread bets and CFDs are complex instruments and come with a high risk of losing money rapidly due to leverage. 85.24% of retail investor accounts lose money when trading spread bets and CFDs with this provider. You should consider whether you understand how spread bets and CFDs work and whether you can afford to take the high risk of losing your money.