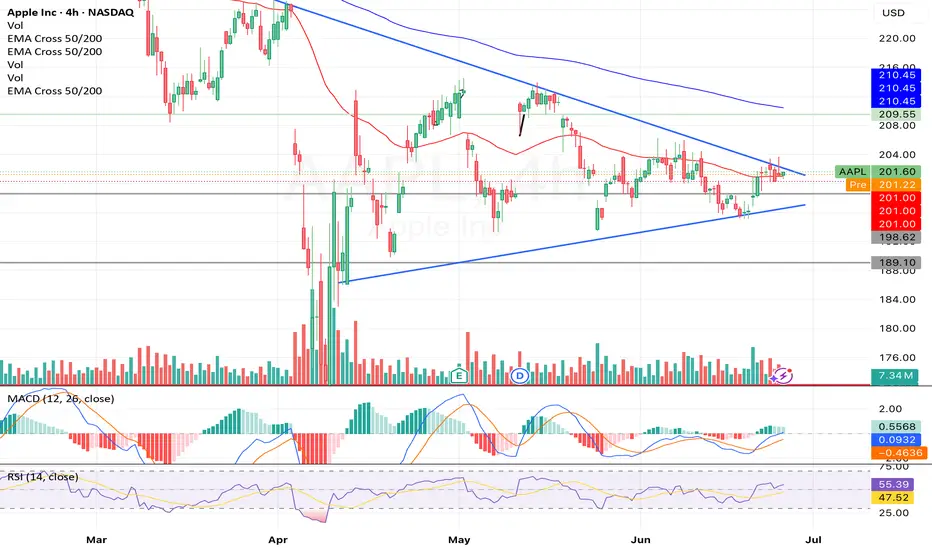
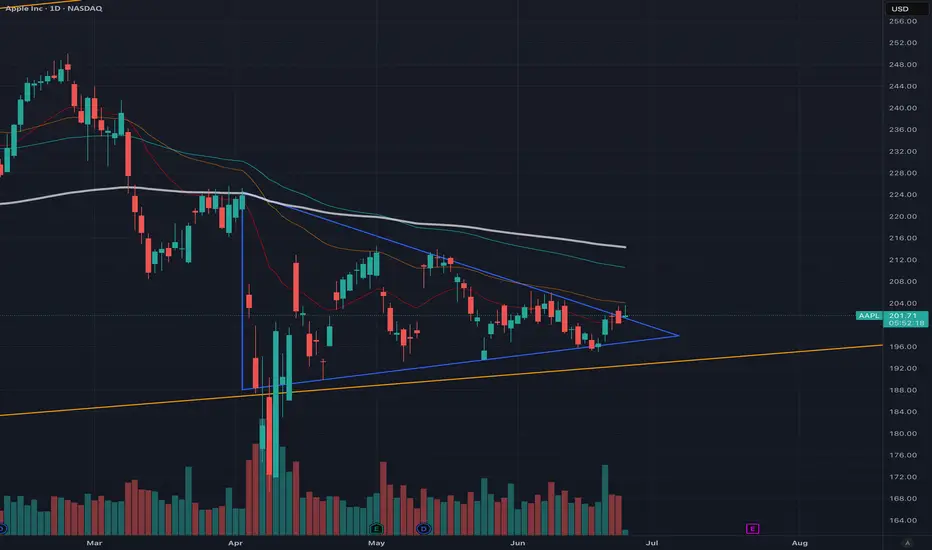
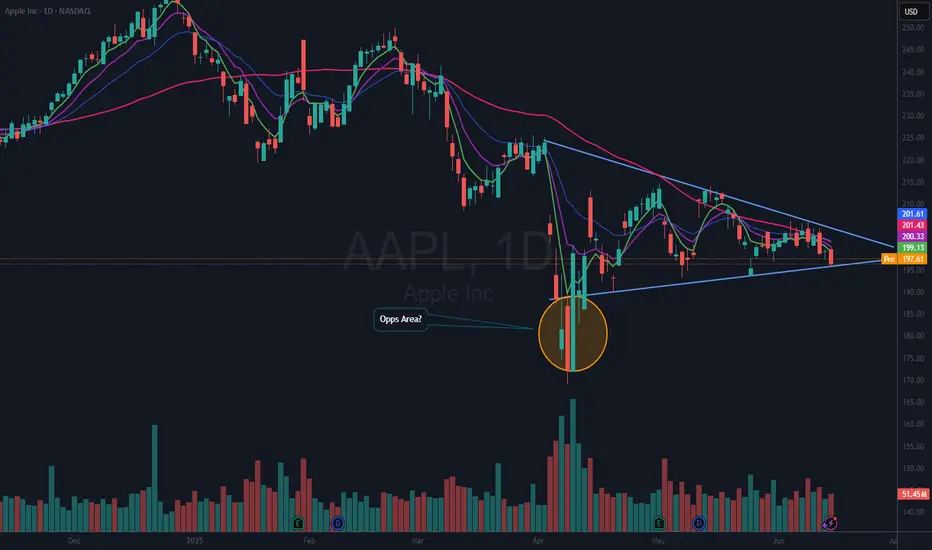
Light at the end of the Tunnel for AAPLI have been tracking this pattern that NASDAQ:AAPL started forming in April for some time now.
This is a classic symmetrical triangle formation with significant consolidation in the last trading sessions. This patterns typically lead to a breakout in either direction, and since price is near the apex, a breakout is imminent within 1–3 trading sessions.
Current Price: $201.60 (slightly above the key $201 support/resistance zone).
Key Support: $198.62 (recent higher low).
Major Support: $189.10 (multi-month low).
Resistance Zone: $202.30 (pre-market), then $210.45 (EMA 200/50 convergence).
EMA 50/200 Cross: Both EMAs are converging at ~$210.45, which has become a significant resistance ceiling.
Typically, this is bearish when price is below both 50 and 200 EMA. However, the MACD and RSI indicators both support an imminent bullish move forming with an increase in volume.
With headwinds from antitrust issues in the EU and U.S. I wont be surprised if this breaks out significantly upwards with some positive news acting as the catalyst.
The conservative trader will place a straddle aiming for $210.45 (EMA resistance) upside and but $192–194 (prior demand zone) downside.
The riskier and probably more rewarding bet would be to place a call aiming for the $218-$224 resistance zone after this breaks $202.30
AAPLCL trade ideas
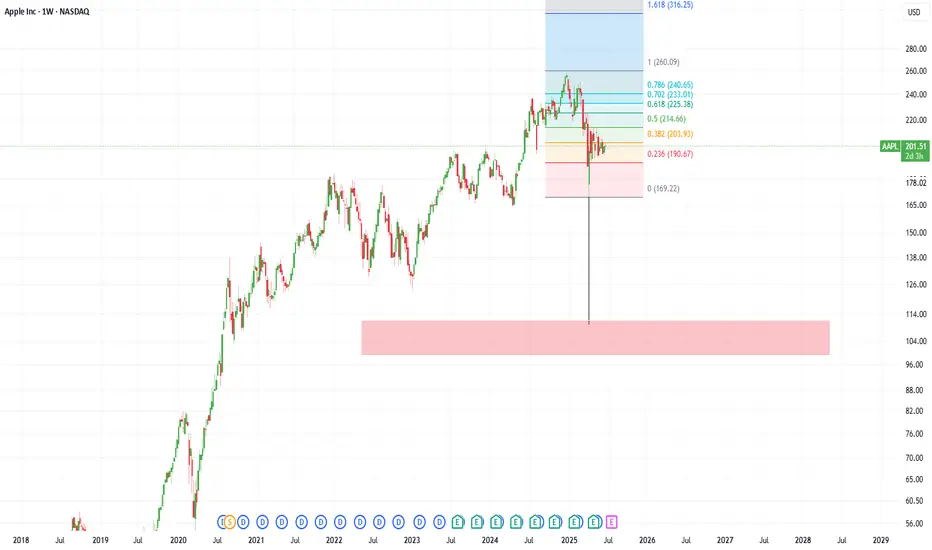
AAPL death cat bounceAAPL is looking like a technical death cat bounce (0.5 fib retracement).
Targets around $100 probably lower...
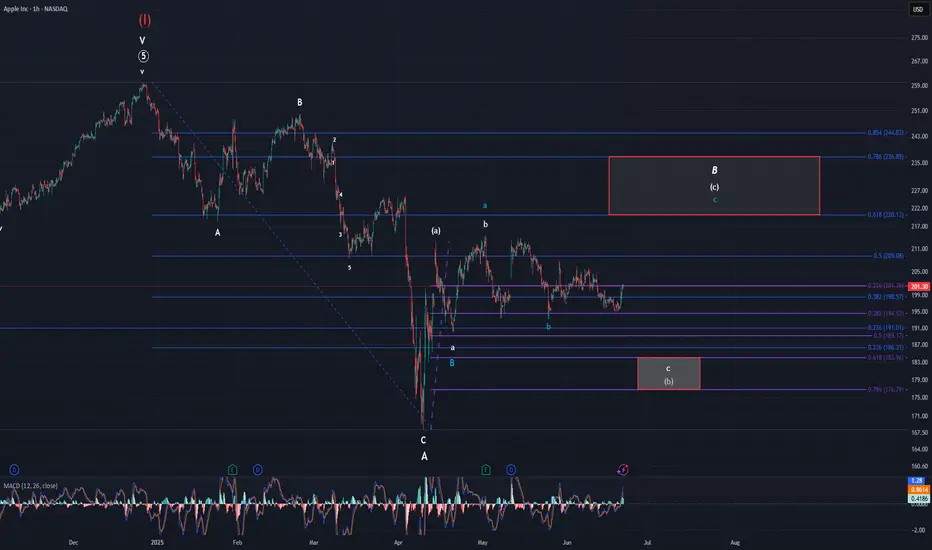
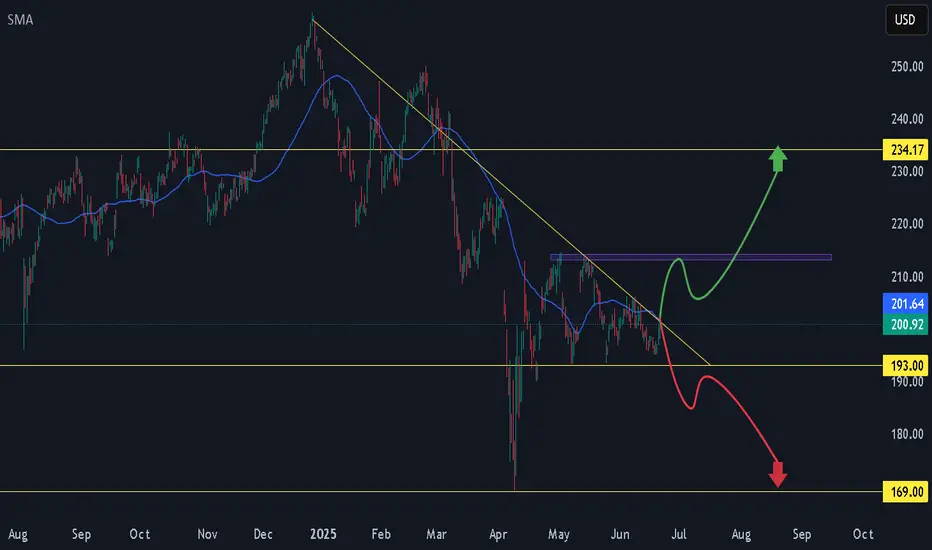
AppleNo change in regard to my Apple analysis. I am still waiting for price to either break down to the target box or head straight to the upper target box from here. I think given the current price action we have a higher probability of moving lower first, but the fact remains it is not required. This week will hopefully bring some needed clarity. Regardless of what happens, I believe we're within minor B. It is only a matter of what pathway price takes to get to its end destination.
Time to buy? Too much negative press. Buy in Fear- Updated 25/6Apple has recently faced significant negative press, leading to fear and critical perceptions among investors. This situation highlights a common investment principle: buy in times of fear and sell in times of greed. As a result, I have taken a considerable long position on Apple, which I have since increased since my orginal post.
The flag pattern on the stock chart is nearly complete, indicating that a price movement is imminent. I have set my stop loss at $191, while I anticipate that a positive breakout could push the stock price above $223, representing potential gains of over 10%. There is also further upside potential for the price to exceed >$230. My target sell price for a full exit from Apple is now 275 USD, which would yield a return of 35%, although I do not expect this target to be reached until September or later. For shorter-term returns, I am targeting prices above $223.
I believe Apple is a strong long-term hold, regardless of current market fluctuations. The company has a mature and extensive ecosystem, making it a brand I would be reluctant to bet against. If you already own Apple products, you likely understand how unlikely it is that you would switch to another brand.
A close above $201.12 today would confirm a positive breakout.
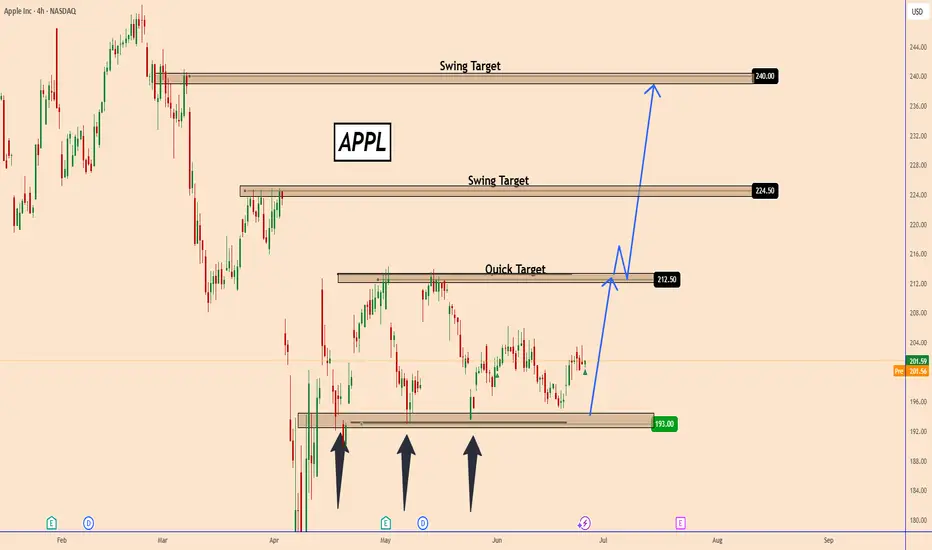
AAPL: Update - Key Levels to Watch for Price DevelopmentAAPL: Update - Key Levels to Watch for Price Development
Overall nothing changed and AAPL remains a valuable and strong structure
Apple's stock (AAPL) has been range-bound between $193 and $212.50 for the past two months, repeatedly testing support near $193 on three occasions.
Each time, the price has rebounded strongly, pushing back toward $212.50—the upper boundary of this trading range.
Given this pattern, the likelihood of another move toward $212.50 remains high.
If AAPL successfully breaches $212.50, it could signal a larger bullish breakout, with upside targets at $224.50 and $240, as highlighted in the chart.
You may find more details in the chart!
Thank you and Good Luck!
❤️PS: Please support with a like or comment if you find this analysis useful for your trading day❤️
Apple about to popTight BB squeeze — contractions like these are usually followed by heightened volatility.
APPLE BULLISH 26 JUNE 2025Apple looks ready to breakout.It is really well squeezed now and ready to form a Green candle.
Breakout is an expectation so dont trade blindly.
I will upload video analysis Asap.
I am bullish and my price target is a minimum $220 from here.
NOTE: RISK MANAGEMENT IS A MUST
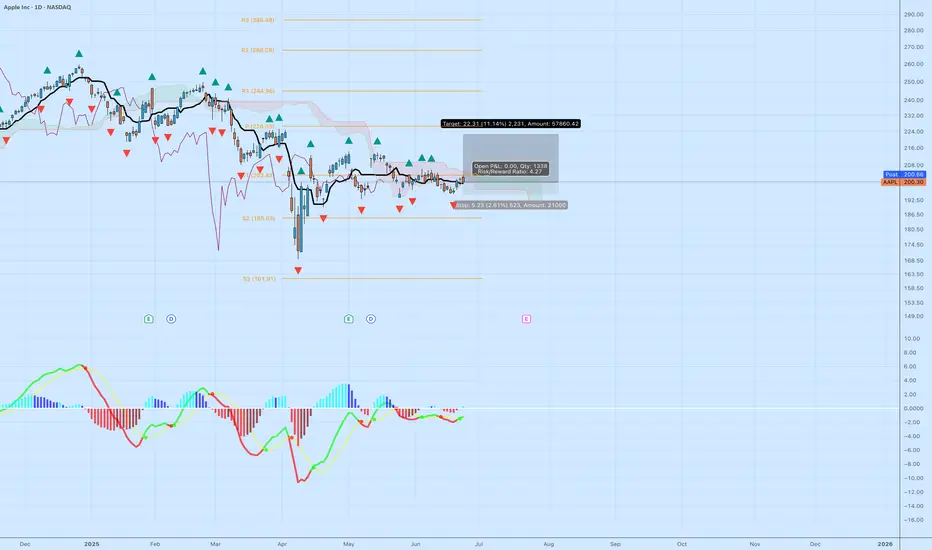
$AAPL Long Setup – Range Breakout Potential with Tight RiskApple ( NASDAQ:AAPL ) is finally showing signs of strength after a prolonged sideways range. Price is attempting to break above the Ichimoku Cloud on the daily chart while MACD is starting to curve upward—indicating a potential shift in momentum. After holding the $190–$200 zone as support for months, this move above $200 could trigger a short-term breakout toward the $220–$226 levels.
The current setup has a clean structure with a 4.27 risk/reward ratio:
Entry: $200.30
Stop: $195.07 (below recent range lows)
Target: $222.61 (prior high + pivot cluster)
If this move holds, it could mark the start of a trend reversal in Apple following months of chop. Solid setup for a 2–4 week swing trade or as part of a core position rebuild.
Let me know if you're playing this one or waiting for confirmation above $208.
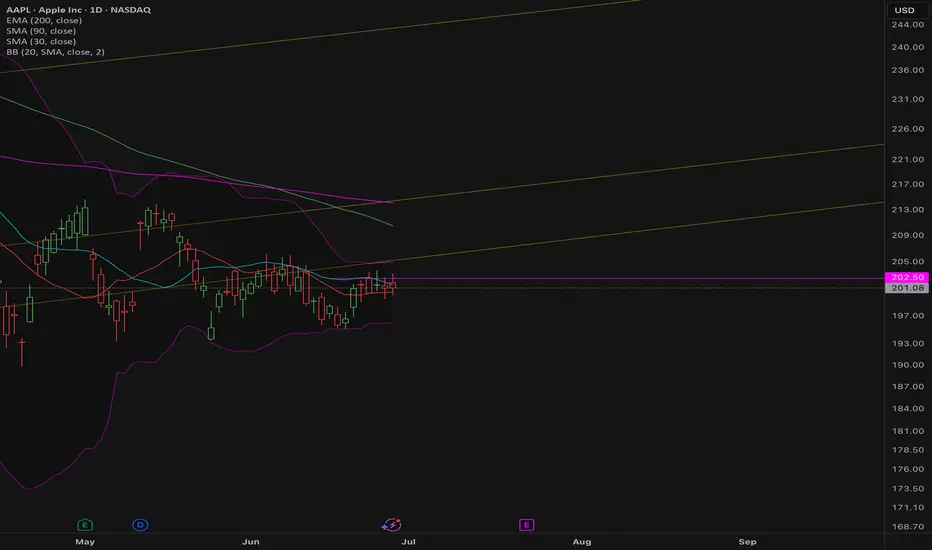
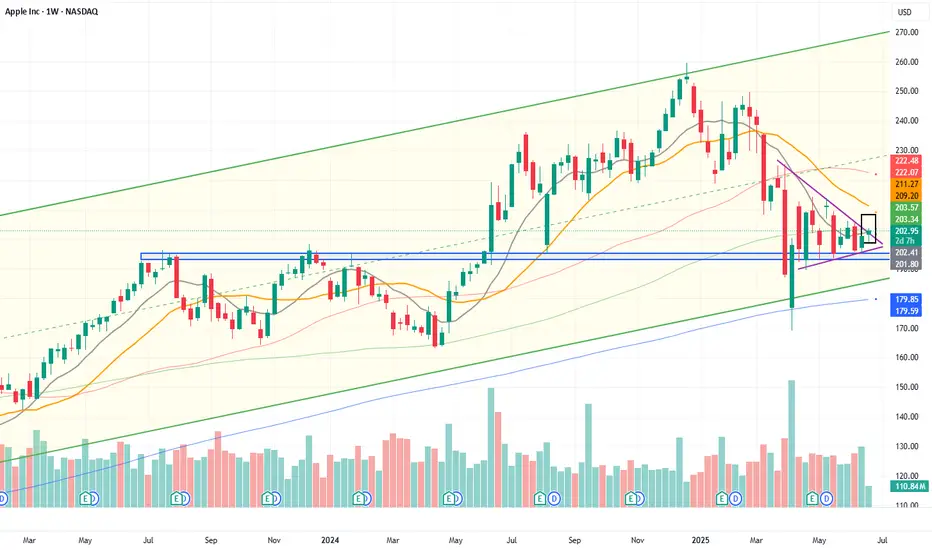
Breaking out!The price breaks through the purple resistance and is preparing to start an upward movement.
A compression triangle formation is taking shape, with the lows resting on the underlying purple trendline.
At $203.3, the weekly 100-period simple moving average (SMA100, green line) is located. A close above this level would be an important confirmation of the bullish reversal.
Time to buy? Too much negative press. Buy in Fear- Updated 23/6Apple has been dealing with significant negative press recently, leading to fear and critical perceptions among investors. This situation suggests a common investment principle: in times of fear, you should buy, and in times of greed, you should sell. Consequently, I have taken a considerable long position on Apple.
The flag pattern is almost complete, indicating that a price movement is imminent. I have set my stop loss at $196, with an anticipated profit from a positive breakout expected to exceed $223, representing potential gains of over 10%. There is also further upside potential to surpass $230.
Apple is a strong long-term hold, regardless of current market fluctuations. The company boasts a mature and extensive ecosystem, making it a brand I wouldn't bet against. If you already own Apple products, you likely understand how unlikely it is that you would switch to another brand.
Last Friday's green candle validated the flag pattern, indicating that a breakout is still needed. However, the flag pattern has now shifted to a more bearish formation, which could suggest seller exhaustion and strong support at these price levels. Achieving above 202 USD would be both a positive sign and an indication of strong buyer interest. The Iranian conflict may cause volatility, but my long position is still active, and the upcoming weeks could see a positive breakout >202. Although this flag pattern is typically bearish, I believe Apple is undervalued based on its future potential offerings and this could be a good entry price? As always not financial advice but let me know if you think Apple is going to <170 or >230.
My target sell price is now 271 USD.
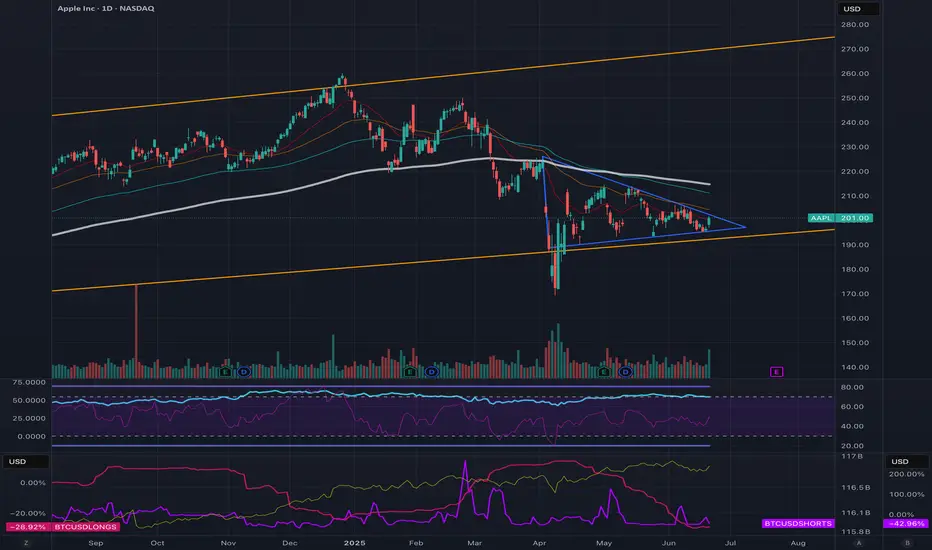
AAPL Daily – Key Breakout Zone AheadWe're currently sitting at the lower boundary of a large descending channel on AAPL in the daily timeframe.
After completing what appears to be a 5-wave Elliott bearish structure, the price made a strong bullish rebound. Since then, it has been consolidating in a mid-range zone, forming an ascending triangle, which could signal a continuation of the recent bullish move.
At the current price level, we can identify two key bullish patterns:
An ascending wedge (or "púa")
An ascending triangle
Both patterns are developing around the 0.78 Fibonacci retracement level of the last major bearish impulse — a critical zone. A breakout above this level could imply structural damage to the previous downtrend and open the door to a potential long setup.
🎯 Target zone: 232.00 – 235.00
Keep an eye on volume and breakout confirmation.

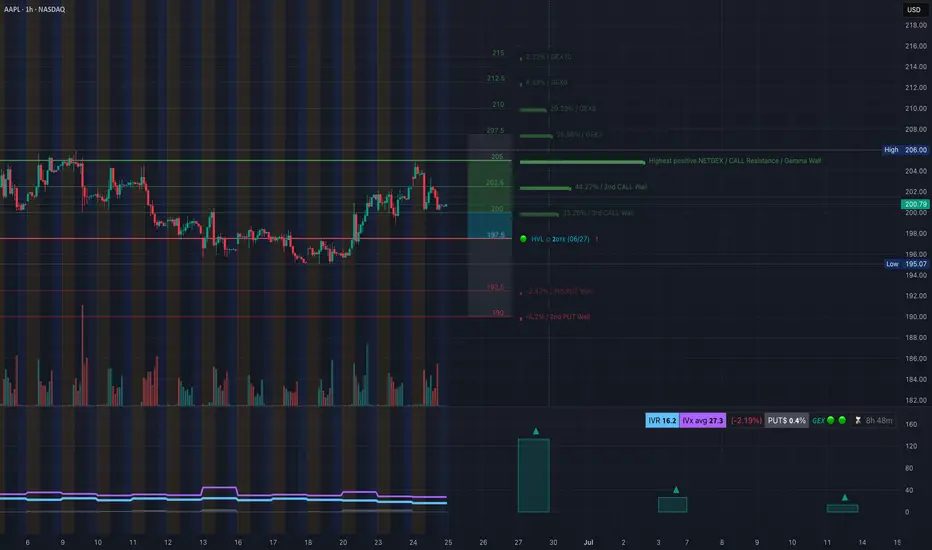
AAPL Inside a Coil – Big Move Loading from the $200 Zone 🧠 GEX-Based Options Sentiment:
Apple (AAPL) is caught between tight gamma compression and heavy resistance.
The $205–$207 zone is packed with GEX9 and multiple Call Walls. This is the key ceiling that has rejected price repeatedly over the past week. On the other side, the Highest Positive Net GEX / Gamma Wall is just below at $202, acting as the current pivot level.
Support sits around $197.50, marked by the HVL zone and the lower end of GEX structure. Below that, $195 is protected by the 2nd PUT Wall — a critical gamma defense zone.
Implied Volatility Rank is 20.7, so options are still relatively cheap. Notably, we’re seeing a 5% PUT flow dominance, a subtle bearish tilt — not extreme, but worth watching.
🔧 Options Setup for Monday–Wednesday:
Bullish Scenario:
If AAPL clears $203.21 and holds, this opens up the play toward $204.98 (Gamma Ceiling), and potentially $207 if momentum builds.
You can consider a CALL debit spread, like 202.5c/205c or 205c/207c for July 3/5 expiry.
Stop out if price drops below $200.
Bearish Scenario:
If AAPL fails to hold $199.50 and breaks through $197.50 HVL, we may see a sharper unwind toward $195 or even $190 PUT wall zone.
Consider 200p or 197.5p for July 3 expiry.
Cut if price reclaims $202 with strength.
📉 1-Hour Chart Breakdown:
Price has been coiling in a symmetrical triangle just below the $203–$205 resistance supply zone. There’s a visible CHoCH just under structure, with multiple tap rejections from the overhead resistance.
The recent CHoCH printed after a bounce from minor demand, suggesting that sellers are still defending the top channel. Volume has been flat, but tightening price range signals an imminent breakout or breakdown.
As long as price remains pinned inside this triangle under the BOS and supply zone, this is a range-bound chop — not a trending setup yet.
📌 Key Levels to Watch:
$204.98 – Gamma ceiling and top of supply
$203.21 – Structure pivot, minor resistance
$201.17 – Local midpoint and breakout base
$199.50 – Demand edge, current support
$197.50 – HVL and gamma support zone
$195.00 – 2nd PUT Wall
$190.00 – Final gamma support if breakdown accelerates
✅ Thoughts and Monday Game Plan:
AAPL is one of the cleanest coil setups among the tech names heading into Monday. This type of structure doesn’t last long — expect expansion.
Wait for direction at open:
If we break $203.21 with volume, we ride toward $205–207 for a short-term gamma pop.
If price fails to break and loses $199.50, the fade to $197.50 or lower is likely.
This is not a time to anticipate — react to the move. Let the coil resolve and follow the breakout or breakdown.
Disclaimer:
This analysis is for educational purposes only. Always do your own due diligence, trade with a plan, and manage your risk carefully.

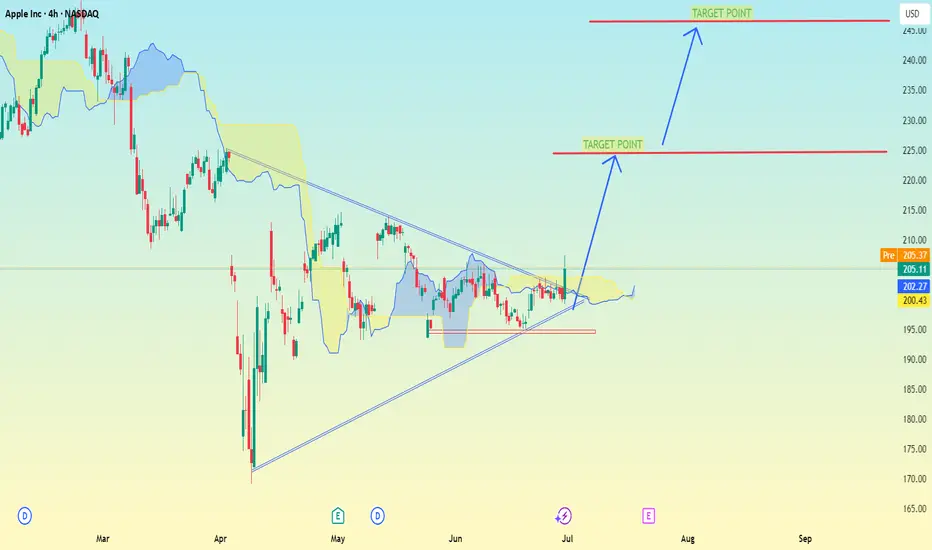
AAPL triangle breakout pattern (bullish bias in this case).📈 Chart Pattern Observed:
This is a symmetrical triangle breakout pattern (bullish bias in this case).
Price has broken out or is near breakout above the descending trendline.
Ichimoku cloud thinning and flattening indicates potential bullish momentum building up.
---
🎯 Target Levels Based on Chart:
1. First Target Point:
Price Level: Around $225.00 USD
This is the initial breakout target, often calculated by measuring the widest part of the triangle and projecting upward from the breakout point.
2. Second (Final) Target Point:
Price Level: Around $250.00 USD
This is a more extended target if bullish momentum continues strongly and volume confirms the move.
---
🔍 Additional Notes:
Current Price Zone: Around $202–$206 USD
Stop-Loss Idea: Below the recent swing low or lower trendline, around $195–$197 USD
Entry Idea: On confirmed breakout and retest, above $206.50–$208.00 USD
Would you like help with a trade plan including entry/SL/TP levels based on risk-reward?
AAPL Bulls May Regain Momentum – Price Action Suggest a Bounce 🔍 GEX-Based Options Insight:
* GEX Cluster sits heavy at 204–206, marking a Gamma Wall / Resistance Zone.
* Highest NET GEX levels suggest 205–206 is a magnet if price builds strength.
* IVR: 16.2, IVX is low, indicating cheap premium for call buyers.
* Calls: 0.6% bias, showing a neutral-to-light bullish flow.
🟩 GEX Support: 197.5
🟥 PUT Walls: Below 192.5 and 190 (farther from current level)
🧠 Technical View (1H Chart):
* AAPL is pulling back into a demand zone while still respecting the upward channel.
* Just formed a CHoCH, signaling a potential reversal back up.
* Price is sitting on channel support + demand, with a recent BOS confirming bullish structure intact.
* Volume during this pullback is lower than the prior bullish leg—healthy retrace.
🔁 Trading Idea (for calls):
Entry:
🟢 Around 198.5–199 (channel and OB support zone)
Target 1:
📈 201.50 – retest of supply / GEX resistance
Target 2:
📈 204.88–206 – Gamma Wall target
Stop Loss:
🔴 Below 196.50, breaks OB and structure
🎯 Ideal Option Play:
* July 5th or July 12th 202 Calls
* Low IV makes this a decent R/R for directional play
* Momentum confirmation on reclaim of 200.80 gives confidence
💬 If AAPL can defend the current structure and flip 200.80 intraday, we may see a gamma chase back to 204+.
This analysis is for educational purposes only and not financial advice. Always trade with a plan and proper risk management.
Goes up to $220It is true that the trend is currently up and it is going to $210 and $220, but I expect it to react in these ranges and come down to $170.
But if you want to buy, it is better to wait for it to correct and come down to $170-180, then think about buying. It is too early to buy right now.

AAPL Significant Event NASDAQ:AAPL
1. Bullish Breakout :
In the daily chart bullish breakout has been seen. If the bullish momentum is strong, the price may follow the upward.
2. Target Price : Potential target price 214
3. Risk Factors:
A. Failure to breakout the resistance 206
B. Sideways trend may be started.
C. Broader market weakness or correction
D. False Breakouts
---------------------
Note :
If you’re interested in receiving detailed technical analysis reports on your selected stocks, feel free to reach out to me. I can provide you with customized reports covering trends, key levels, momentum, patterns, and price projections to support your trading or investment decisions.

Apple Consolidates Above $200 with Upside PotentialAAPL is trading sideways, consolidating above $200.0.
Resistance stands at $203.0, and if breached, Apple could rally toward $206.0.

AAPLApple shares trade in a consolidation zone after solid Q2 results—revenue at $95.4B (+5%), record services growth, and strong margins despite tariff headwinds.
Technically , indicators lean bullish, but resistance near $202–204 poses a short-term barrier. Market reaction to WWDC AI updates and further supply‑chain diversification will be key. On dips toward $196, there’s room for selective buying; if $204–214 breaks decisively, upside toward $235 could unfold . However, the lack of clear AI revenue guidance warrants caution, aligning with Needham’s cautious stance.
$AAPL In ConsolidationNASDAQ:AAPL is consolidating here in a wedging pattern. I do not know which way this will resolve. But, since I rarely if ever short, I am looking on the long side of a trade. The thing I like about a consolidation pattern like this is, you know when you are wrong very quickly. My plan is to take a ¼ size long position if / when it moves above the 50 DMA (red) with a stop just below the most recent low (which would also correspond to dropping below the lower wedging trendline.
Then if it can break out over the upper downtrend line, I will look to build out my position. I thought this would be a good one to put on your watchlist. If you like the idea, please make it your own so that it fits within your trading plan.
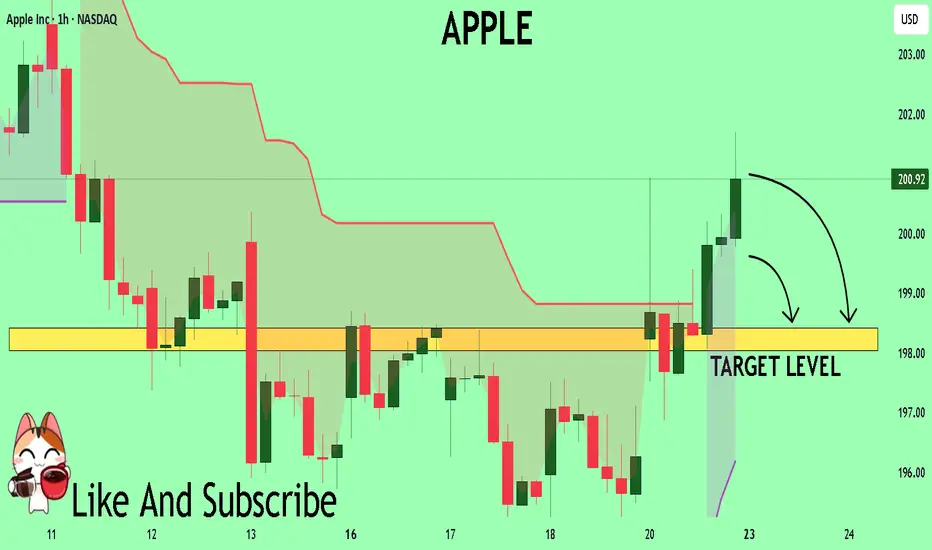
APPLE The Target Is DOWN! SELL!
My dear friends,
APPLE looks like it will make a good move, and here are the details:
The market is trading on 200.92 pivot level.
Bias - Bearish
Technical Indicators: Supper Trend generates a clear short signal while Pivot Point HL is currently determining the overall Bearish trend of the market.
Goal - 198.42
About Used Indicators:
Pivot points are a great way to identify areas of support and resistance, but they work best when combined with other kinds of technical analysis
Disclosure: I am part of Trade Nation's Influencer program and receive a monthly fee for using their TradingView charts in my analysis.
———————————
WISH YOU ALL LUCK
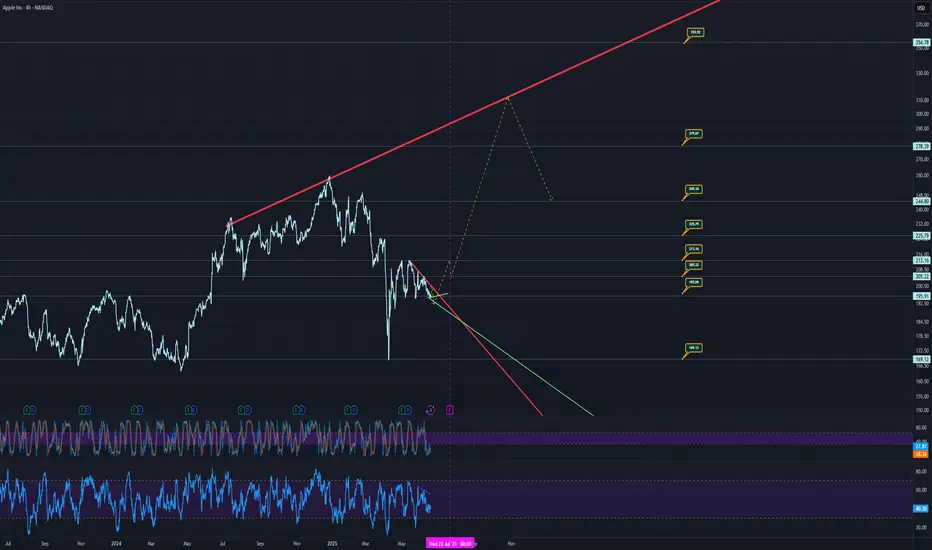
APPLE A FRESH APPLE TO BITEThe chart for Apple (NASDAQ: AAPL) shows the following key elements:
Rejection Trends: Marked in red, indicating levels where the price has faced resistance and reversed.
Support Levels: Marked in green, with horizontal support indicated by dotted lines, showing price levels where the stock has historically found buying interest.
Price Targets: Marked with specific values, suggesting potential future price levels based on the analysis.
Guideline: Represented by a dashed line, likely indicating a trend or channel guideline.
RSI and Trends: Displayed at the bottom, with the Relative Strength Index (RSI) and additional trend indicators in colorful lines.
Earnings: Marked with purple dashed lines, highlighting significant earnings dates or periods.
The chart covers a timeframe from mid-2023 to June 20, 2025, with the latest data point at 12:07 AM EDT on June 20, 2025.
Watch out, because there is a price target to 169. Meaning, we need to be careful.
There is also a price target to 280+ which has support of indicators.
Heading into earnings we might see the 215 mark which could see a slight drop to around 205, and then could see a climb over months to 280. Even 300+
Watch the trends, and price targets, if at trend, look to sell or buy depending on if support or resistance.
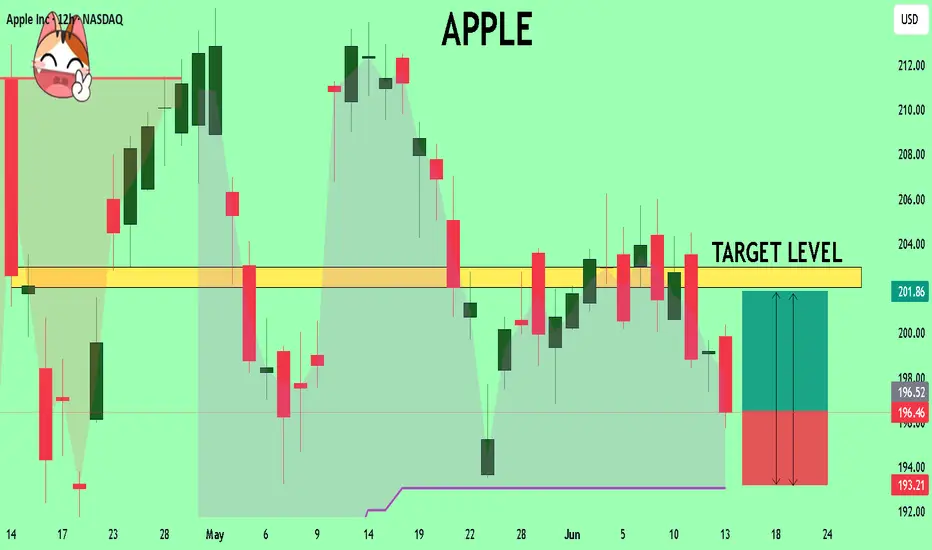
APPLE Trading Opportunity! BUY!
My dear followers,
This is my opinion on the APPLE next move:
The asset is approaching an important pivot point 196.46
Bias - Bullish
Safe Stop Loss - 193.21
Technical Indicators: Supper Trend generates a clear long signal while Pivot Point HL is currently determining the overall Bullish trend of the market.
Goal - 202.06
About Used Indicators:
For more efficient signals, super-trend is used in combination with other indicators like Pivot Points.
Disclosure: I am part of Trade Nation's Influencer program and receive a monthly fee for using their TradingView charts in my analysis.
———————————
WISH YOU ALL LUCK
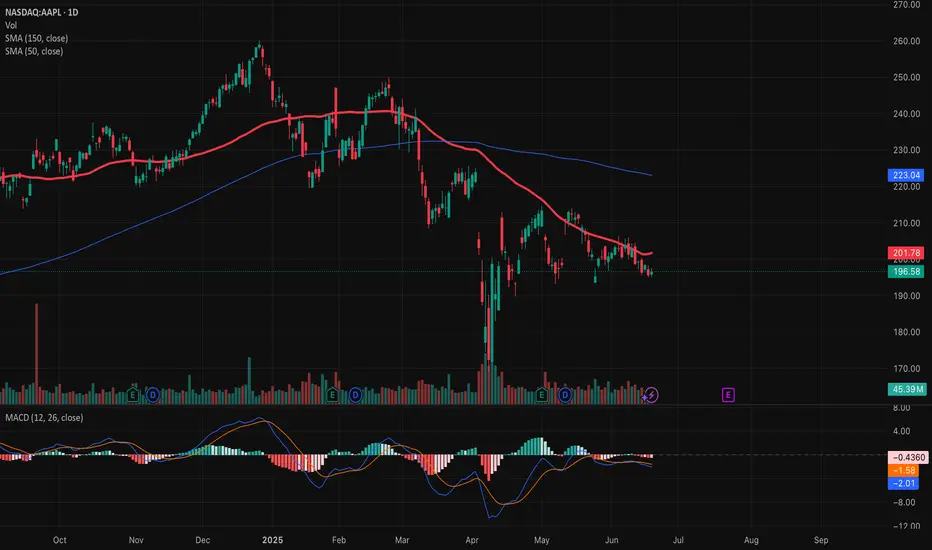
MA chart styleThis is a chart style I need to save. Buy above positive gradient 50 MA and above or close to 150. Confirm with volume and size based on local resistance levels.