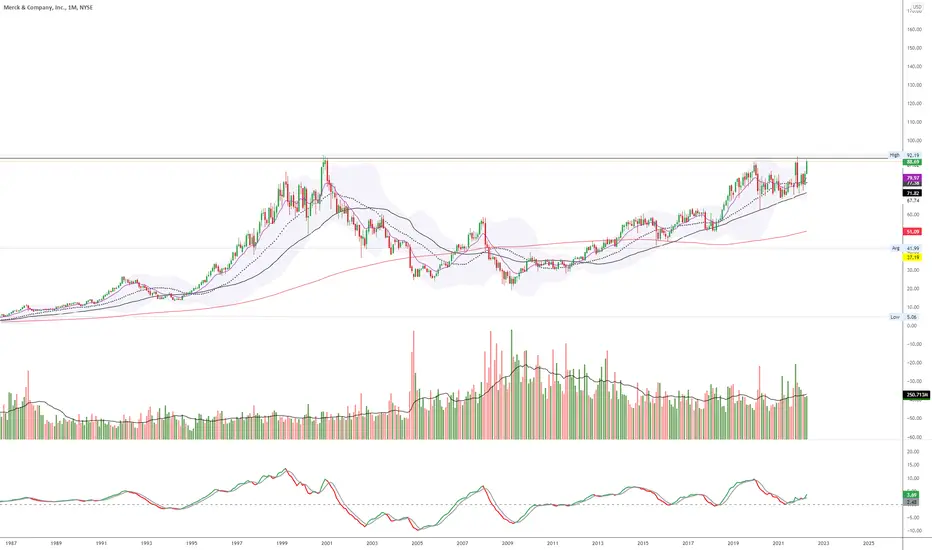
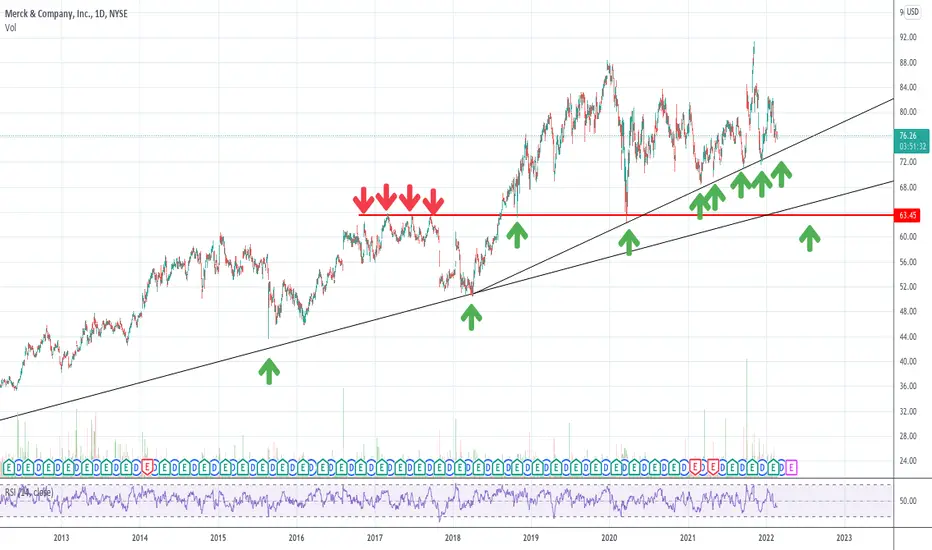
ATH $96.69/When Will MRK Top Out?All time high is 96.69 from 2020.
Overbought on weekly but not on the daily or monthly timeframes.
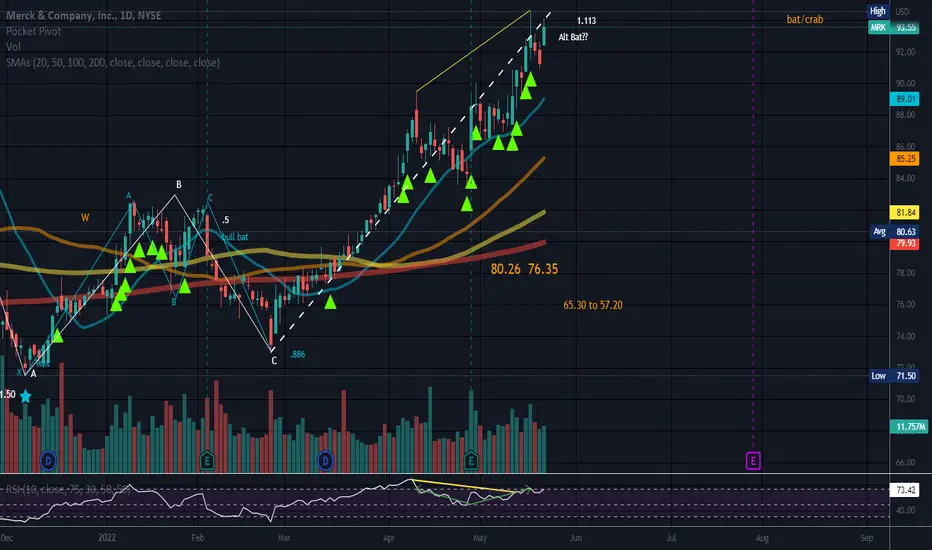
There appears to be a bullish Bat at the Bottom before the move up in blue. Price took off at the .886 and has gone a long way since then. A Bat has it's reversal zone at the .886 and the A-B leg (retracement of the impulse wave) retraces 38.2% to 50% of the distance covered by the X-A leg.
The W that I see (white) encompasses the bullish bat pattern at the bottom, which is unusual but does happen. It could be a bearish Alternative Bat which can terminate near the 1.113 fib level. MRK has just hit this level, so now I am waiting to see indications of price topping out close to here. If price goes too much higher, then the pattern is invalidated. If price goes much higher, my next step would be to look for the 1.618 which is marked and would be an extended harmonic pattern known as a Crab.
Harmonic patterns have 4 legs. The first leg is the impulse wave and bullish harmonic patterns have this wave to the upside whereas bearish patterns have this leg to the downside. They are called bearish patterns as price reverses at the reversal zone on the last leg of the W, but if you know your patterns, this can be a great long, just get out at the end of that last leg, quick! I did well on this one but am setting a tight stop loss for now until I see what unfolds.
The Bullish Crab, Bat, Alternative Bat, Butterfly and the Gartley all have peak 2 lower than peak 1. The Cypher and the Shark have peak 2 higher than peak 1. In the bearish versions, Ws, you can reverse this and valley 2 is higher than valley 1. The 5-0 pattern is an exception to the W M appearance and the bearish version appears as a crooked M.
Possible Bearish diversion between price and RSI.
On monthly there could be a cup like formation, but on daily, it is not well rounded at the bottom. Price would need to break the ATH from 22 years ago to break out of a cup pattern (if this is one). Time will tell which pattern this is (o:
No recommendation.
MRKCL trade ideas
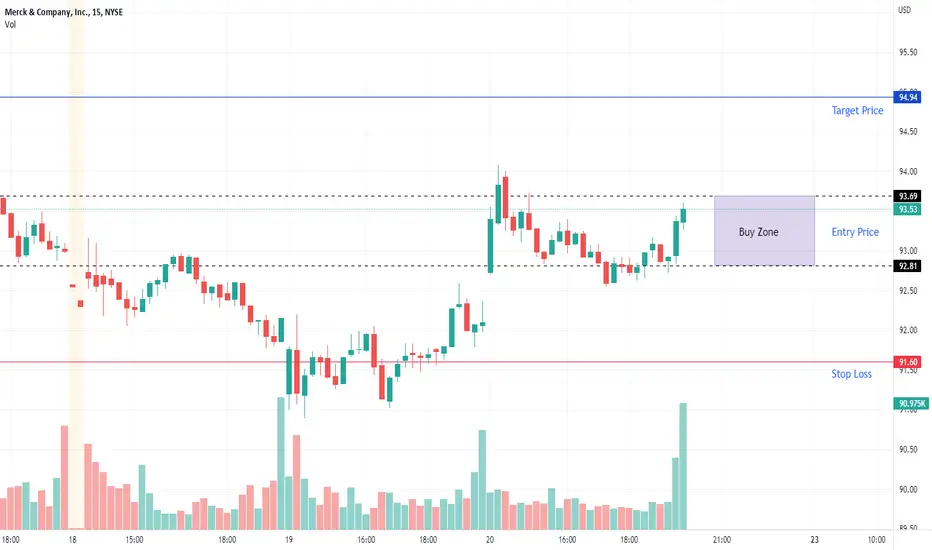
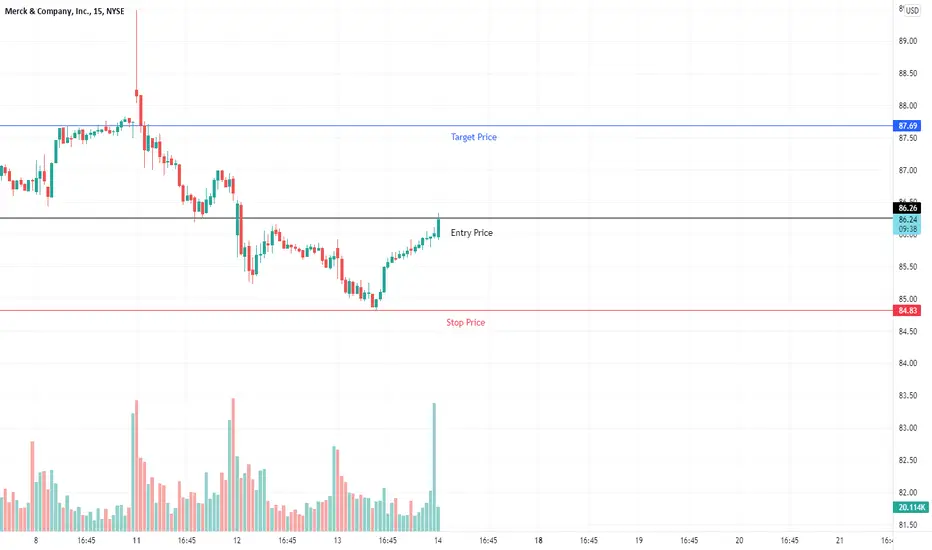
23/5/2022 NYSE (MRK)Buy (Entry Price) within the buy zone area and exit (Stop Loss) below the red line. Can take profit at the suggested Target Price.
Entry Price: $92.81 / $93.69
Target Price: $94.02 / $94.94
Stop Loss: $91.60
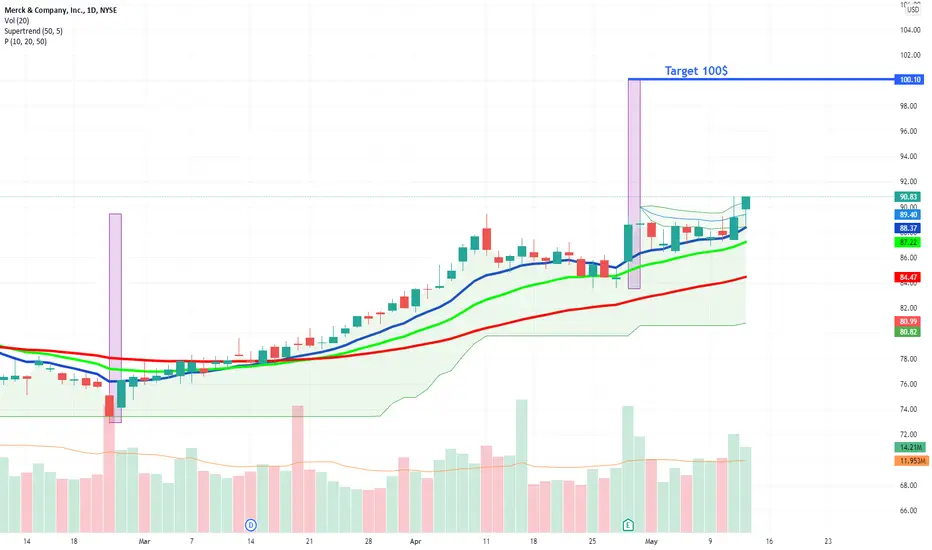
MRK VCP action. don't like the higher vol last few days though.. took pos.. sold some and now risk free, if it comes back and hits my stop im out break even. nothing gainned but free shot..
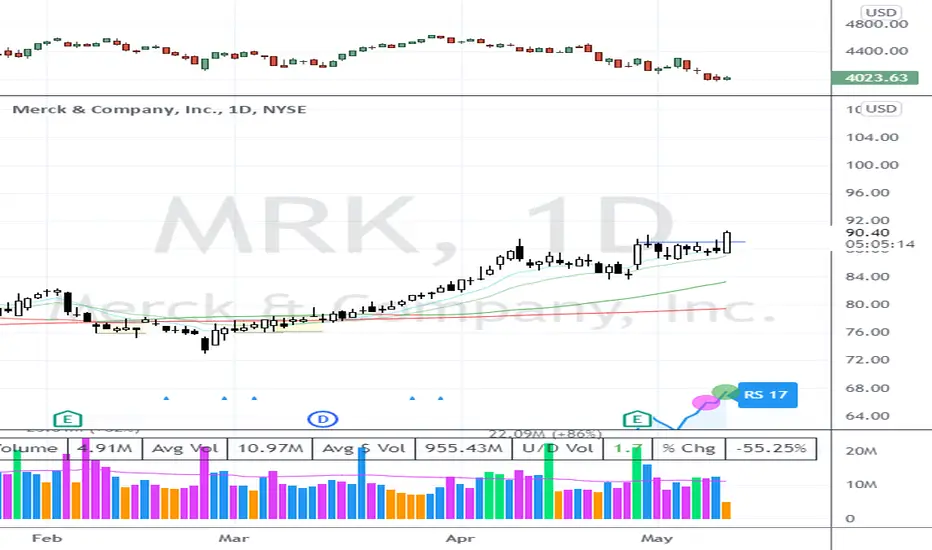
MRK - Showing Strong Relative Strength1) Formed a 19-year Cup and 2-year Handle - A bullish Continuation Pattern
2) Price shows massive tightening on the daily with relatively muted selling volume and larger buying volume spikes
3) Spectacular earnings acceleration and strong relative strength compared to the overall broad market
4) The index itself (SPY, QQQ, DIA, etc...) is short term oversold and is probably due for a bounce soon. This should give the stock momentum to go higher.
5) Am long MRK at the breakout pivot @ $89 and SL @ $87.85. Given weak market conditions lately, will get out at a multiple or two of my stop.
6) NOT FINANCIAL ADVICE, happy trading!

MRK Put and CallBought a put and call of equal price in anticipation of a big move. High volume and open intent for $90 calls.

$MRK Large Base and Tightening Up$MRK has a large base that goes back to Dec 2019 (zoom out) that has been showing impressive relative strength recently and could be finally ready to move and act as a leader if this market can catch a bid.
Focus watch list stock.

$MRK with a Bullish outlook following its earnings #Stocks The PEAD projected a Bullish outlook for $MRK after a Positive Under reaction following its earnings release placing the stock in drift A with an expected accuracy of 71.43%.

MRK - Multi decade long breakout?
Monthly chart is showing nice accumulation at the ATH.
Everything seems to favor a breakout that should last a while.
Keep an open mind...these are golden set ups and offer plenty of time to enter.
Ideal entry is breakout and back-test.
$MRKLooking waaaay back there is a giant cup forming... and now nearing ATH's... and forming a bull flag. Watching a couple points - want to stay inside this upward channel on the drop and want it to break through at the 2000 ATH. Super interesting chart.
NYSE:MRK

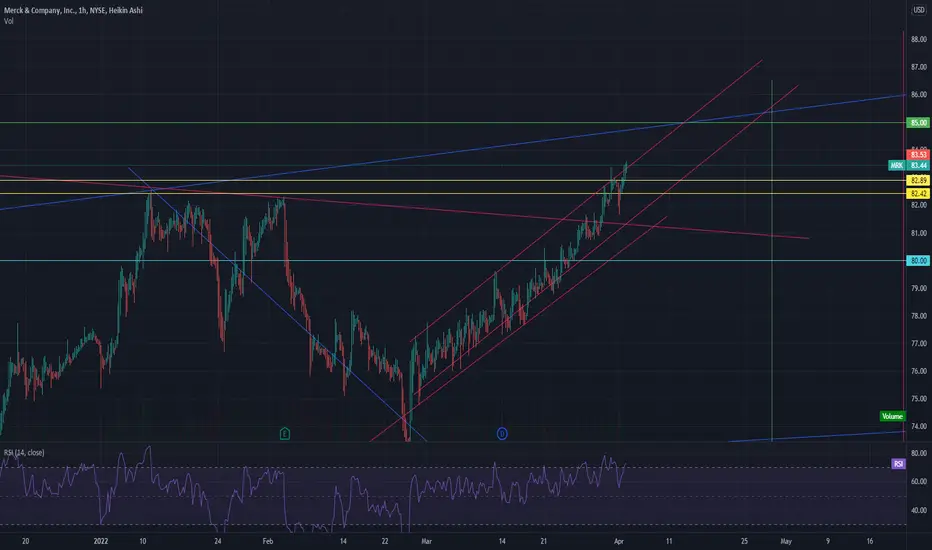
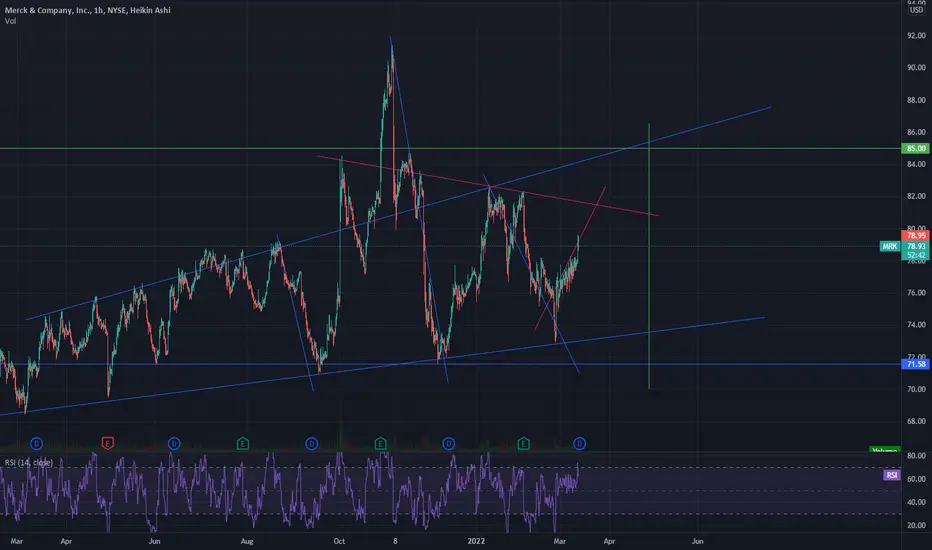
MRK still traveling along the path, but for how long?NYSE:MRK seems to be tracking right along this path. It will be interesting to see how high it goes if they have solid earnings. And even more interesting if the stock goes down as it approaches the dividend like it has the last 3 times...
MERCK still traveling in the right direction!MRK still following the pattern, but when will it top??
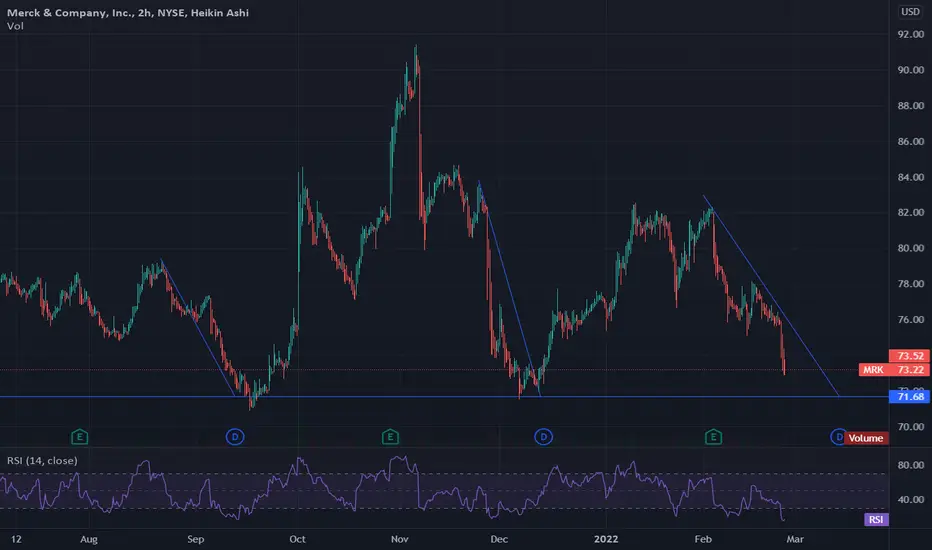
Lower!Price should be pushing down towards the 72-74 area! If you like some income, the company pays a good dividend! If the price beaks the first down trend line, then it should most probably keep going down the next important level of support ! This is a defensive play ! Just my opinion :)
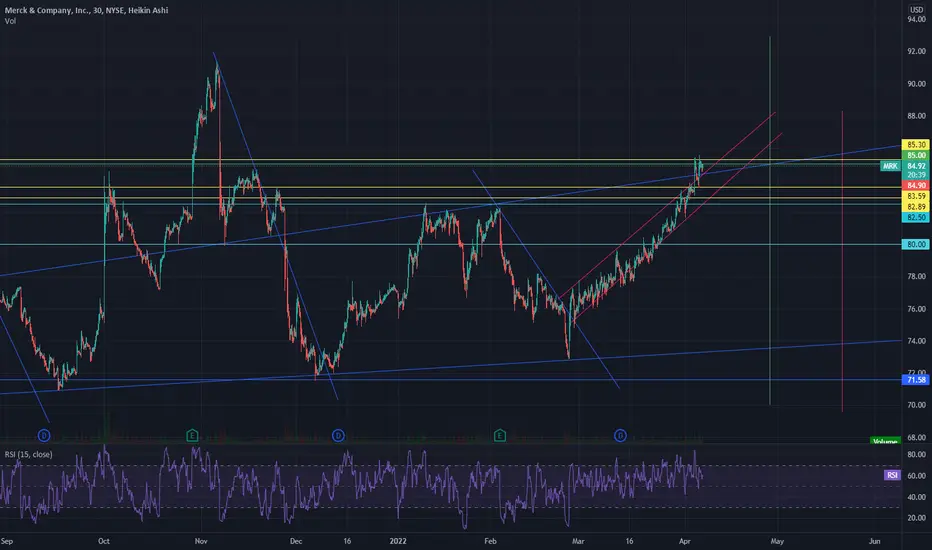
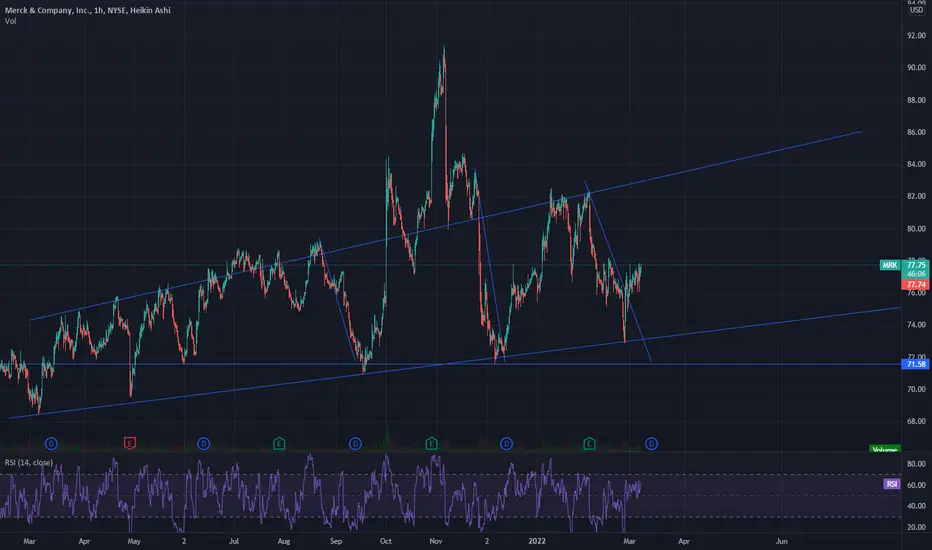
So far so good....MRK keeps tracking up this line...I am thinking if it keeps going, it should peak around 82ish, then plateau before dropping? We shall see....
24th of March peak?Possible 24th of March peak, then maybe a plateau until next earnings on April 28th?
$MRK with a Bullish outlook following its earnings #Stocks The PEAD projected a Bullish outlook for $MRK after a Negative Under reaction following its earnings release placing the stock in drift D with an expected accuracy of 71.43%.

MRK - weekly breakoutHealthcare has been holding up pretty nice recently lots of names have been strong so this thing looks like it could go to 82 or so

$MRK Ascending TrianglePossible ascending triangle on the monthly. Triangle ends by the end of 2024 so may be a good long term play.

MRK: swing trade!Above 74.80 supports a bullish trend direction. Breaking below this level will negate the bullish stance.
Upside price momentum supports the bullish trend direction.
RSI leaves enough room for further upside price potential.
Trend strength indicates a weak indication that a trend might be developing.
MACD bullish crossover (lower panel) supports a change in trend direction.
A break above its 200-day will act as further support to the trade idea.

MRK on track to be down at the DividendSo far, MRK is going exactly like the previous Dividend payouts. Dropping down to these levels. My guess is it will rebound after, so it should be a great time to get in.
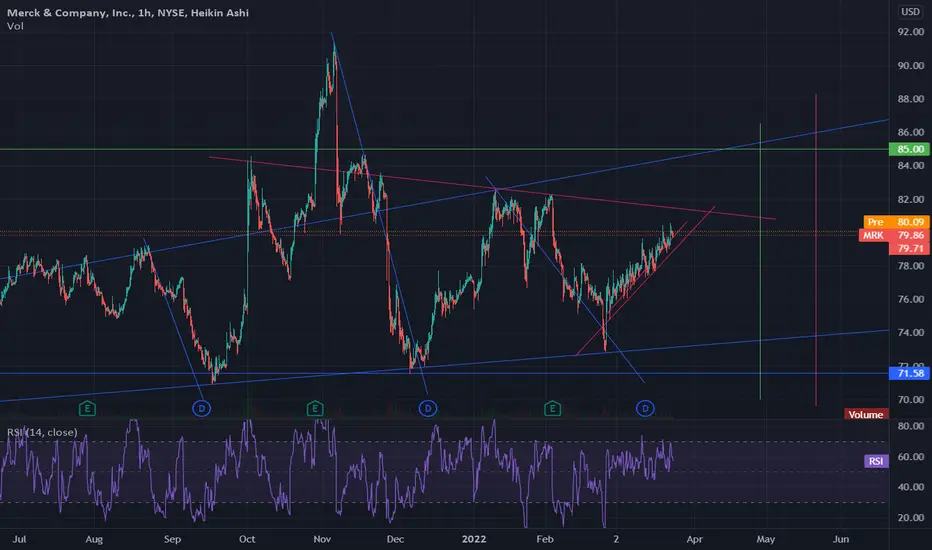
Merck gaining momentum. MRKImmediate targets 85, 86. Invalidation at 76.
We are not in the business of getting every prediction right, no one ever does and that is not the aim of the game. The Fibonacci targets are highlighted in purple with invalidation in red. Fibonacci goals, it is prudent to suggest, are nothing more than mere fractally evident and therefore statistically likely levels that the market will go to. Having said that, the market will always do what it wants and always has a mind of its own. Therefore, none of this is financial advice, so do your own research and rely only on your own analysis. Trading is a true one man sport. Good luck out there and stay safe
