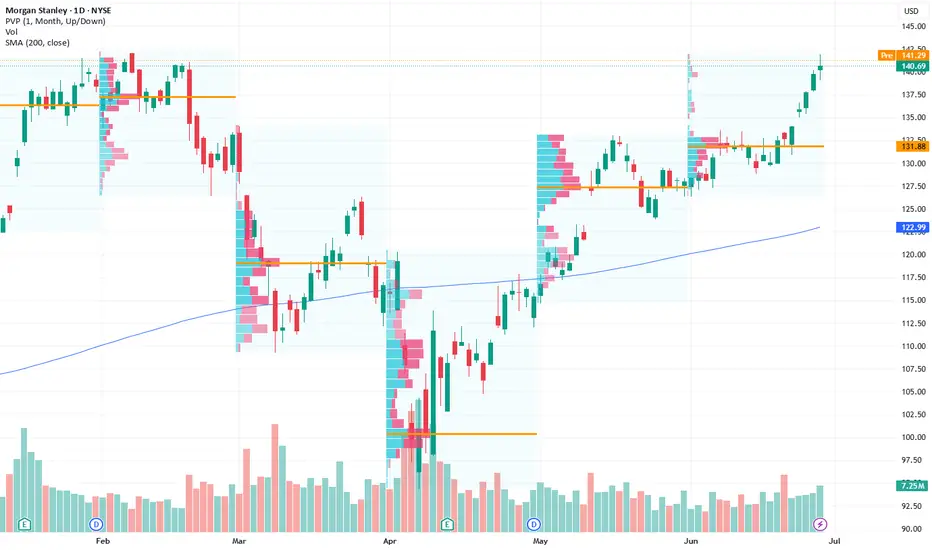
AI Innovations and Global Strategy Current Price: $140.69
Direction: LONG
Targets:
- T1 = $145
- T2 = $150
Stop Levels:
- S1 = $136
- S2 = $135
**Wisdom of Professional Traders:**
This analysis synthesizes insights from thousands of professional traders and market experts, leveraging collective intelligence to identify high-probability trade setups. The wisdom of crowds principle suggests that aggregated market perspectives from experienced professionals often outperform individual forecasts, reducing cognitive biases and highlighting consensus opportunities in Morgan Stanley.
**Key Insights:**
Morgan Stanley is currently positioned to benefit from key macro trends, including AI-driven innovations and emerging market opportunities. Its partnerships with technology companies like Nvidia highlight a clear shift toward AI integration within financial services, which could enhance operational efficiency and attract investor confidence. Moreover, Morgan Stanley has been actively expanding its footprint in high-growth regions such as Asia and Africa—strategies that align with long-term diversification goals. Despite inflationary pressures impacting consumer spending, the firm’s proactive approach to managing risk is noteworthy.
Economic data such as jobless claims and GDP growth signals will remain pivotal in the coming weeks, as they could influence short-term sentiment. Additionally, regulatory developments in U.S.-China trade relations bear watching, given their potential to offer clarity in international market dynamics.
**Recent Performance:**
Morgan Stanley has exhibited resilience amid market volatility, trading within a clearly defined range centered around $138 to $142. Institutional investors have shown caution due to persistent inflation risks and fragile GDP growth rates, which could weigh on near-term valuations. Nevertheless, the stock has maintained strong support levels and demonstrated potential for upward momentum, particularly as broader market indices signal recovery.
**Expert Analysis:**
Market analysts remain optimistic about Morgan Stanley's long-term trajectory, particularly given its focus on AI-related equity markets and strategic global investments. The firm’s partnerships with key tech leaders, combined with investments in emerging growth markets, bolster its position as a forward-looking financial institution. Additionally, the banking giant’s ability to adapt to regulatory shifts has provided stability in an otherwise uncertain macro environment. Observers note that Morgan Stanley’s capacity to deliver shareholder value will depend on its efforts to balance innovation with risk management in the coming quarters.
**News Impact:**
Recent news regarding China's export limits on rare minerals and advancements in AI could indirectly boost sectors connected to Morgan Stanley’s investments. Monthly economic indicators, such as jobless claims and non-farm payroll statistics, are expected to generate significant attention this week. Both traders and institutional investors will look toward these releases when assessing near-term momentum for the stock.
**Trading Recommendation:**
Morgan Stanley presents a compelling long-term investment opportunity, particularly for investors seeking exposure to a blend of traditional financial services and emerging technological innovations. With a steady push toward AI integration and growth-focused strategies, the stock is well-positioned for upward movement. For traders, a bullish stance makes sense given Morgan Stanley’s ability to navigate economic uncertainty while leveraging global opportunities.
MS trade ideas
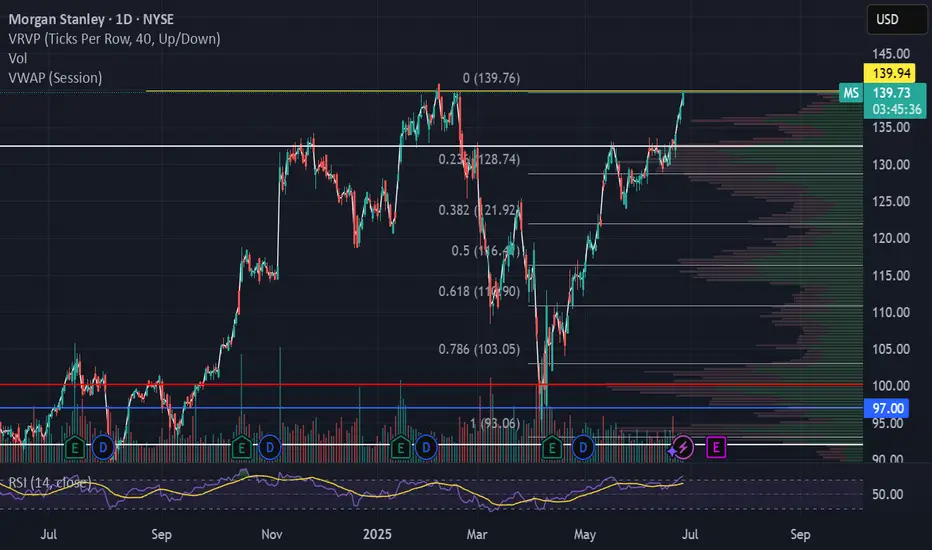
MS Triple top "SELL" Short opportunityMS has been in a strong uptrend since April 7th 2025. Daily RSI is at 75 and is a great short opportunity near $139. MS has seen a 49% increase in 2.5 months from $94 to $140.
Target 1 on short would be a retest of previous high of $134 / stop would be anything over $141.50
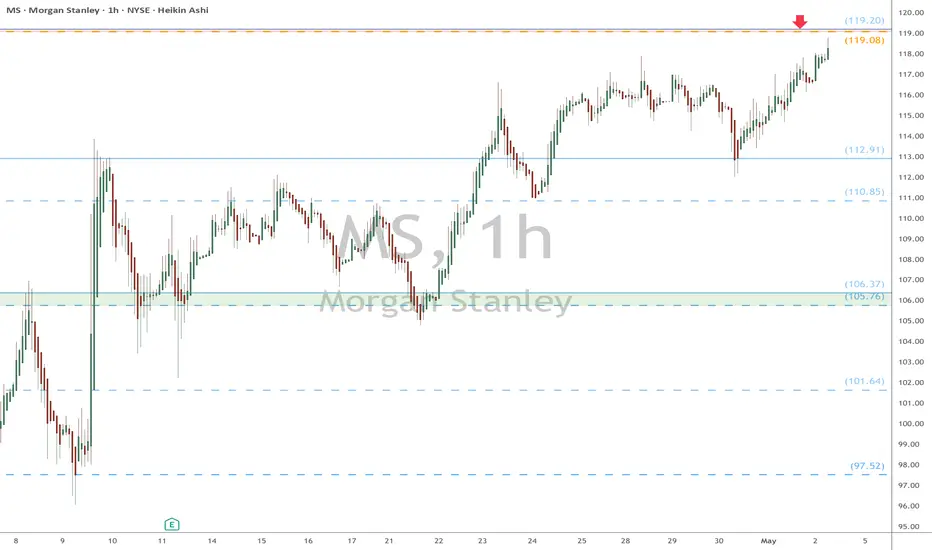
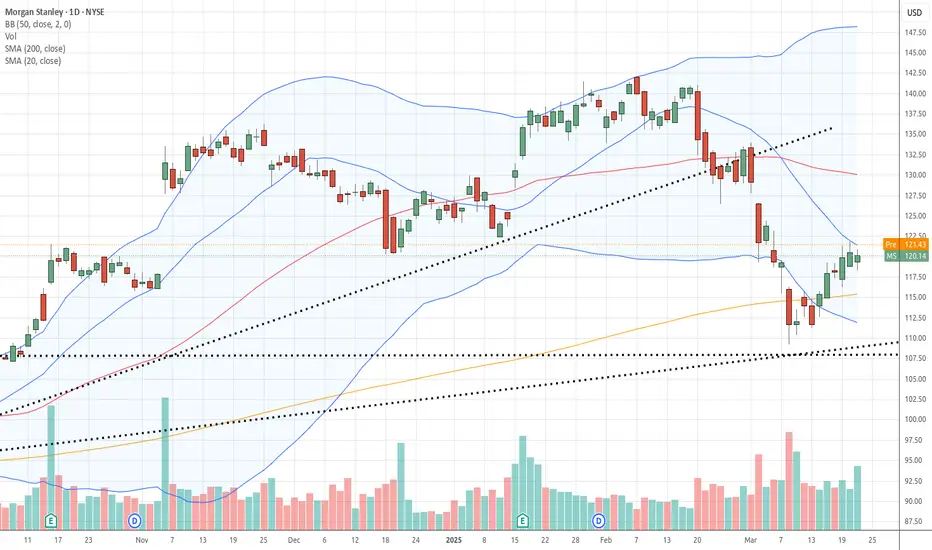
MS eyes on $119: Major Resistance may End Bounce or Strong BullMS recovering well from the tariff tantrum.
About to test a major resistance $119.08-119.20
Break would show strong bull, but dip more likely.
===========================================
.
Morgan Stanley (NYSE: MS) Reports Strong Q125 ResultsMorgan Stanley (NYSE: NYSE:MS ) Beats Q1 estimates with record Equity Trading Revenue. The bank posted earnings per share (EPS) of $2.60, beating analyst expectations of $2.18. Revenue reached a record $17.74 billion, topping forecasts of $16.44 billion.
The bank's equity trading revenue soared 45% year-over-year. It reached a new high of $4.13 billion as growth came across business lines and regions. Asia showed particularly strong performance. Prime brokerage and derivatives led gains, fueled by high client activity in volatile markets.
Morgan Stanley shares dropped 1% after the earnings release. However, the stock remains up over 20% in the past year. Volatility in global markets helped trading desks outperform.
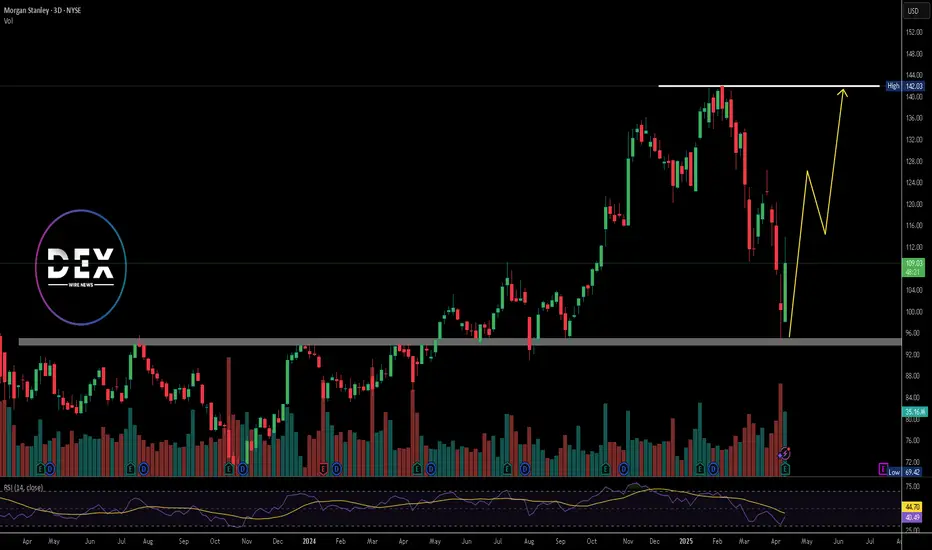
Technical Analysis
Morgan Stanley bounced sharply from the $95 support zone. Buyers stepped in near the previous breakout level. Volume increased and confirmed renewed interest. This was seen as Trump paused tariffs for the next 90 days as well. Current price action suggests a recovery trend. The RSI stands at 39, hinting at oversold conditions. A potential path points to $142.03, which acts as the immediate resistance level.
If the price breaks $113 cleanly, momentum could carry it to $130 and beyond. If it fails, it is most likely to retest $95 support level. A strong break above recent highs would confirm bullish continuation. For now, Watch out the $113 and $142 levels closely.
Down by $90, then by $170I am waiting for a downward movement of $ 90, then $ 170. The cycle of 5 waves ends there starting in 2020.

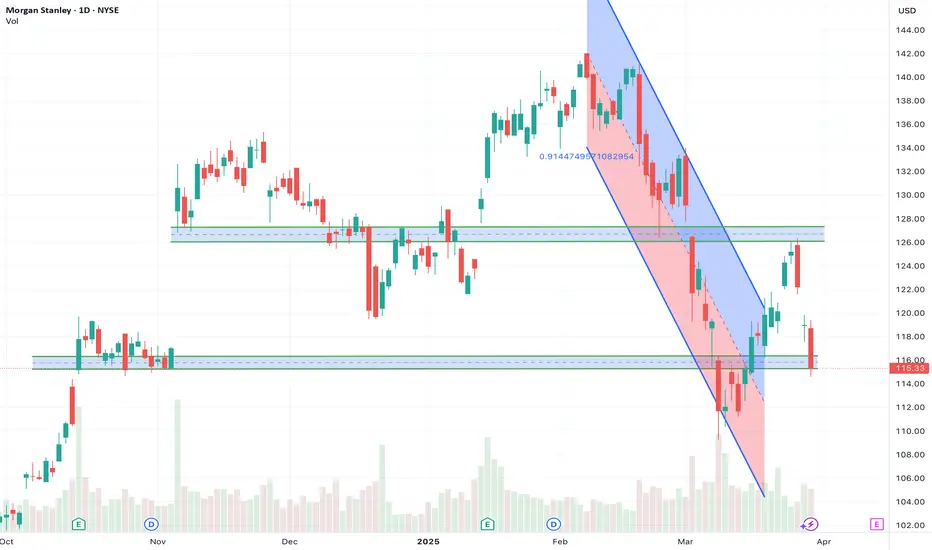
Playing off the potential false breakout?Morgan Stanley's chart is at a critical juncture. After a slide in a descending channel, it briefly poked its head above, but that breakout looks shaky! Now it's dancing around the $115 support zone. A solid hold here, and we might see a bounce. But if that support caves? Watch out for further downside. Is MS about to regain its footing, or is this just a pit stop on the way down? What's your call? Share your predictions!
$MS Tradespoon - Long Entry $119.20Tradespoon model generated long signal for Morgan Stanley ( NYSE:MS ). Predicted range: $119.20–$123.87. Trend: +1.47%. NYSE:MS
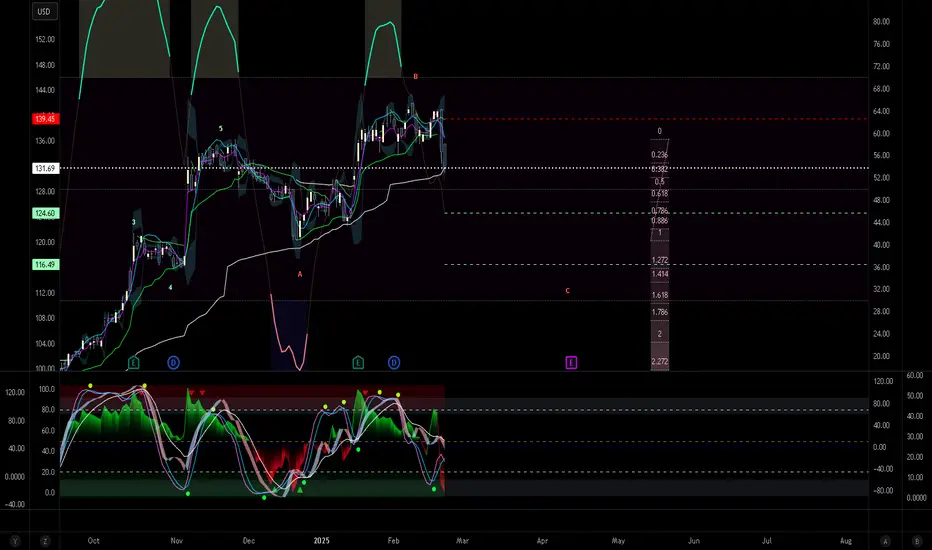
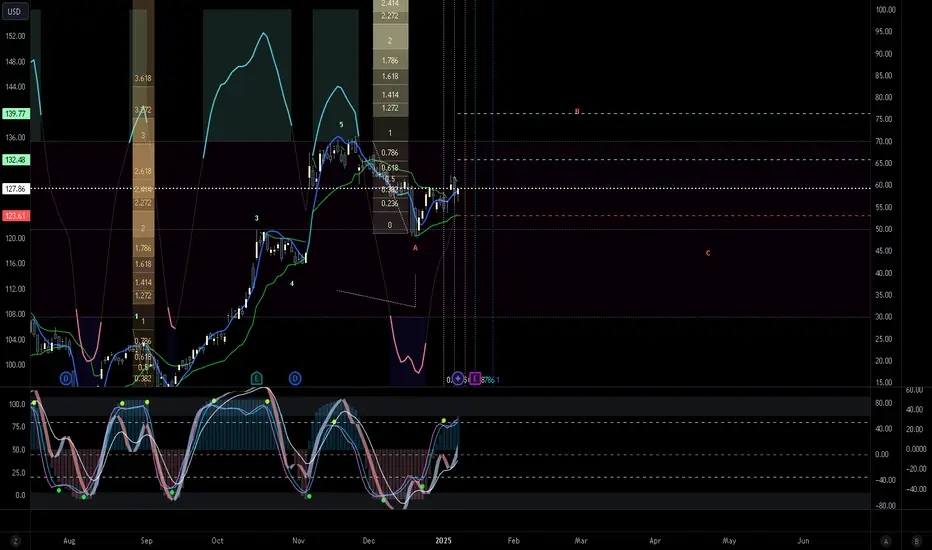
Morgan Stanley Correction. MSOur last take on MS was dead on and quite profitable. The idea will be linked to this one. ABC zigzag, now impulsing down in C wave. Indicator below are bearish but quite choppy, making meaningful interpretation difficult. Price action, MIDAS cross and behavior of vWAP/US duo are key factors in this decision making.
The Last Step Of The 3 Step System ExplainedLook at this chart what do you see?
Yesterday I felt happy because for the first
time even if am broke I get to see the
light of a negative situation
to be esteemed is more important
than gold and silver.
Sometimes all you need is to be
Motivated so that no matter what you
are going through in your life
you can learn and understand what you are trying to
achieve
I enjoy taking walks because it gives
me a chance to think about
my shortcomings and strategies even more
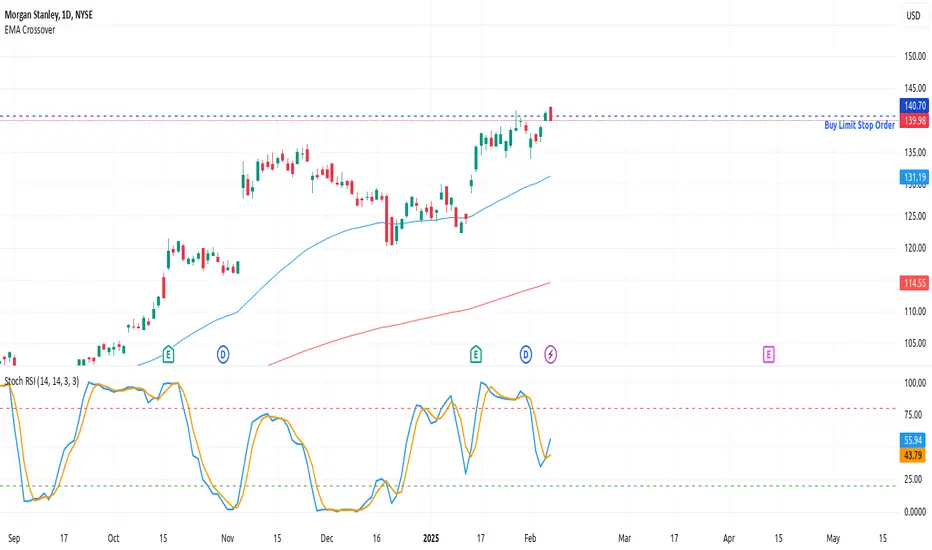
Look below this chart NYSE:MS you
will see the cross-over on the Stochastic RSI
this is a sign that this price action is going
to go up
Just like the last step of the rocket booster
strategy to learn more rocket boost this content.
Check out the references below
to learn more about this 3-step system.
Disclaimer: Trading is risky you will lose money
whether you like it or not please learn risk
management and profit-taking strategies.
Also, feel free to use a simulation trading account.
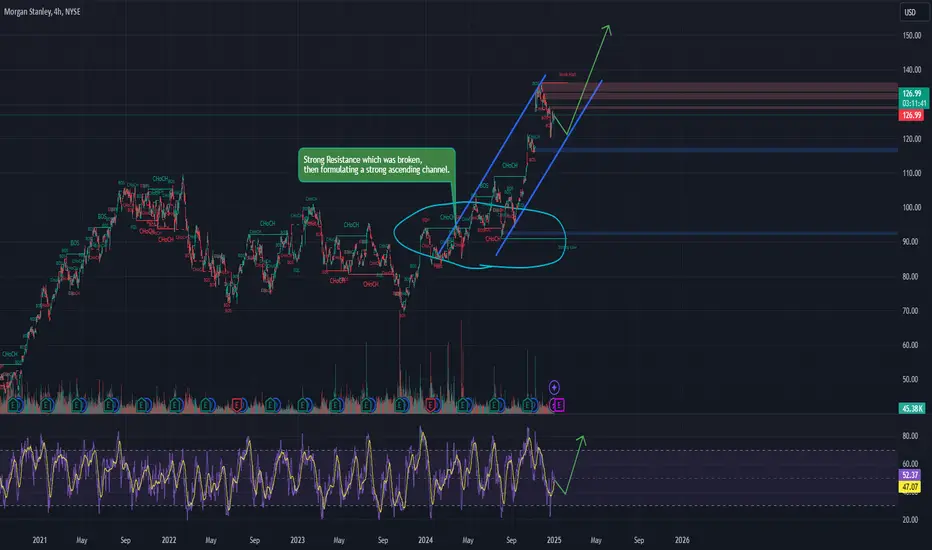
Morgan Stanley, can we follow up on great earnings call?Hi guys, we are next looking into Morgan Stanley. Currently they had a fantastic 2024 , with great growth and great beat over their earnings calls.
Fundamental overview :
Morgan Stanley has adopted a bullish stance on U.S. equities, forecasting the S&P 500 to potentially reach 7,400 by 2025. This optimism is based on anticipated solid earnings growth and accommodative monetary policy, which could enhance the firm's equity trading and investment advisory revenues.
Increased Mergers and Acquisitions (M&A) Activity
The return of Donald Trump to the White House is expected to stimulate a surge in M&A activity, driven by lower borrowing costs and deregulation. Morgan Stanley predicts a 50% increase in M&A deals in 2025 compared to the previous year, which would significantly boost its advisory and underwriting services.
In fixed income, Morgan Stanley identifies securitized credit, particularly U.S. mortgage-backed securities (MBS), as a promising area. The firm believes that moderating monetary policy, coupled with strong consumer and corporate balance sheets, will create favorable conditions for this sector, potentially enhancing its fixed income revenues.
Technical Overview :
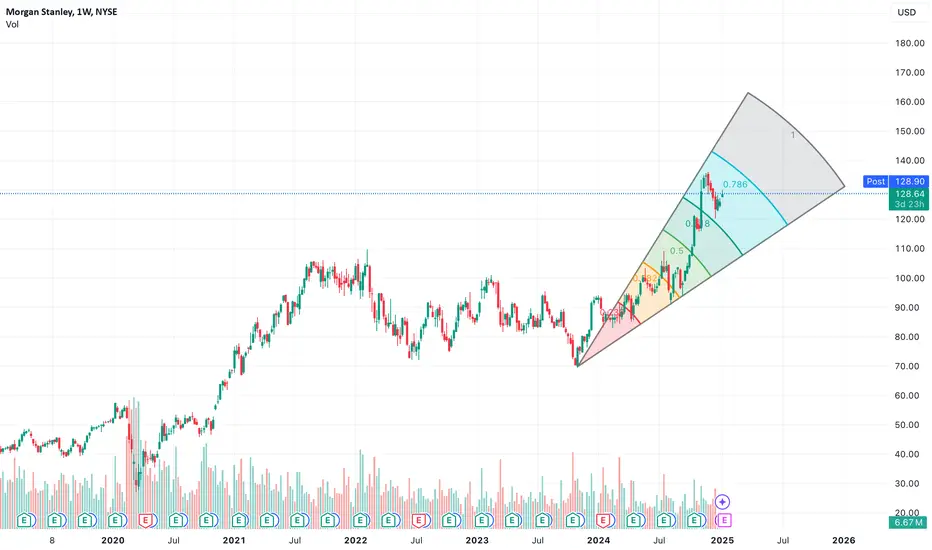
Currently we have surpassed a strong resistance line which has been upgraded to a supprot line because of the strong growth at 2024. Currently this Ascending channel should take us to a 2x price level from 83 level to 166 level.
Entry: 127
Target : 166
As always my friends happy trading!
P.S. If you have questions or inquiries about one of my existing set-ups or personal questions / 1 on 1 sessions consider joining my community so you can follow up with me in private!
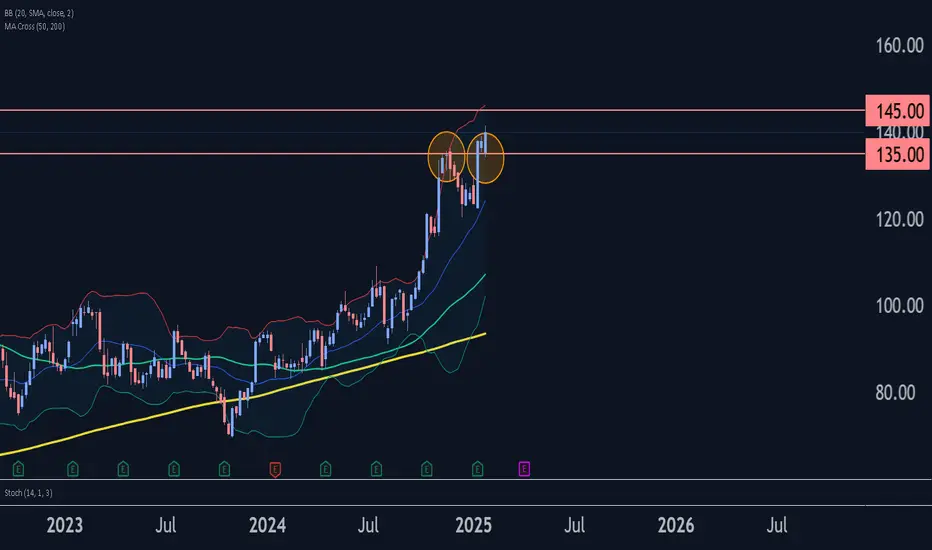
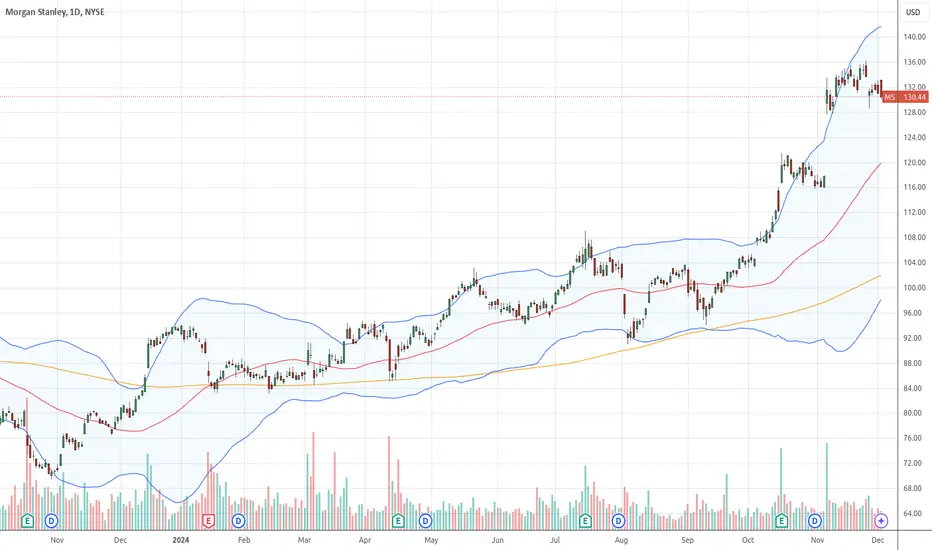
Morgan Stanley Wave Analysis – 30 January 2025
- Morgan Stanley is rising inside impulse wave iv
- Likely to rise to the resistance level of 145.00
Morgan Stanley continues to rise inside the minor impulse wave iv, which started earlier from the key support level of 135.00 (the former monthly high from November), acting as support after it was broken earlier.
The active impulse wave iv belongs to the higher-order upward impulse sequence (C) from last August.
Given the overriding daily uptrend, Morgan Stanley can be expected to rise further to the next resistance level at 145.00 (the target price for the completion of the active minor impulse wave 3)
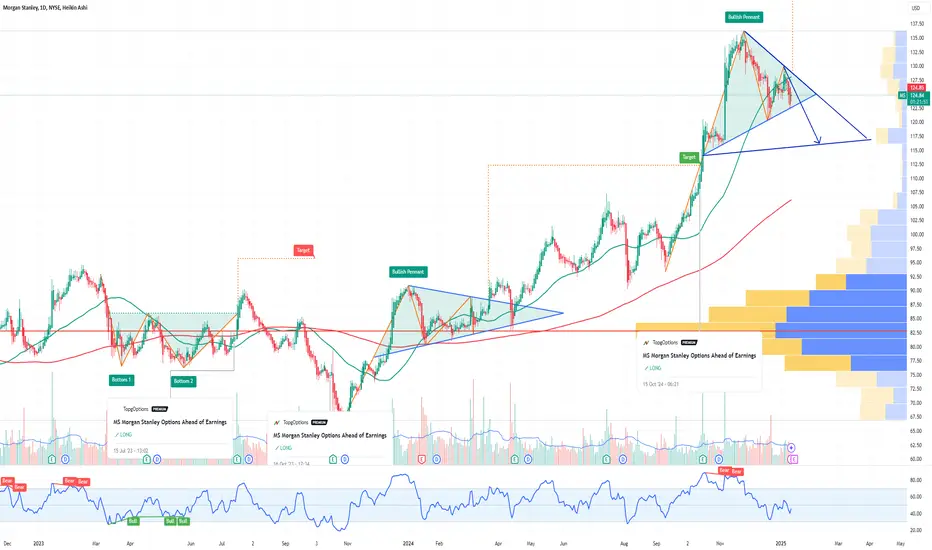
Morgan Stanley Breaks Free A Bullish Wedge Reversal in ActionMorgan Stanley (MS) on the 4-hour chart has confirmed a breakout from a descending wedge pattern, signaling a strong bullish reversal. The breakout is accompanied by increased momentum, as indicated by the clean surge above the wedge’s upper boundary. This setup is a classic reversal signal, with bulls reclaiming control.
The entry is placed at 137.87, capitalizing on the breakout momentum. The stop loss is strategically positioned at 123.50, below the wedge’s lower boundary, to safeguard against invalidation of the setup. The take profit is set at 155.35, aligning with the wedge’s projected target based on its height.
The trade exhibits a solid risk-to-reward ratio, and the breakout aligns with the broader bullish market sentiment for the stock. With buyers driving the price upwards, this trade setup offers a high-probability opportunity for trend continuation.

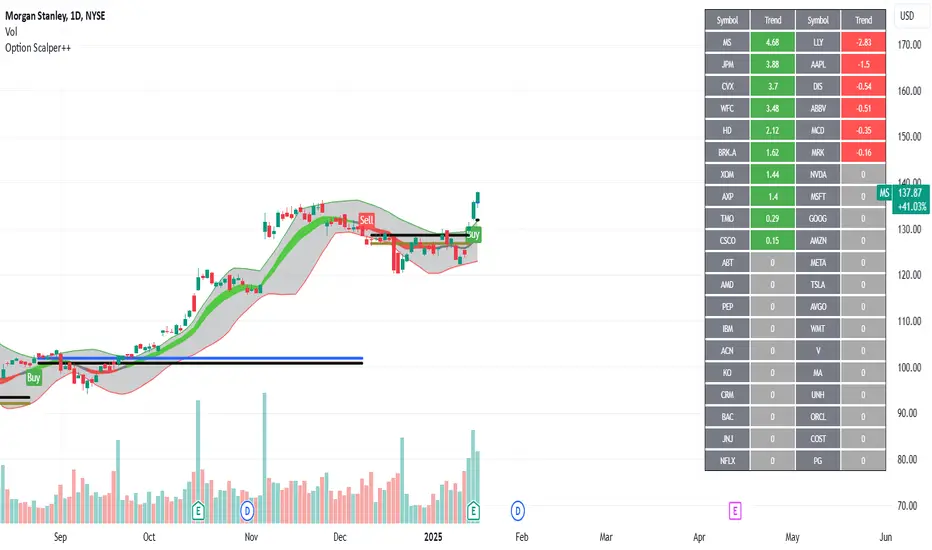
US Market: Stocks Taking Break out and Break Below the CloudThis week following stocks have taken a break out above the cloud (consolidation zone) (1D candle):
1. MS
2. JPM
3. CVX
4. WFC
5. HD
6. BRK.A
7. XOM
8. AXP
9. TMO
10. CSCO
Following stocks have taken a break below the consolidation zone (daily candle):
1. LLY
2. AAPL
3. DIS
4. ABBV
5. MCD
6. MRK
The tool (Zeta Scalper) was fed with 40 stocks (top 40 stocks by market cap) and run at daily candle to find out stocks breaking above and below the consolidation zone.
Use your due diligence before investing or trading.
Morgan Stanley (MS) Shares Display StrengthMorgan Stanley (MS) Shares Display Strength Ahead of Earnings Release
The stock market is eagerly awaiting the start of the quarterly earnings season. Traditionally, it kicks off with reports from major players in the financial sector, including Morgan Stanley (MS). The bank's earnings report is scheduled for tomorrow, Thursday, before the opening of the main trading session.
According to Yahoo Finance, analysts expect:
→ Earnings per share (EPS) to be $1.62, indicating a 43.4% increase compared to the previous year;
→ Revenue to reach $14.8 billion, reflecting a 14.7% rise year-on-year.
Meanwhile, MS’s share price may also be influenced by internal organisational changes at Morgan Stanley. The bank has created a new division to enhance client relations and appointed a new head of wealth management.
MarketWatch notes that the upcoming earnings season could be the strongest in three years (based on FactSet data), with the financial sector likely to be the largest contributor to profits this season. Furthermore, a technical analysis of Morgan Stanley’s (MS) stock chart suggests that market participants are optimistic.
Indeed:
→ Price fluctuations have formed an upward channel (marked in blue), with the share price stabilising around its median line—likely in anticipation of corporate news;
→ During the stock market decline in early 2025, MS’s share price fell less than the S&P 500 index (US SPX 500 mini on FXOpen), as indicated by arrows;
→ The $120 level appears to be a significant support zone.
It’s possible that today’s earnings reports from banks such as JPMorgan (JPM), Wells Fargo & Co. (WFC), Goldman Sachs Group Inc. (GS), and Citigroup Inc. (C) may offer clues about how MS’s stock price might move next.
This article represents the opinion of the Companies operating under the FXOpen brand only. It is not to be construed as an offer, solicitation, or recommendation with respect to products and services provided by the Companies operating under the FXOpen brand, nor is it to be considered financial advice.

MS Morgan Stanley Options Ahead of EarningsIf you haven`t bought MS before the previous earnings:
Now analyzing the options chain and the chart patterns of MS Morgan Stanley prior to the earnings report this week,
I would consider purchasing the 125usd strike price Puts with
an expiration date of 2025-2-21,
for a premium of approximately $4.85.
If these options prove to be profitable prior to the earnings release, I would sell at least half of them.
Recovering on Morgan Stanley. MSCross of both MIDAS and Ehler's US line, with upgoing momentum and suspect B wave formation. Stochastic and volatility factors are both upgoing.
Not financial advice, do your own research.
MS Fib WedgeNYSE:MS
Nice bounce from the Fib trend line inside the wedge, stock is making the way back to highs.
Comment what you think about this chart.
Comment any tips or suggestions.
NYSE:MS
MS | SHORTNYSE:MS
Technical Analysis of Morgan Stanley (MS)
Key Observations:
Current Price Action:
Price: $95.85
Recent Drop: -5.91 (-5.81%)
Support and Resistance Levels:
Immediate Support: $93.99 (Bearish Line)
Further Supports: $92.66 (Target Price 1), $86.34 (Target Price 2), and $82.74 (Target Price 3)
Trendlines:
The price has broken below the upward trendline, indicating a potential shift from a bullish to a bearish trend.
Relative Strength Index (RSI):
Current RSI: 52.21
The RSI shows a decline, indicating increasing selling pressure but still in a neutral zone.
Target Prices:
Target Price 1: $92.66
This level is the immediate support and a potential first target for any continued downward movement.
Target Price 2: $86.34
If the price breaks below the immediate support, the next target is around $86.34, a previous support level.
Target Price 3: $82.74
Further downside could see the price reaching $82.74, another key support level.
Summary:
Morgan Stanley (MS) has experienced a significant drop, breaking below a key support level and its upward trendline. The next levels to watch are $93.99, $92.66, $86.34, and $82.74. The RSI is neutral, suggesting the potential for further declines if market conditions remain negative.

$MS Tradespoon - Long Entry $130.78Tradespoon model generated long signal for MS NYSE:MS . Predicted range: $130.78–$133.41, with 52% probability of upward move. Key support at $130.78. Trend: +0.51% today. NYSE:MS
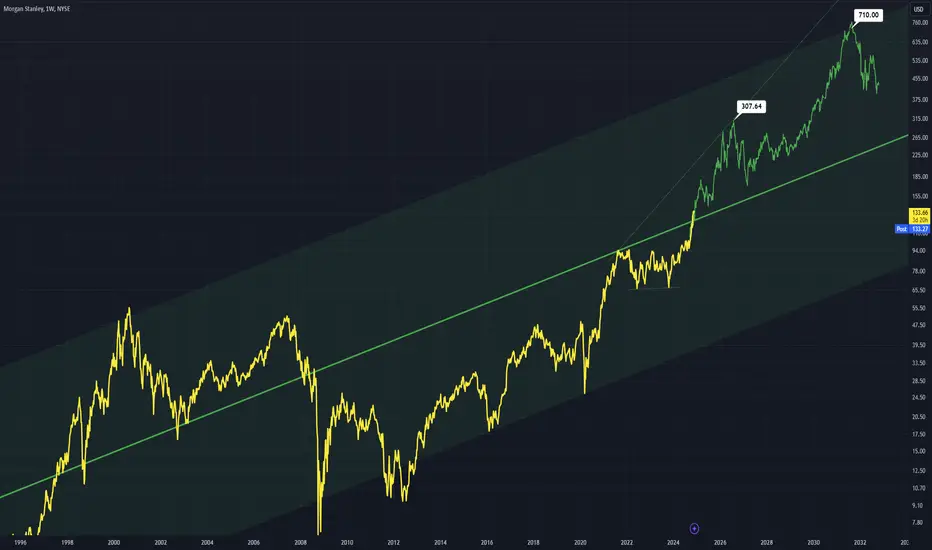
Morgan Stanley - Bulls In ChargeSmall flag structure formed under the middle of this channel which lets the bulls push higher
This channel will be in effect for the bulls for years to come.
Weekly chart
$MS with a neutral outlook following its earnings #StocksThe PEAD projected a neutral outlook for NYSE:MS after a positive under reaction following its earnings release placing the stock in drift A with an expected accuracy of 91.67%.

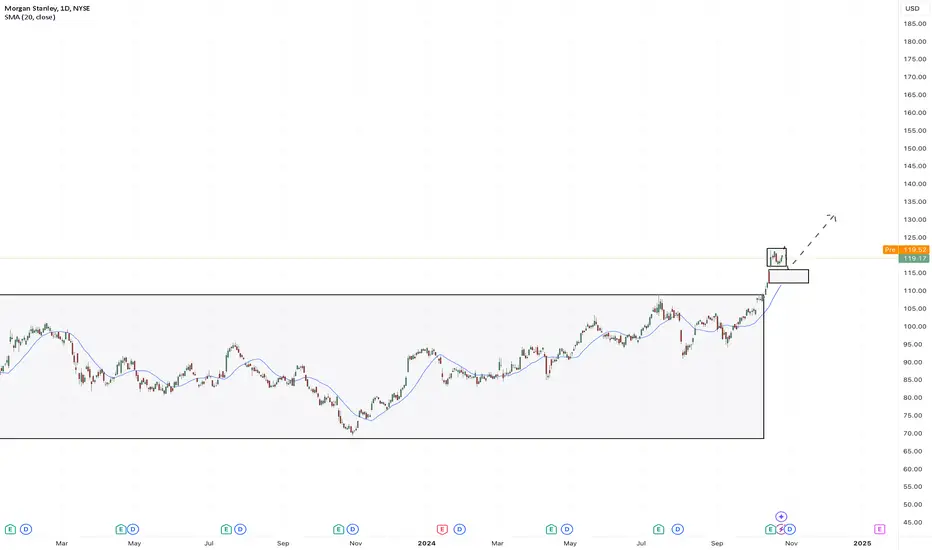
Morgan Stanley grows after strong earningsAfter a strong earnings and revenue surprise, the stock of Morgan Stanley is on fire, having broken the long-term trading range and accelerating for more than 3 values of ATRs (average volatility levels) from the dynamic support.
Usually, that's an indication of a strong price discovery and can lead to a further extension of the price in the direction of a breakout. Most probably, first it needs to pull back to the 20-day moving average before proceeding to the upside.
Note: The market is driven higher ahead of US elections, but Nov 1-2 is a potential high-volatility period, so beware of that in case of holding any positions over this period.
Don't forget to manage your risk at all times!
MS Morgan Stanley Options Ahead of EarningsAnalyzing the options chain and the chart patterns of MS Morgan Stanley prior to the earnings report this week,
I would consider purchasing the 115usd strike price Calls with
an expiration date of 2024-11-15,
for a premium of approximately $2.26.
If these options prove to be profitable prior to the earnings release, I would sell at least half of them.
