NVDA LongJust checked this stock which seems very good trade for now. With a flow of good news for the past week about the trade war between China and USA, there is a good possibility for a long trade in here. Also technically, a downtrend line has been broken, and liquidity got swept, so i cant see anything in the way of a long trade in here.
See this marked blue line, thats a down trend that got broken. Now i would be looking for this small gap to be filled and the price testing the downtrend.
Confirm on lower tf if the price would hold this trendline and wont go below it, then make an entry.
NVDA trade ideas
Nvidia Breaks Out and Stays OutNvidia has powered to new all-time highs, reclaiming its title as the world’s most valuable
company. The move is being driven by a blend of AI-fuelled optimism and technical resilience.
AI spending is alive and well
After a rocky start to the year, Nvidia’s resurgence has been fuelled by a sharp rebound in
confidence across the AI ecosystem. At the company’s shareholder meeting, CEO Jensen Huang
painted a bullish long-term picture, calling the AI boom a multitrillion-dollar opportunity and
highlighting the rise of sovereign AI infrastructure around the world. That message landed well with
the market, especially after several big tech firms reaffirmed their commitment to AI investment
during earnings season.
Micron added fuel to the rally with a blowout earnings report, topping forecasts and issuing strong
guidance on AI-driven demand. Investors have also warmed to the idea that Nvidia’s grip on the AI
hardware stack remains firm, despite rumblings of competition. Cloud giants like Microsoft and
Amazon may want to build their own chips, but for now, the fastest and most scalable path still runs
through Nvidia.
The price action tells its own story
They say the strongest stocks are the ones that bounce back quickly from bad news. Nvidia fits the
bill. After a nasty correction in Q1, triggered by China export restrictions and the DeepSeek
breakthrough, it would’ve been easy for sentiment to stay sour. Instead, since mid-April, the chart
has told a different story. The January gap has been closed, the stock has gone sideways to digest,
and now we’ve seen a clean breakout to fresh highs.
Volume was healthy on the move higher. Not euphoric, but solid enough to back the price action.
What matters now is follow-through. Traders will want to see Nvidia hold above the breakout zone,
and so far the early signs are promising. Price has now closed above the breakout for three sessions
in a row, increasing the probability that this isn’t a fake-out.
There’s also a clear ascending trendline in play, offering a reference point for future pullbacks
alongside the old horizontal resistance. The RSI is up at 76, but that’s no red flag here. Nvidia has
happily trended with the RSI in the 80s before, and momentum doesn’t tend to fizzle out just
because it’s technically overbought.
NVDA Daily Candle Chart
Past performance is not a reliable indicator of future results
Disclaimer: This is for information and learning purposes only. The information provided does not
constitute investment advice nor take into account the individual financial circumstances or
objectives of any investor. Any information that may be provided relating to past performance is not
a reliable indicator of future results or performance. Social media channels are not relevant for UK
residents.
Spread bets and CFDs are complex instruments and come with a high risk of losing money rapidly
due to leverage. 85.24% of retail investor accounts lose money when trading spread bets and
CFDs with this provider. You should consider whether you understand how spread bets and CFDs
work and whether you can afford to take the high risk of losing your money.
NVIDIA NVIDIA has tapped the target we setup few weeks ago, now we are waiting for the pullback.
Disclosure: We are part of Trade Nation's Influencer program and receive a monthly fee for using their TradingView charts in our analysis.
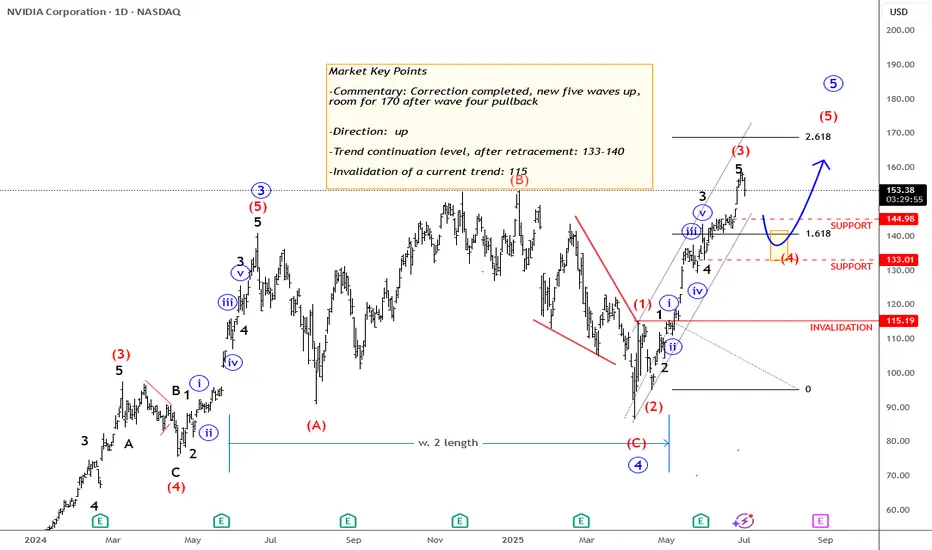
Nvidia - More Upside After Correction NVIDIA completed an irregular flat correction back in April. Since then, the price action has been strong and steady, forming higher highs and higher swing lows —a clear sign of bullish con-
continuation.
From an Elliott Wave perspective, the current move appears incomplete, as we cannot yet identify a full five five-wave advance from the April lows. This suggests that more upside may still be ahead.
However, we could see a wave four pullback develop sometime during the summer. If that occurs, the key support zone to watch would be around $140 down to $130, which could provide
an opportunity within the ongoing uptrend.
- Resistance: 170
- Support: 143 / 132
- Invalidation: 115
GH
NVIDIA(NVDA) Jackpot – Thief Trading Blueprint for Fast Profits!🚀 NVDA Stock Heist: The Ultimate AI Gold Rush (Scalping/Day Trade Plan)
🌟 Hey there, Market Pirates! 🏴☠️💰
Thieves, Traders, and Money Makers—gather around! Based on the 🔥Thief Trading Style🔥, here’s our master blueprint to loot NVIDIA’s AI-fueled rally. Follow the strategy on the chart—long entry is LIVE! Our escape? Near the high-risk Resistance Zone. Overbought? Consolidation? Reversal trap? Bears are lurking, but we’re stealing profits first! 🎯💸
🎯 Entry (The Vault is Open!)
"Swipe the AI gold at any price—the heist is ON!"
Pro Tip: Use buy limits within 15-30min near swing lows/highs for pullback entries.
🛑 Stop Loss (Thief’s Escape Route)
SL at recent swing low (4H timeframe)—adjust based on your risk & lot size.
Scalpers/Day Traders: Tighten SL if stacking multiple orders.
🏆 Target 🎯: 165.00 (The AI Jackpot!)
📈 Why NVDA?
Bullish momentum from AI dominance, earnings hype, and institutional FOMO.
Tech sector strength + chip demand = THIEF’S PARADISE.
📰 Fundamental Heist Intel
Need macro trends, sentiment, and intermarket analysis? 🔗 Check our bioo for the full robbery toolkit.
⚠️ Trading Alert: News & Position Control
Avoid new trades during earnings/news—volatility kills heists!
Trailing SLs = Locked profits. Don’t get greedy!
💥 Boost This Heist!
👊 Hit "Like" & "Boost" to fuel our next raid. Every click = More stolen profits! 🚀💰
🤑 Stay tuned—more heists coming! NVIDIA today… what’s next? 🤫🐱👤

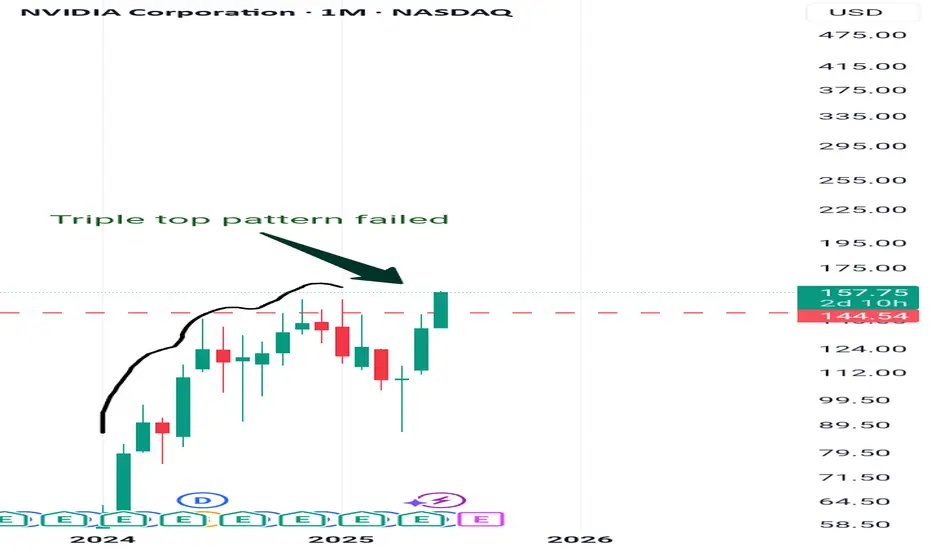
Triple top pattern failedTemporary postponement of repeat of the 1997 Eastern financial crisis by breaking the previous ceiling
Triple top pattern failed
My buy view for NVDAMy buy view for NVDA.
Nvidia has made a significant push up after the meltdown following the new US tariff news.
The push-up is likely cooling off for this baby.
If the current consolidation continues to be sustained by the support zone (TL) in this zone, we are likely to see NVDA rally to $149 and $152 as TP1 and TP2, respectively.
My SL will be around $128.9 zone for both.
RR of 1:4 and 1:4.8
Trade with care
$NVDA 6/27 exp week; $150 calls. Quick ChartHello. Market is moving up off the “news” of “ceasefire” from Trump. Take what is given I suppose. NASDAQ:NVDA could see a beautiful upside towards the psych level of $150 in just one session (Tuesday, 6/24) which is just a “small” move of 3%. Could break out of its rising wedge. This name has been lackluster as of late (kinda sorta). $150 calls will be entered at open (6/24) and my first target will be $148.98. There are multiple rejections at these levels. Good luck!
WSL
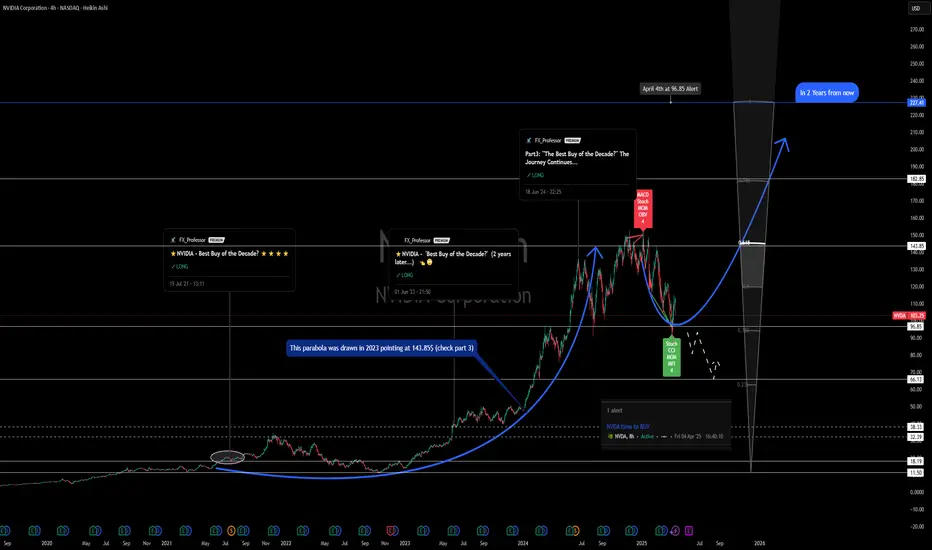
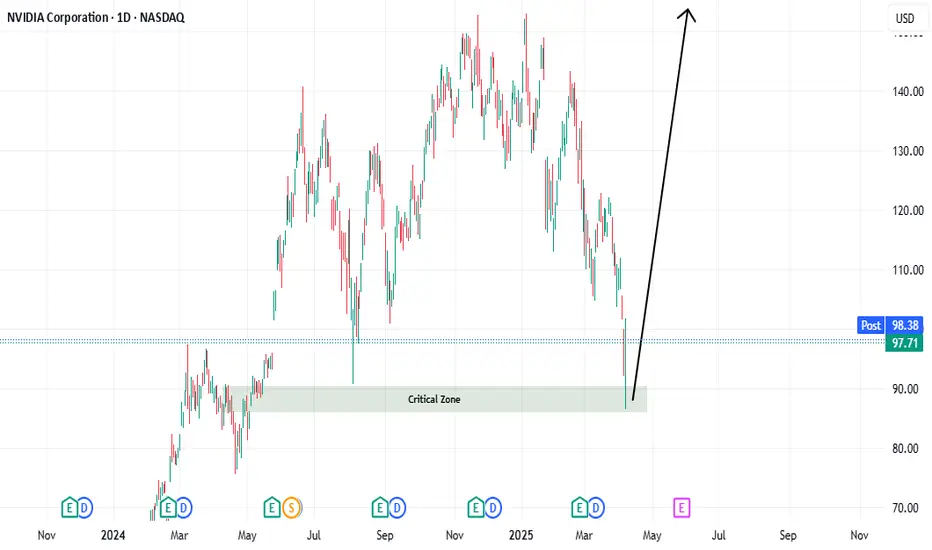
NVIDIA – Best Buy of the Decade (2 Years from now) 🚀💻 NVIDIA – Best Buy of the Decade (2 Years from now) 🔥🧠
Hey everyone! Back in 2021, I called NVIDIA the best buy of the decade, and in 2023, we followed up as NVDA rocketed to my target of $143. Now in 2025, it’s time for Part 3 — and the case for NVDA being a generational play just got even stronger. 💪
✅ On April 4th, I re-entered around $96.85, right at my alert level. The setup? A rounded bottom reversal pattern forming with 4 strong bullish divergences on key indicators (Stoch, CCI, MOM, MFI). Target levels ahead:
📍 $143
📍 $182
📍 $227
📉 Yes, Nvidia took a 6% hit after announcing a $5.5B impact from U.S. export restrictions on its H20 chip to China — a reminder that macro & geopolitical factors still matter. But…
💡 The company just launched DGX Spark and DGX Station, bringing AI supercomputing to the desktop — powered by Grace Blackwell architecture. That’s next-level innovation, not just for enterprises, but for developers, students, and researchers alike. A true desktop AI revolution.
🇺🇸 And most importantly: NVIDIA will now manufacture AI supercomputers on U.S. soil — in Arizona and Texas — aiming to produce $500 billion worth over the next four years. This initiative is a bold move toward supply chain resilience, economic growth, and cementing NVIDIA’s leadership in the AI arms race.
⚠️ If we lose the $96 level, I’ll re-evaluate. But for now? The technical and fundamentals still say: Best Buy of the Decade (2 Years from now we will revisit this chart).
💬 What’s your outlook? Are you buying the dip or waiting on clarity?
One Love,
The FXPROFESSOR 💙
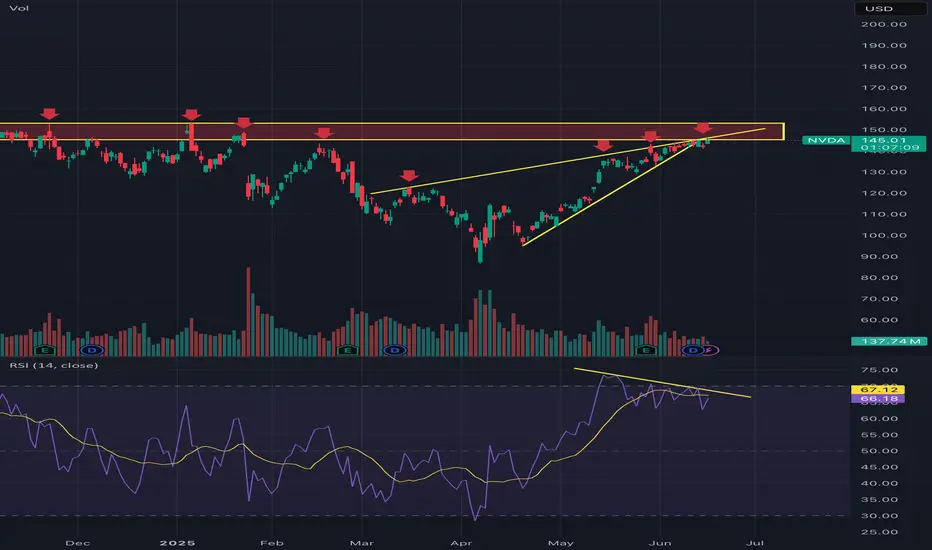
Nvidia into MAJOR resistance This will not be a popular opinion and that’s okay. The charts don’t lie and you can see it is into major resistance, highlighted by all the red arrows when it got rejected. It’s now broken down from a rising wedge which also lines up with said major resistance. I’ve also highlighted bearish RSI divergence, too many factors here for NVDA to keep going up. Could it break through? Of course it could but you have to look at all these factors I’ve highlighted and ask yourself what are the probabilities that it goes down here? High, very high and you want to take trades that put the probabilities in your favor.
NVDA at a Decision Point! (June 24–28)NVDA at a Decision Point! Gamma Walls and CHoCH Setups in Play 🔥
🔍 GEX Analysis (Options Sentiment Overview)
* Current Price: 143.85
* Key Gamma Levels:
* GEX Support Zone: 140 → 141 (Major PUT Support with -28.46% positioning)
* PUT Wall Zones: 139, 138 (risk of acceleration below 140)
* Resistance Above: 146 → 149 range (Highest positive GEX @ 150, dense CALL walls up to 155)
* GEX Interpretation:
* Above 146: Triggers a mild-to-strong positive gamma squeeze potential. Clear air to 150 → 155.
* Below 141: Exposes NVDA to negative gamma drift toward 138 and possibly 134.
* Sentiment Metrics:
* IVR: 3.9 (Extremely low)
* IVx avg: 43.6
* Options Skew: Call $ flow only at 4.5% → suggesting lower speculative bullish bets currently.
📈 Technical Structure – 1H SMC Breakdown
* Trend: Currently in a consolidation range with a breakdown attempt under ascending channel and CHoCH shift.
* CHoCH Confirmed: Multiple bearish CHoCHs signal change of character at the highs.
* Rejection Zone: 145.48 → 146.20 (purple supply zone holding)
* Support Demand Zone: 140.86 → 142.20 (green box below where buyers may defend)
* Break of Structure (BoS): Under 143.13 opens the door to revisit lower demand zones.
⚔️ Trade Scenarios
🟩 Bullish Scenario
* Entry: Above 146.20 reclaim (post-break and retest)
* Target 1: 149.00
* Target 2: 150.50 → 155.00
* Stop Loss: Below 143.50
* Confluence: Gamma squeeze + reclaim of CHoCH rejection = fuel to upside
🟥 Bearish Scenario
* Entry: Breakdown below 143.13 with confirmation
* Target 1: 141
* Target 2: 138
* Stop Loss: Above 145.50
* Confluence: Bearish CHoCH + gamma wall at 140 could act like a magnet
📌 What to Watch
* GEX Pivot: 146.20 → Key reclaim level to watch early week.
* Volume Clues: Last drop had strong volume surge → If it sustains below 144, favor bearish flow.
* Intraday Bias: First retest of 144 → 145 zone may be a short opportunity unless bulls absorb and flip structure.
💡 Quick Thoughts
* NVDA is stuck in a high-volatility zone between a strong CALL wall cluster above and PUT support danger zone below.
* If macro or SPY drags, the 140 wall could get tested quickly.
* On the flip side, a reclaim of 146.20 is an easy trigger for bulls to squeeze to 150 and potentially 155.
📉 Bias: Slightly bearish unless bulls reclaim 146.20 and hold.
🎯 Most Important Level This Week: 146.20
Disclaimer: This analysis is for educational purposes only and does not constitute financial advice. Always do your own research and manage your risk.
NVDA DECISION TO MAKE watching NVDA on breakdown or failure of breakdown Harmonic. increased volume at double bottom and D PRZ suggests to me this will not breakdown, but i dont think it wont chop away my confidence either. ill just wait for the direction.
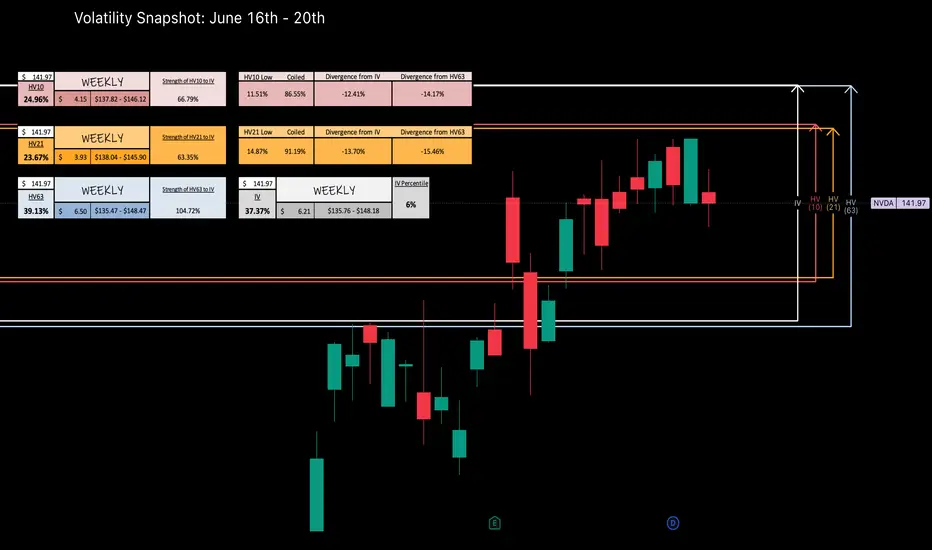
Nvidia - Weekly Volatility SnapshotGood Afternoon! Let's talk NASDAQ:NVDA
Last week we saw HV10 (24.96%) increase above HV21 (23.67%) after starting what could be a regression towards HV63 (39.13%). IV (37.37%) entering this week reflects within 6% of it's sliding yearly lows and resonating around quarterly means. This could be showing a fair prediction to the regression potential and a volatility spike.
Here, the RSI has room but is elevated and hinged down with the MACD crossed red -- lagging indicators showing trend reversal. If bi-weekly values can find regression to quarterly; the implied range I would be watching is $135.47 - $148.47 with IV increasing affecting premium positively. If the grind up continues slowly, expect IV to melt and be watching for contracting HV10 ranges between $137.82 - $146.12 -- Keep an eye on the news, it will ever affect the broader markets and any underlying within.
Follow along through the week as we track our volatility prediction -- I will pull the charts back in at the end of the week to review!
CHEERS!
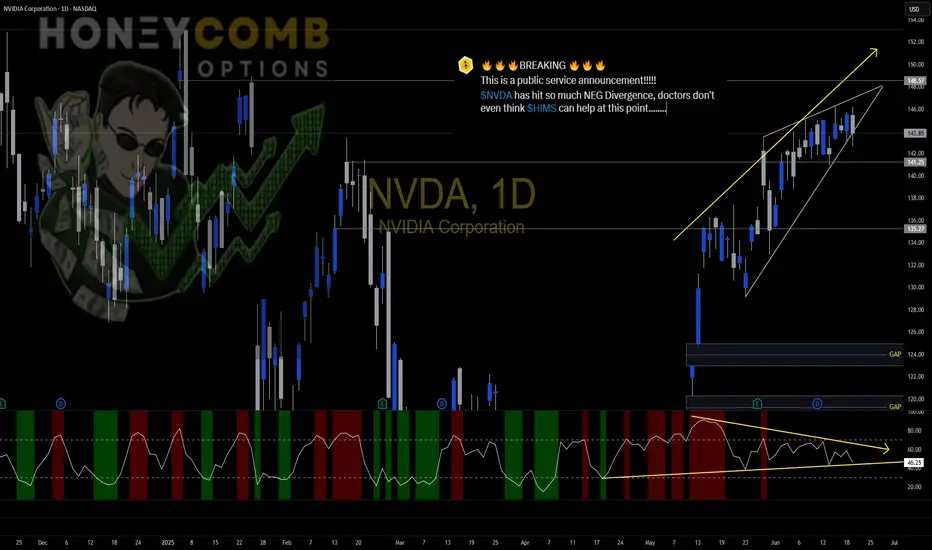
NVDA might want to check this out.Been on a great run... whatever it's holding on to looks like it's about to break. So much negative divergence.
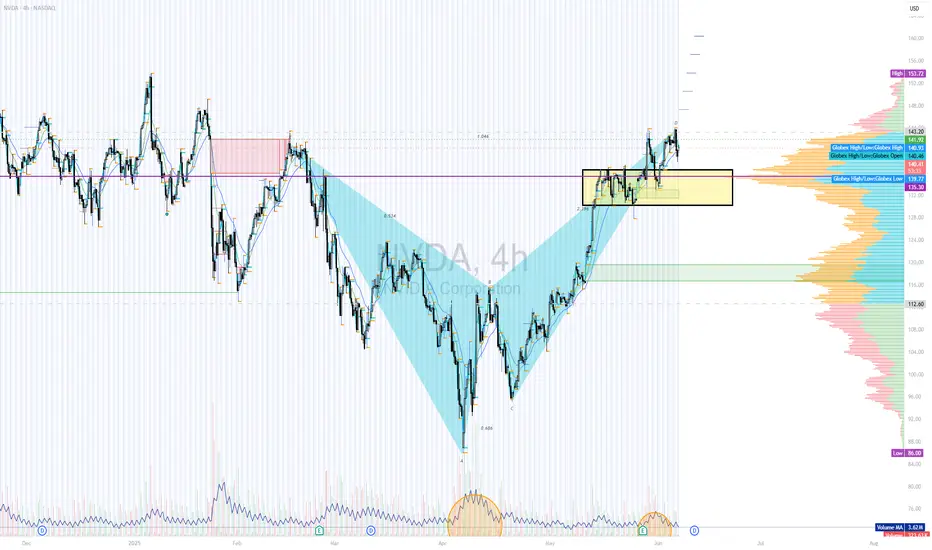
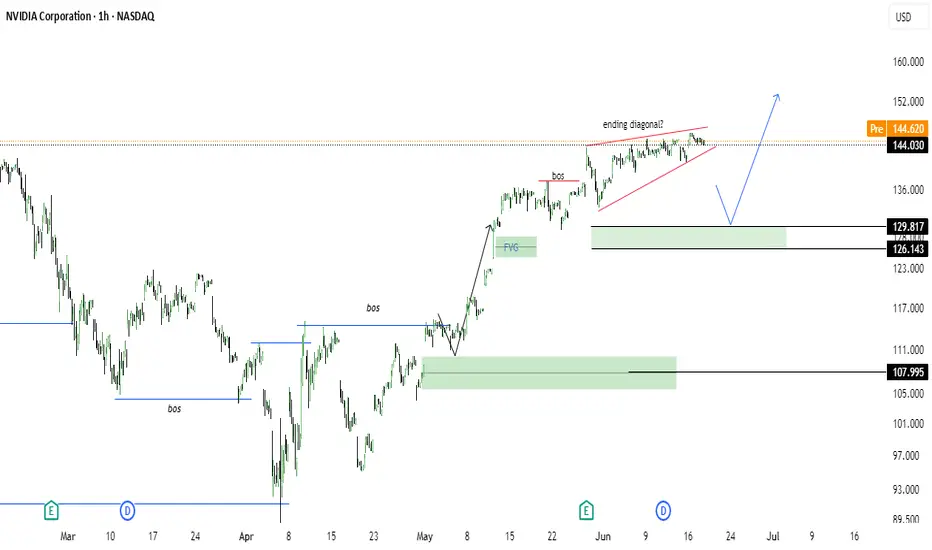
NVIDIA (NVDA) – Ending Diagonal at the Top? 126 Next?NVDA is currently trading inside a potential ending diagonal, often signaling a reversal or strong correction. With multiple Breaks of Structure (BoS) and a visible Fair Value Gap (FVG) left behind, this setup is aligning with Smart Money Concepts.
📉 Bearish Rejection Expected?
Price might sweep liquidity and revisit the 126–129 demand zone, where strong unmitigated orders sit. If this zone holds, a bullish continuation toward 152+ is likely.
🔍 Key Highlights:
⚠️ Ending Diagonal pattern near local top
📊 Multiple BoS confirming internal structure shifts
📉 Unfilled Fair Value Gap (FVG) near 129
🟩 Strong demand zones at 129–126 and 108
🔄 Potential liquidity sweep before reversal
🧠 Smart money footprint visible
📅 Watch for price reaction around 129.8–126.1.
📈 Breakout above 145 with strength may invalidate the drop.
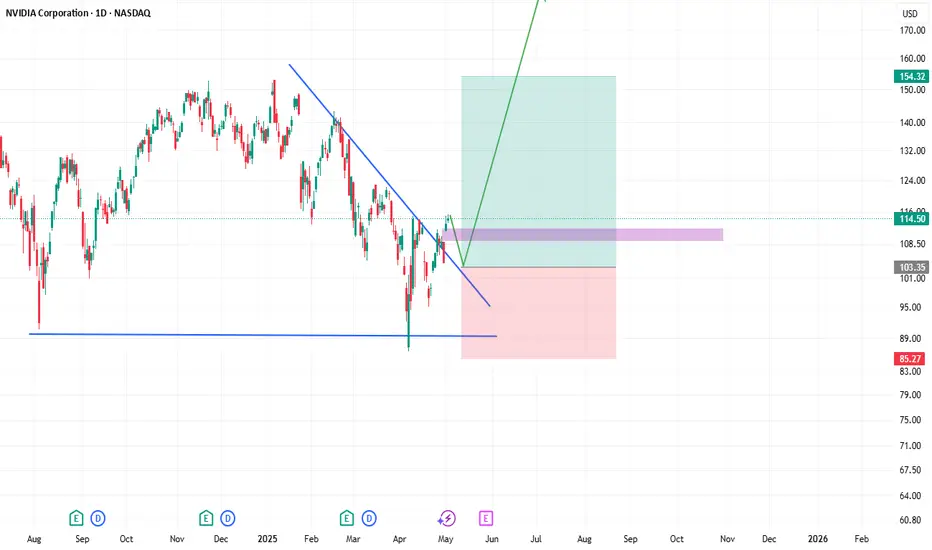
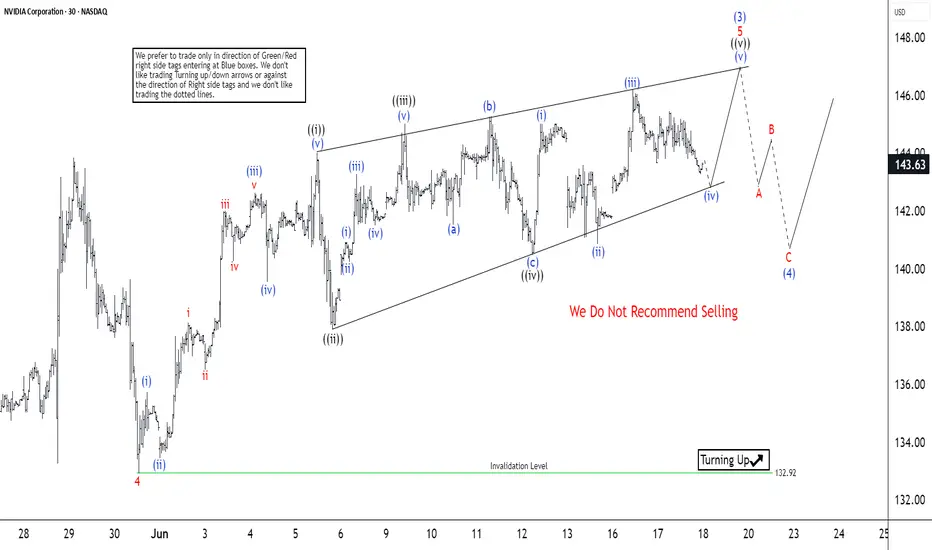
Nvidia (NVDA) Wave 3 Close to ConclusionSince July 4, 2025, Nvidia (NVDA) has been experiencing a robust rally. The rally is unfolding as a five-wave impulse structure according to Elliott Wave analysis. This upward movement began at a low on July 4, 2025, with wave (1) concluding at $115.44. A subsequent pullback in wave (2) found support at $95.04. This sets the stage for the ongoing wave (3), which has developed as another impulsive subdivision.
Within wave (3), the stock advanced in wave 1 to $111.92. A brief dip in wave 2 then followed to $104.08. The momentum resumed in wave 3, pushing the stock to $143.84. Afterwards, a corrective wave 4 settled at $132.92, as observed on the 30-minute chart below. Currently, Nvidia is advancing in wave 5 of (3). This wave has seen wave ((i)) peak at $144, followed by a pullback in wave ((ii)) to $137.88. The stock then surged in wave ((iii)) to $145, with a minor correction in wave ((iv)) completing at $140.46.
Wave ((v)) higher should end soon, concluding wave 5 of (3). Following this, a larger-degree wave (4) correction is expected, potentially unfolding in a 3, 7, or 11-swing pattern. This pullback should precede a final ascent in wave (5), completing the cycle from the July 4, 2025 low.
NVIDIA to $228If Nvidia were truly done for, why is it impossible to find their latest 5000 series GPUs?
Even if someone wanted to buy one, they simply can't.
The reason lies in Nvidia's commitment to fulfilling the soaring demand from AI data centers, which has left them unable to produce enough H100 and H200 models.
This situation also allows Nvidia to increase their profit margins significantly, capitalizing on the disparity between demand and the media frenzy surrounding them.
DeepSeek serves as a prime example of how out of touch mainstream media can be.
All DeepSeek did was replicate Chat GPT.
Training models requires substantial computing power. The panic surrounding Nvidia and other semiconductor companies is quite amusing; the demand for computing power is skyrocketing!
The gap between the reality of the AI mega-trend and the narrow focus of mainstream media is staggering! It's astonishingly out of touch! Just as out of touch as Cramer was when he declared META was done at $100, or when he thought Chat GPT would obliterate Google at $88.
Stock prices fluctuate between being overvalued and undervalued. While we have metrics like EGF and PE ratios to assess valuation, indicating that Nvidia is currently inexpensive, this doesn't guarantee it won't drop further. However, it is generally wiser to buy stocks when they are cheap rather than when they are costly.
The greater the deviation from the high then the greater the BUYING OPPORTUNITY being presented for the very best leading companies.
The key takeaway is that the deeper Nvidia falls during its corrections, the more advantageous it could be.
Those who are experiencing anxiety during these declines may find themselves selling at a loss, or for a marginal profit possibly around previous highs, while the stock has the potential to rise to $228 and beyond.
The potential for growth is significant; the $228 Fibonacci extension may not represent the peak. Attempting to predict a top for Nvidia could be misguided. Once it reaches $228, Nvidia might maintain a valuation similar to its current $130 level.
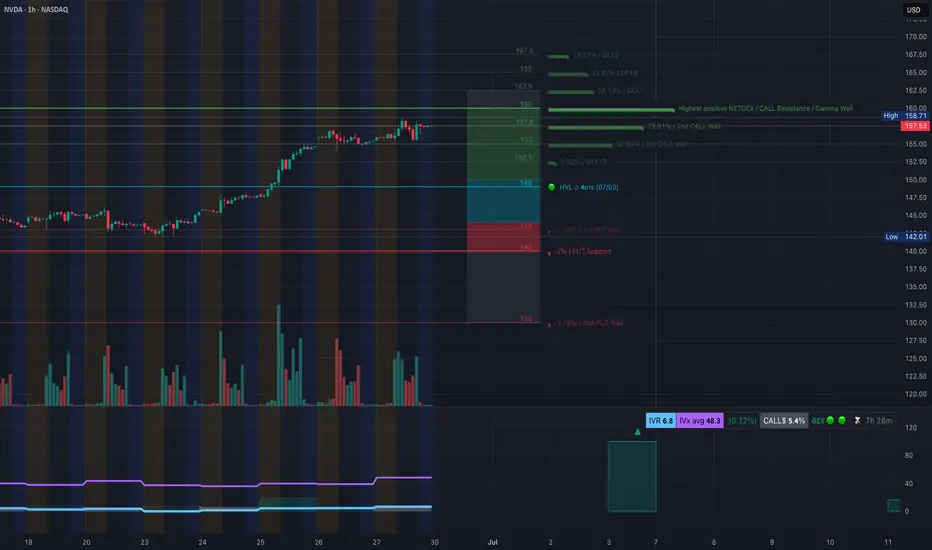
NVDA at Inflection Point: Reclaim $158 or Fade to $150?NVDA at Inflection Point: Reclaim $158 or Fade to $150? Monday Setup Ready 📉📈
🧠 GEX-Based Options Sentiment:
— The $158.71 level is the highest positive GEX zone and aligns with the 2nd CALL Wall. This is the strongest gamma resistance — the level to beat.
— $157.50 is the 3rd CALL Wall (7.99% GEX) and has acted as a ceiling — NVDA is currently pinned underneath.
— Below, $152.50 to $150 forms a GEX magnet zone, where price is likely to gravitate if weakness sets in.
— The $149 HVL zone also aligns with this gamma pocket, making it a strong downside target.
— Implied Volatility Rank (IVR) is very low at 6.8, which makes options cheap — ideal for buying directional calls or puts.
— Call flow shows a moderate bullish lean (5.4%), but nothing extreme. No signs of a major squeeze — yet.
🔧 Options Setup for Monday–Wednesday:
Bullish Trade Idea:
If NVDA breaks and holds above $158, consider buying a CALL debit spread, such as 158c/165c expiring July 3 or July 5.
Target zones would be $160 and $165 based on GEX7 and GEX6.
Stop-loss would be a move back under $157, especially on rising volume.
Bearish Trade Idea:
If NVDA fails to reclaim $157 and breaks below $155, consider a PUT or a PUT debit spread. 155p to 150p (Jul 3 expiry) would be the play.
First target is $152.50, followed by $149.
Stop if price recovers $157.50 with strong bid.
📉 Intraday Technical Breakdown (1H Chart):
The structure shows clear signs of weakening strength.
— NVDA had a confirmed BOS, but now it’s printing a CHoCH just under the trendline and inside a supply zone.
— Price rejected multiple times near $158.
— Volume spiked into the Friday close but did not confirm breakout — more likely to be profit-taking or gamma hedging.
— The short-term trendline has been broken, and bulls are defending the structure weakly.
📌 Key Intraday Levels to Watch:
— $158.71: Gamma ceiling and major supply zone. Break above this can lead to a squeeze.
— $157.00: Local resistance from Friday.
— $155.02: BOS level and key decision point.
— $152.50–150.00: Gamma magnet and thin volume shelf — likely destination if price breaks.
— $149.00: HVL zone and major demand.
✅ Thoughts and Game Plan:
NVDA looks vulnerable to a fade if bulls fail to reclaim $158 early in the session. It has rallied sharply the past week and is now stalling beneath gamma resistance. The CHoCH under trendline shows supply defending. If Monday opens flat or slightly weak and price stays under $157.50, I expect bears to press it toward $152.50 quickly, maybe even $149 by midweek.
But if buyers step up and push a reclaim above $158.71, the next gamma wall is at $160–$165 — that’s where a breakout can accelerate. In that case, the IV being cheap favors buying calls.
Be patient and don’t front-run Monday open. Let price confirm. The best edge here comes from reacting to the key levels — not guessing them.
Disclaimer:
This analysis is for educational purposes only and is not financial advice. Always do your own research, trade your plan, and manage risk accordingly.
Long Probably!Hello All. because of No Pre-Cluster, market will reverse on the Node on versa Cluster. be happy(wink)
NVDA GEX Zones + Price Setup: Big Move Loading? Jun 24
🔍 Market Structure Overview (15m + 1h Combo)
* NVDA showed bullish BOS and CHoCH structure earlier today, reclaiming mid-range after tapping demand.
* The current CHoCH (purple box) is forming just under the $145 rejection area.
* A strong bounce off the green OB demand box around 142.00–142.04, holding this zone keeps upside potential alive.
* The upward trendline still valid unless we break under the green demand zone.
📊 GEX + Options Sentiment (1H Chart)
* Highest Net GEX / Call Resistance: $147 — strong resistance area.
* Second Call Wall: $148
* Gamma Wall Confluence: $146.20–147 zone –> expect rejection or a squeeze trigger.
* Put Walls: 140 / 139 / 138 — stacked gamma support.
* IVX avg: 37.4 (low volatility), IVR: 0.4 → cheap premium environment.
* CALL bias: 7.2%, 3 Green Dots = Bullish Bias w/ room to run.
🧠 Smart Money Concepts (15m)
* BOS to upside already confirmed.
* New CHoCH forming within a micro consolidation zone between $144–$145.
* Price is currently dancing around mid-supply zone.
* Liquidity still resting above 146.20, creating fuel if breakout sustains.
📌 Trade Scenarios
Bullish Case:
* Trigger: Break and hold above 145.00
* Target 1: $146.20 (first resistance)
* Target 2: $147–$148 (Call Wall + Net GEX)
* Invalidation: Break below 143.00
* Optional Call entry: Above 145, SL below 143.80
Bearish Case:
* Trigger: Rejection at $145 + CHoCH breakdown confirmation
* Target 1: $142.00 (Demand OB)
* Target 2: $140 (PUT Wall)
* Put entry: below $143.50, with volume surge and failed retest of 144
🎯 Final Thoughts:
NVDA is building energy in a tight CHoCH range. A push above $145 opens the gate to a gamma squeeze into $147+. Watch the reaction at 144.78 and 145 zone closely — it’s make or break. Under 143.00 and this flips bearish fast.
This analysis is for educational purposes only and does not constitute financial advice. Always do your own research and manage your risk before trading.
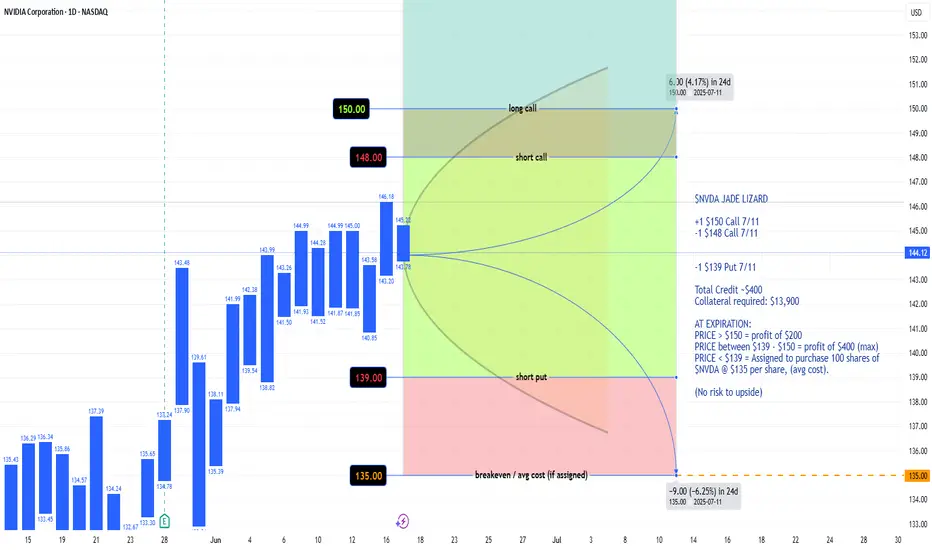
$NVDA JADE LIZARD 7/11 expirationNASDAQ:NVDA JADE LIZARD
+1 $150 Call 7/11
-1 $148 Call 7/11
-1 $139 Put 7/11
Total Credit ~$400
Collateral required: $13,900
AT EXPIRATION:
PRICE > $150 = profit of $200
PRICE between $139 - $150 = profit of $400 (max)
PRICE < $139 = Assigned to purchase 100 shares of NASDAQ:NVDA @ $135 per share, (avg cost).
(No risk to upside)
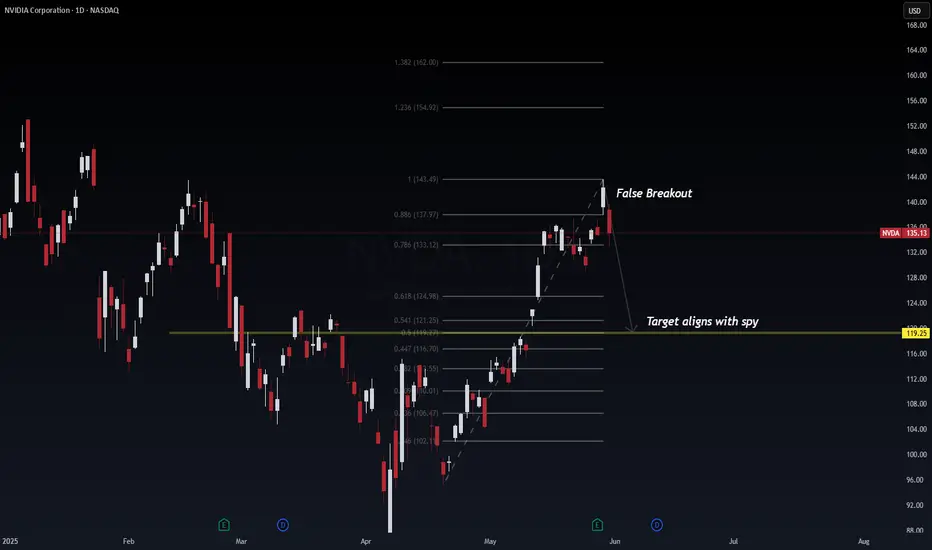
NVDA (NVIDIA) False Breakout and Synchronized Pullback with SPYNVDA printed what appears to be a false breakout at the 1.0 Fib extension level ($143.49), now reversing sharply — potentially aligning with SPY's projected retracement. This presents a high-probability mean reversion setup.
📉 Technical Breakdown
Current Price: $135.13
False Breakout Zone: 1.0 Fib extension ($143.49)
Key Breakdown Zone: 0.786 Fib ($133.12)
Probable Retest Zones:
0.618 Fib: $124.98
0.5 Fib: $121.25
Target: $119.25 (confluence with SPY's demand zone)
🔍 Probabilistic Trade Outlook
⚠️ False breakout + bearish engulfing = 80% probability of continued downside.
📉 Targeting $119.25 = 65% probability as it aligns with institutional levels and SPY’s projected retrace.
💡 Volume and momentum suggest profit-taking and supply absorption.
🌐 Macro Context (May 31, 2025)
AI bubble cooling: Rotation from AI mega caps into broader market value plays.
SPY & NVDA correlation: NVDA typically leads tech-heavy indices — the confluence here could signal broader market pullback.
Fed Policy Uncertainty: No rate cut priced in for June; July will be key.
🧠 Institutional View
This setup echoes the "buy-side trap" — liquidity engineered above previous highs, now reversing to collect resting orders below. This is textbook Smart Money Concepts (SMC) in play.
🧭 Trade Setup
Entry: On confirmed breakdown below 0.786 ($133.12)
Target: $119.25
Stop: $143.60 (above fakeout zone)
Optional Re-entry: Near 0.618 ($124.98) on confirmation
📌 If NVDA hits the $119–121 zone in confluence with SPY’s bounce region, a high-R:R reversal trade may follow.
#NVDA #FibonacciLevels #SmartMoney #LiquiditySweep #TechStocks #MarketReversal #AIStocks #TradingView #WaverVanir
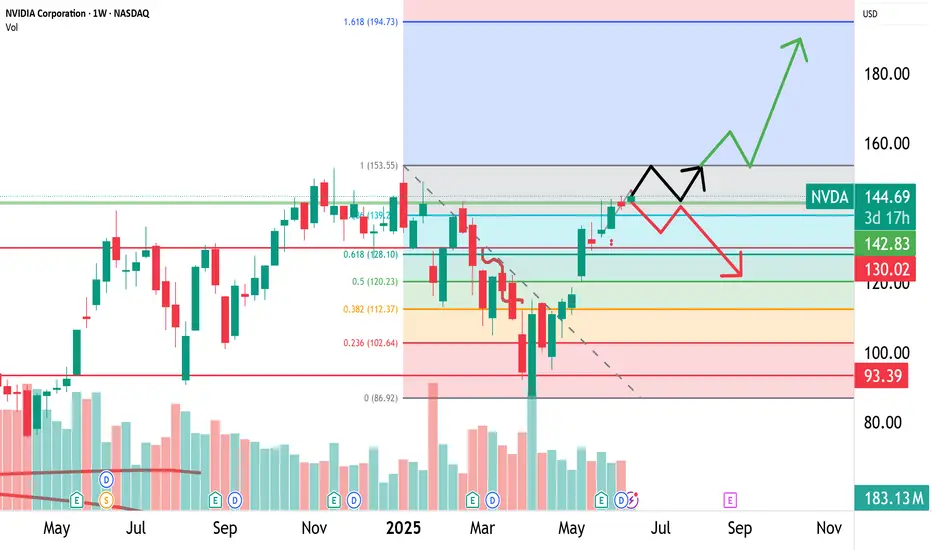
How many times we need to get 1000%+ on this? Here's 3 more...NASDAQ:NVDA
We are currently trading above a significant Fibonacci retracement level of $143. We want to see price consolidate above $145, where we will target $194-$200 next. There are several ways to trade this from here.
* Short-term range from $145 to $150
* Breakout momentum trade over $153 targeting $193
* Long-term range between $103 to $140