NVDA trade ideas
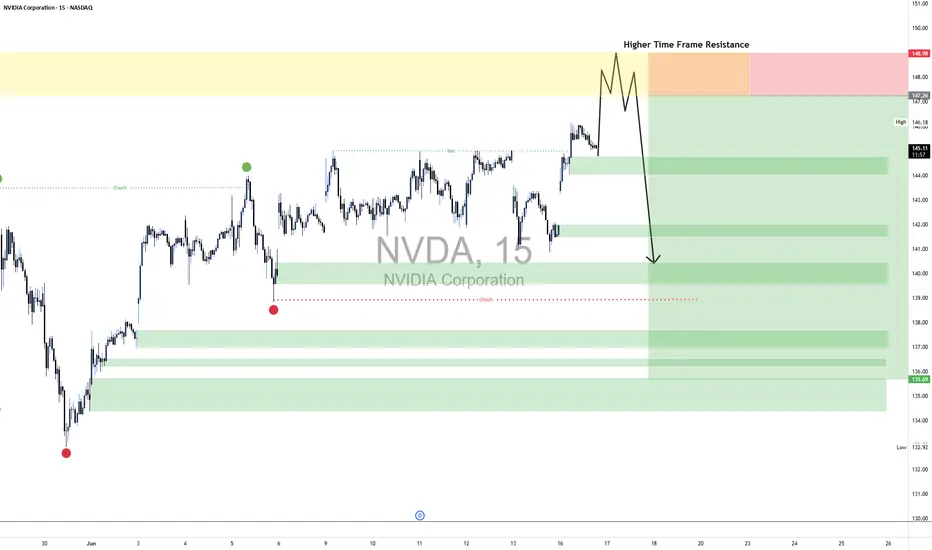
NVDA 15mins Short Market Context:
After a corrective decline, NVDA is showing temporary bullish momentum, forming higher lows on the lower timeframes. However, the overall structure remains bearish-biased, and this upside is likely part of a liquidity run rather than a genuine reversal.
Liquidity Magnet at $149
There is resting liquidity above recent highs near $149, a zone where retail buy stops are likely positioned.
Smart Money typically pushes price into such highs to induce late longs and liquidate early shorts before a major move.
Momentum Shift Already in Progress
The current bullish move lacks aggressive expansion — it's showing divergent momentum and weaker impulse candles compared to the prior leg down.
This signals the upside may terminate as a liquidity hunt, not trend continuation.
Structural Setup for the Short
Once price taps $149, observe for a sharp rejection or breakdown of internal short-term structure (i.e., break of a local low with displacement).
This signals the smart money exit and bearish intent.
The shift from engineered buy-side pressure into sell-side delivery confirms short bias.
I expect NVDA to run higher into $149 to sweep liquidity, then break down sharply toward $135. I will look for internal bearish structure to form right after the sweep and will short only upon confirmation of intent (displacement and lower low).
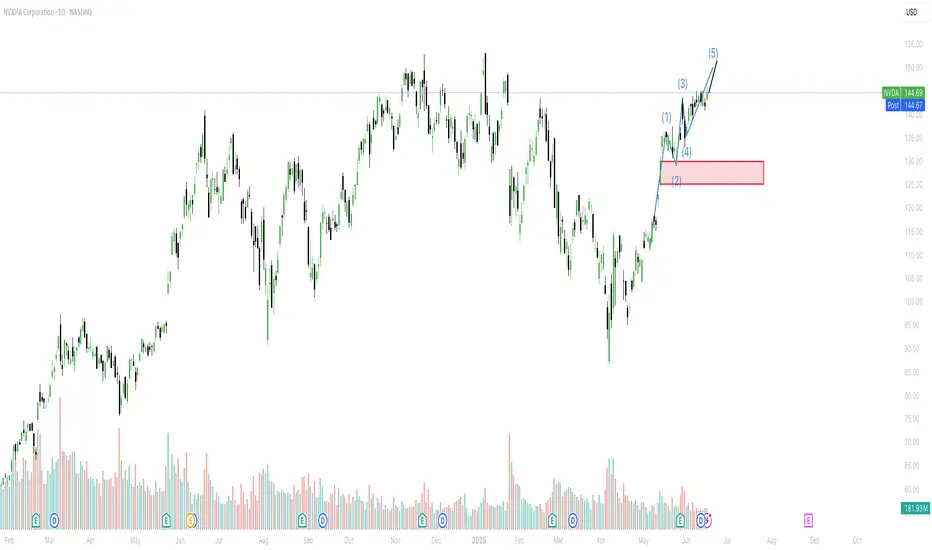
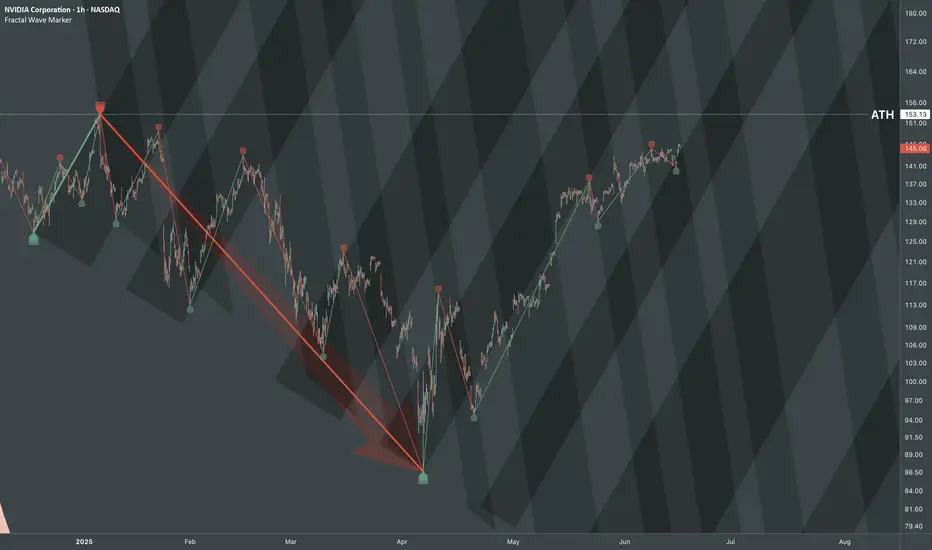
NVDA: Fractal Wave BreakdownBreaking above Rounding Top Pattern after rejections.
Wave transformed from pullback to impulsive one, which implies that the emerging structure needs to be routed to relative cycle.
Waveform
Referral structure looks like compressed version of decline after ATH.
As if the movement of big magnitude that pierces through SL levels, causes "shockwaves" that resets frequency of reversals of forthcoming waves.
Fibonacci interconnection of ATH and Bottom
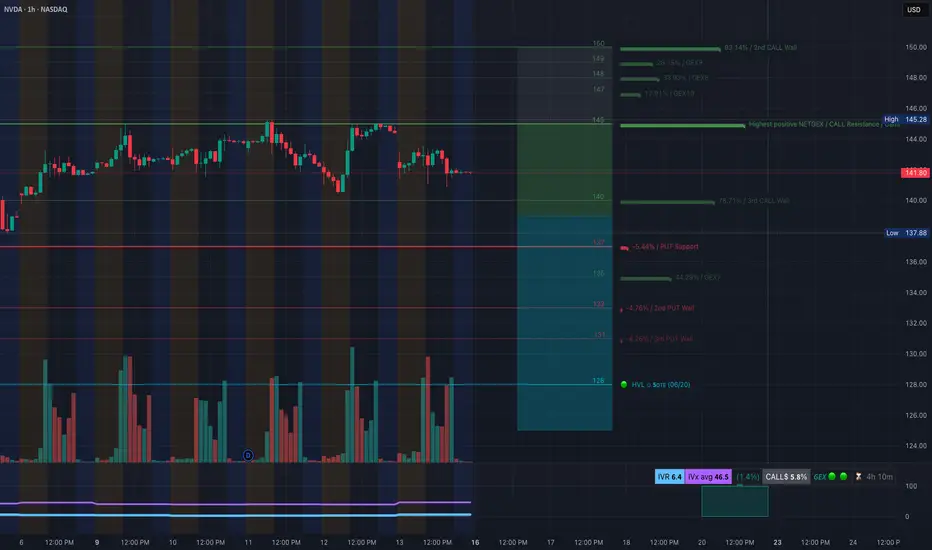
NVDA: Options GEX & Technical Setup for Jun 161️⃣ Options Gamma Insights
* Strongest gamma resistance sits in the 140–145 zone, with a hefty 3rd CALL wall (~79%) and consistent NETGEX/Call shelf near 145.
* IV is ultra low (~6.4 vs avg 46.5), meaning traders benefit from moves more than decay—especially as price nears gamma protection levels.
* GEX exposes (call $5.8 put $94) show mild call skew, favoring small upside tilt.
* Trade idea: Look to buy short-dated (~5DTE) calls or a call spread below 140–142, targeting fade/exercise pressure at 145; or consider put protection if NVDA breaks below 140 with bearish momentum.
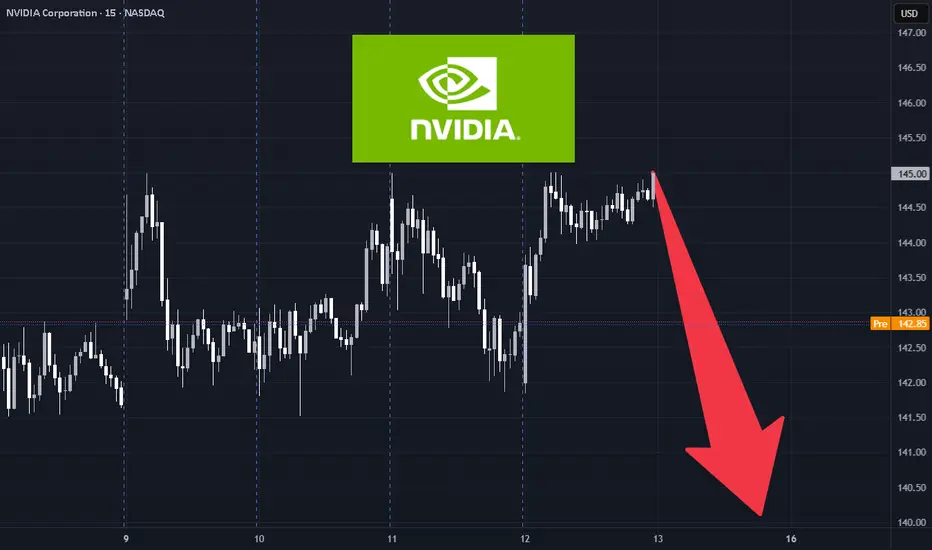
2️⃣ 15-Minute Chart Analysis
* Price anchored near top of short-term consolidation range (140–145), after breaking below previous range high. Structure shows lower lows & lower highs → bearish tilt.
* Resistance: 142–145 overhead zone.
* Support: Near 140 (stop level), followed by 137 and previous BOS at ~140.86.
* Trend direction: Downward pullback within afternoon range.
3️⃣ Trade Setup Suggestion
* Bias: Bearish if price fails to reclaim above 142–145 gamma region. Bullish only on reclaim + clear BOS structure.
* Options plays:
* Buy 5DTE–10DTE put spread below 140, targeting 137–135 with tight risk.
* Alternatively, buy call spread if price breaks and holds above 145 with volume.
* Stops & Sizing: Risk 1–2% per trade; place stop-loss just outside your entry trigger zone.
🧠 My thoughts?
* Gamma alignment: Gamma walls act as structural support/resistance—145 is reinforced by call wall.
* Low IV: Minimizes premium decay and makes directional moves more profitable.
* Chart context: Lower-highs structure gives bearish edge; bearish setup aligns with downside call-to-put skew.
🚨 Disclaimer
This is not financial advice. All trades carry risk. Manage position size carefully and be aware that options are risk assets—especially with low IV.
Expiration Dates for Options using Fibonacci Time ZoneThis is a way I use the Fibonacci Time Zone; it naturally leans into a balance of Gamma and Theta Decay. Choosing the right strike zone is up to your strategy. I prefer Covered Calls, Debit Spreads and Iron Condors for this strategy. Puts are fair game too. If you choose to roll something over, most recoveries occur after a month and a half after a 10% SPY drop off.

NVDA bearish rising wedge for right shoulder (the bear thesis)It looks like we’re just shy of a breakout confirmation this rising wedge which in itself might be only a right shoulder of head and shoulders top. Time will tell if this setup plays out or gets canceled out.
NVDA Swing Trade – Overbought Reversal Setup (June 12, 2025)📉 NVDA Swing Trade – Overbought Reversal Setup (June 12, 2025)
Ticker: NASDAQ:NVDA | Bias: 🔻 Moderately Bearish
Strategy: Short-Term Swing | Timeframe: ~2 weeks
Confidence: 75% | Entry Timing: Market Open
Expiry: June 27, 2025
🔍 Market & Technical Snapshot
• Price: ~$144.67
• Trend: Weekly and M15 uptrend still intact
• RSI (Daily): ~70.63 → Overbought
• MACD: Bearish crossover on Daily
• Options Data:
– Heavy put OI at $140 (14,803 contracts)
– Max pain at $135 → potential pull lower
– High call OI at $145–$150 caps upside
🧠 AI Model Breakdown
🔼 Grok/xAI (Bullish Swing):
• Calls out strong technicals, 5-min momentum
• Suggests $155C for upside play
🔽 DeepSeek (Bearish Swing – Preferred):
• Overbought daily RSI + bearish MACD
• Strong put volume + options market pressure
• Targets pullback to $138–$140 → PUT @ $140
✅ Recommended Trade Setup
🎯 Direction: PUT
📍 Strike: $140
📅 Expiry: 2025-06-27
💵 Entry Price: $2.09
🎯 Profit Target: $3.10 (+48%)
🛑 Stop Loss: $1.25 (–40%)
📈 Confidence: 75%
📏 Size: 1 contract
⏰ Entry Timing: Market Open
⚠️ Risk Considerations
• Weekly chart still bullish → risk of trend continuation
• Low VIX (17.26) = slower option premium movement
• Positive news surprise could cause upside gap
• Use tight risk controls and monitor intraday structure
💭 NASDAQ:NVDA : Extended or just gearing up for another breakout?
📉 Drop your play below — Put buyers vs. breakout chasers 👇
NVIDIA (NVDA) investors should knowHello NVIDIA (NVDA) investors,
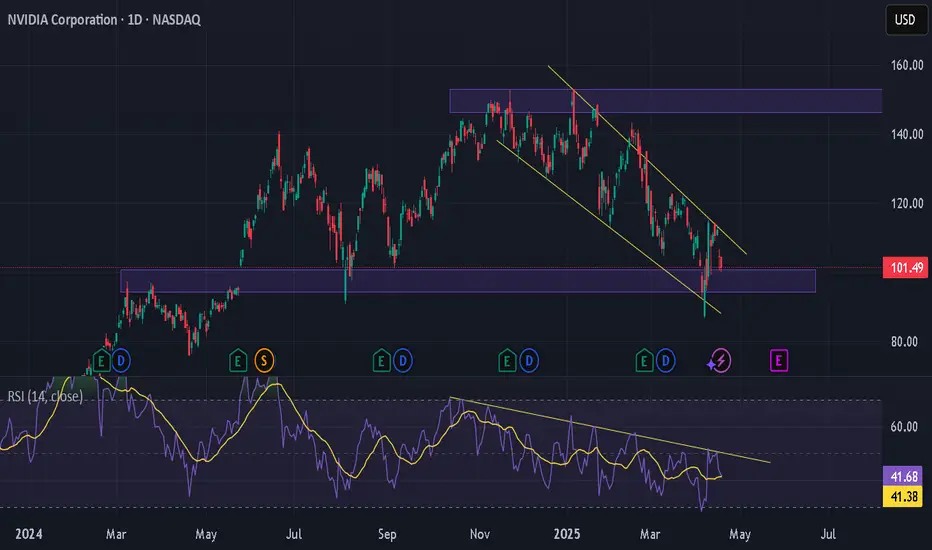
Looking at the daily chart below, we see that NVDA briefly broke out of its long‑standing yellow descending channel only to be pulled back in; price is now testing horizontal support in the $100–150 range. In the lower pane, RSI remains negative and has yet to break its downtrend line around the 41 level.
Technical Analysis
Descending Channel:
The stock has been trading inside a long‑term descending channel. Selling pushed it back inside after a false breakout near $137–142. The upper channel line sits around $115—until we see a daily close above that, a true trend reversal is unlikely.
Horizontal Support/Resistance:
Support: $95-100 (confluence of past lows and the channel’s lower boundary)
Resistance: $147-150 (channel upper line), then $145–150 (early‑April highs)
RSI:
Currently ~41. A break above the RSI downtrend near 45–50 would signal improving momentum; if it fails, we could retest oversold territory.
Fundamental & Macro Factors
Quarterly Results:
NVDA reported strong revenue and margin growth last quarter, driven primarily by AI/data‑center demand.
AI & Data‑Center Demand:
Demand from AI‑focused servers and cloud providers remains very high, and this secular trend is expected to persist.
Trump’s Latest Tariffs:
In early March 2025, an additional %145 tariff on China‑origin semiconductors was announced. This measure may raise NVDA’s export costs to China and exert short‑term margin pressure. It also risks demand swings as Chinese buyers adjust their inventory strategies.
Strategic Recommendations
Stop‑Loss:
Consider a stop‑loss on daily closes below $90 to protect long positions.
Position Sizing:
Scale into longs near support, and take profits incrementally near resistance.
Tariff Watch:
Monitor any further U.S. export restrictions or tariff changes on China—each announcement can drive volatility
-Celil Adıgüzel
Nvidia - The breakout will eventually follow!Nvidia - NASDAQ:NVDA - will break out soon:
(click chart above to see the in depth analysis👆🏻)
Over the course of the past couple of days, we saw a quite strong rally of +50% on Nvidia. Considering the market cap of this company, such a move is quite impressive. Following this overall very strong bullish momentum, an all time high breakout is quite likely to happen soon.
Levels to watch: $150
Keep your long term vision!
Philip (BasicTrading)

NVIDIA stock : (Inverted H&S) We are confirmed bullish📈 NVIDIA Stock Analysis: Bullish Reversal Ahead! 🚀
🔍 Overview:
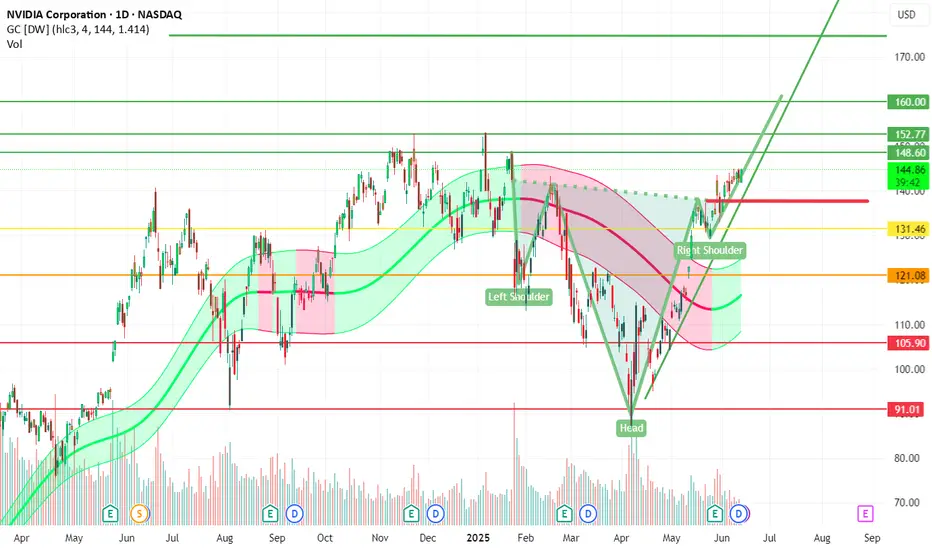
Today, we’re analyzing NVIDIA's stock chart, which presents a powerful inverse head and shoulders pattern—a classic bullish reversal signal!
🛠 Key Components of the Pattern:
- 🫳 Left Shoulder: Formed after a downtrend.
- 🧠 Head: The lowest point, indicating strong support.
- 🫴 Right Shoulder: Shows buyers stepping in, confirming momentum shift.
- 📏 Neckline Breakout: If price crosses this resistance level with volume, we expect an upward movement!
📊 Technical Details:
- 📉 Current Price: $144.78
- 🔝 Resistance Levels: $160.00, $152.77, $148.60
- 📉 Support Levels: $131.46, $121.08, $110.00
- 📢 Volume: 125.83M, validating market sentiment.
📈 Expected Market Behavior:
If NVIDIA maintains momentum above the neckline, traders could anticipate further price appreciation 💰✨. Strong volume will confirm the trend, making it an attractive opportunity!
🧐 Final Takeaway:
This bullish pattern suggests that investors might consider strategic entries 📊💡. Whether holding or entering positions, keeping an eye on market reaction & volume is key!
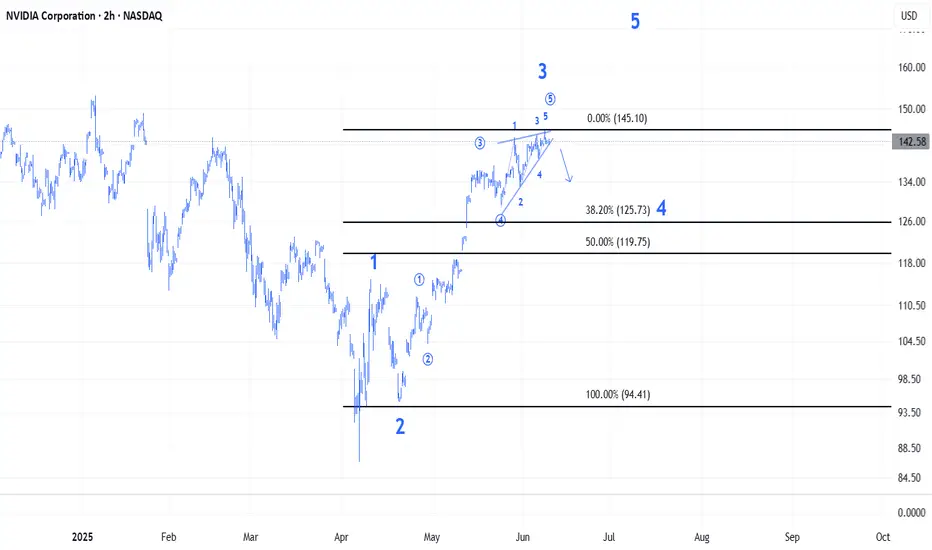
NVDA Daily 12th JuneI draw Fibonacci retracement and specified Fib Golden Zone. I believe that the price may drop to 38% Fib level, after which it will be ready to move towards the TPs.

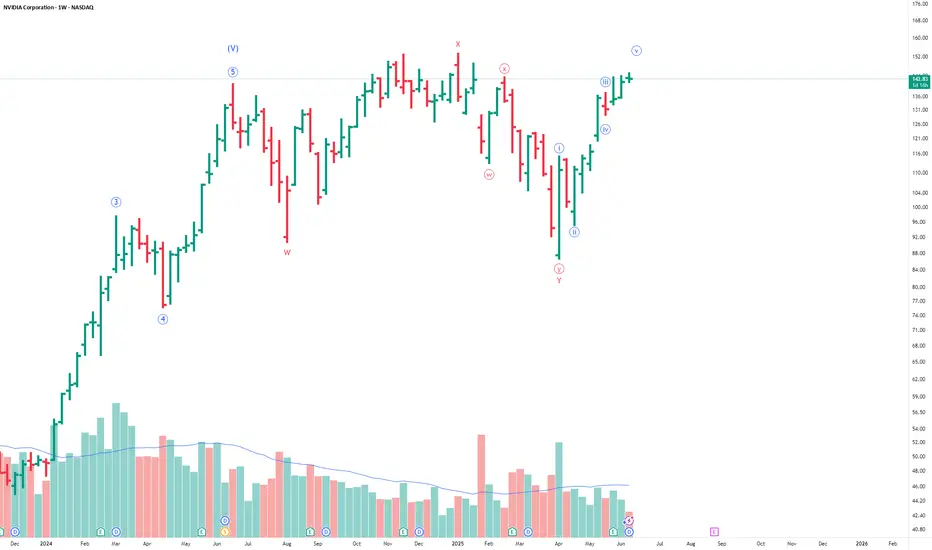
AI Chip Stocks NVDA and AMD Showing 5 Wave RiseNASDAQ:NVDA and NASDAQ:AMD are both showing 5 wave rise in weekly chart after a correction in WXY. I haven't checked but other AI related stocks also might be doing something similar.
Once the 5 waves are over, we can expect some correction but the 5-wave rise post a correction typically signals fresh uptrend so it might be worth keeping an eye on these stocks. Waiting till retracement/correction of this rise is complete.
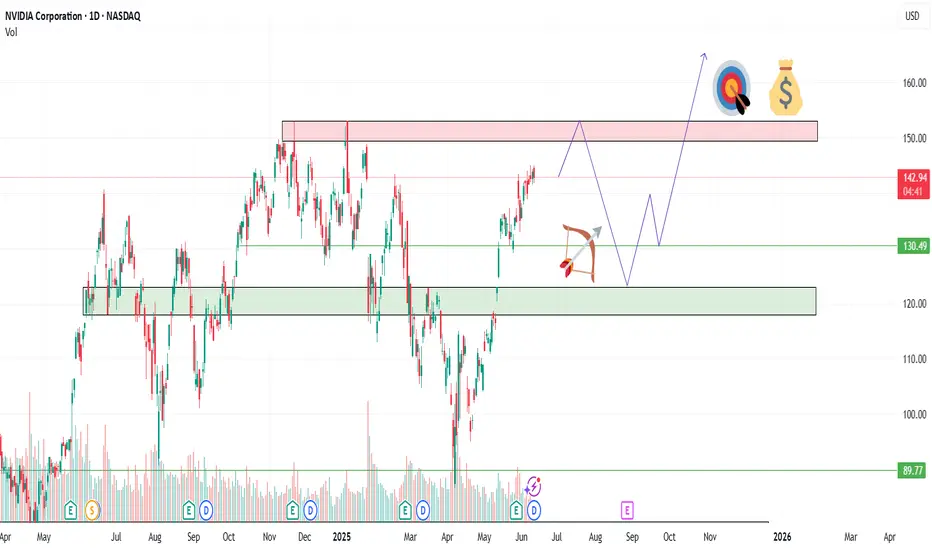
Is NVDA Building Strength Before a Breakout?After cooling off from its $150 highs, NVIDIA (NVDA) is consolidating in the $140–$145 zone. While some traders fear the AI hype has peaked, others see this as the calm before another rally. With solid fundamentals, continued leadership in AI, and strong institutional backing, NVDA remains a name to watch closely.
🎯 Trade Setup:
Entry Points
✅ $142 – Current price zone (speculative buy)
✅ $135–$130 – Strong support (ideal swing entry)
✅ $125 (only if market-wide pullback occurs)
Profit Targets
📈 TP1: $149 – All-time high retest
🚀 TP2: $160 – Extension target
💰 TP3: $175+ – Long-term bullish scenario if momentum returns
💡 Strategy: This is a “buy-the-dip, trade-the-breakout” setup. Wait for confirmation above $146 if you're conservative, or accumulate gradually into weakness with a clear risk plan.
📌 Disclaimer: This is not financial advice. Always do your own research and use proper risk management. I'm sharing my personal view for educational purposes.
NVDA 145+?If Nvda break and hold 145 then 146 , 147 , 149 and HOY. Inv H&S on the hourly. My opinion only.

How to see other users positions on an asset - Long vs Short Want a quick way to be able to see what others are thinking about an asset - whether they are long or short - and perhaps even which users are making the best calls?
TradingView has it built in with a couple of button clicks :)

NVDA $148 VS $139 NVDA competing at the moment with bullish momentum dominating. am looking for rebound tomorrow from where it is to determine after ORB if price will head to next key level at $148 where previous buy and sell orders were withheld. If price fails to utilize this key level at $143 you can expect a quick cash grab for $139 with continuation to my level imbalance of $131 as mentioned before. Both key levels will be retested at some point. But for now, looking up with the trend.

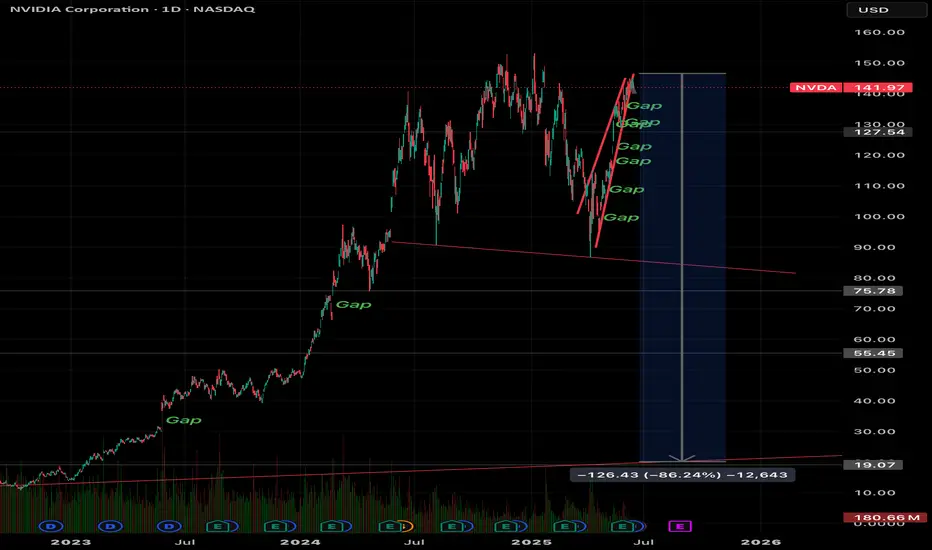
BUY NVDABUY NVDA at 108.00 to 99.00, riding it back up to 142.00 to 151.00 as Profit Targets, Stop Loss is at 86.00!
If anyone likes mumbo jumbo long garbage analysis, than this is NOT for you.
Also, if you are afraid of risk, failure, and want only a 100% sure thing, than
run as fast as you can from the markets, because it is definitely NOT for you.
WARNING: This is just my opinion of the market and its only for journaling purpose. This information and any publication here are NOT meant to be, and do NOT constitute, financial, investment, trading, or other types of advice or recommendations. Trading any market instrument is a RISKY business, so do your own due diligence, and trade at your own risk. You can loose all of your money and much more.

NVDA SELLSELL NVDA at 149.00 to 163.00, riding it back down to 93.00 to 77.00 as Profit Targets, Stop Loss is at 172.00!
If anyone likes long mumbo jumbo garbage analysis, than this is NOT for you.
Also, if you are afraid of risk, failure, and want only a 100% sure thing, than
run as fast as you can from the markets, because the markets are NOT a sure thing,
so it is definitely NOT for you.
WARNING: This is just my opinions of the market and its only for journaling purpose. This information and any publication here are NOT meant to be, and do NOT constitute, financial, investment, trading, or other types of advice or recommendations. Trading any market instrument is a RISKY business, so do your own due diligence, and trade at your own risk. You can loose all of your money and much more.
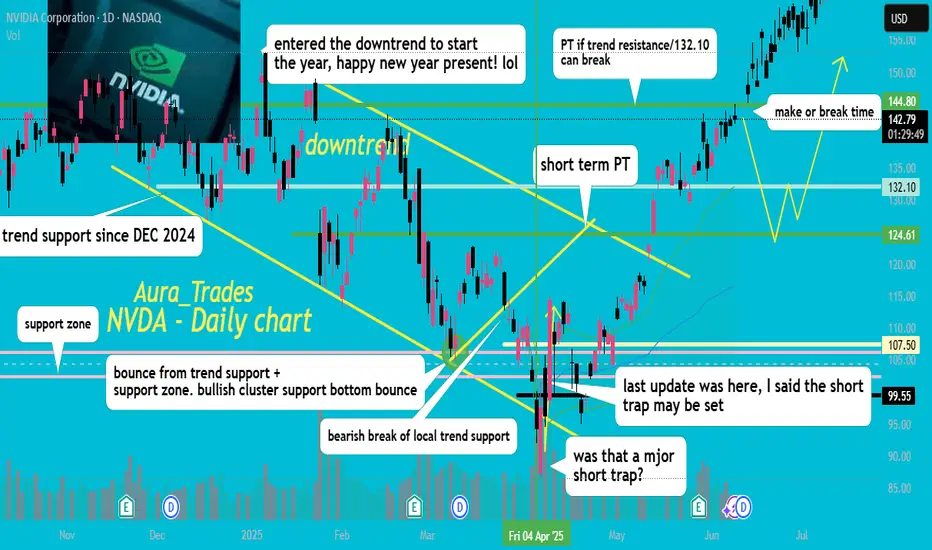
keep an eye on 144.80 !boost and follow for more!💖
NVDA is hitting my bullish targets a mentioned in my last update from early April🎯, now watching my final short term price target of 144.80, if this can break and hold this week then a rally to new ATH/175-200 should follow.
if we reject here then a dip to 124-132 should come before the upside continues.
NVDA ThoughtsThis is not financial advice just my charting on NVDA maybe in correct just learning and sharing thoughts. If you ca help or see some thins i can include plz comment below here to learn
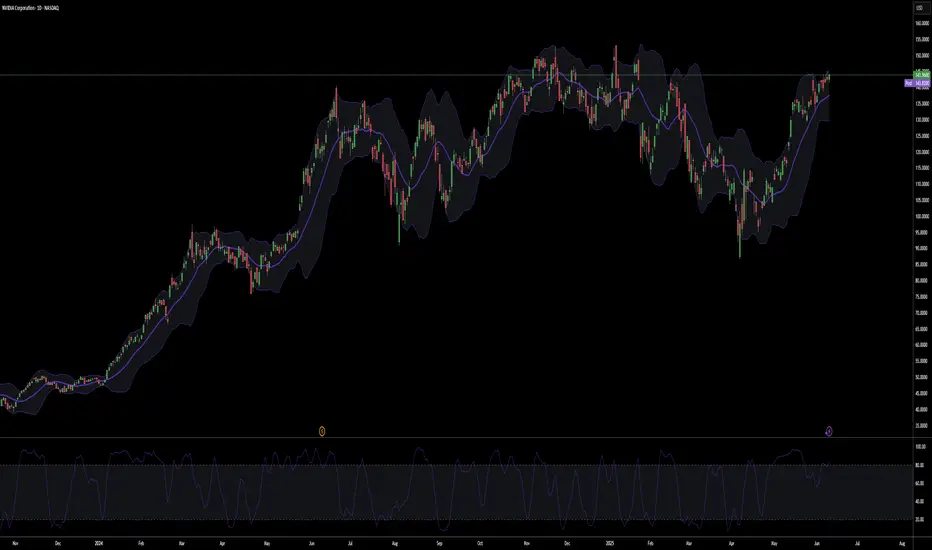
$NVDASame thing as $AMD. Daily bands are very tight. NASDAQ:NVDA Leading the market today 2.07% with AMEX:SPY breakeven 0.06%. China & US meeting today.

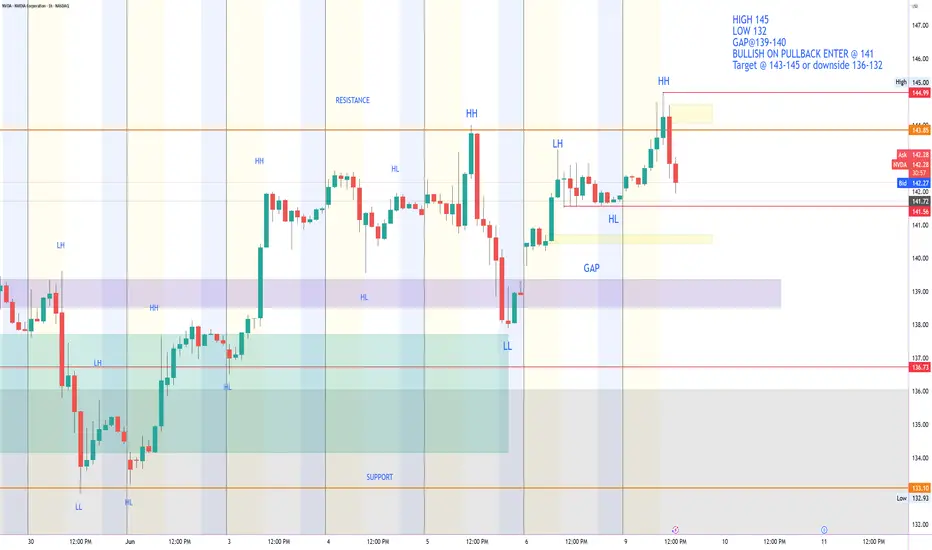
NVDA Support and Resistance Lines Valid from June 1 to 30Overview:
These purple lines act as Support and resistance lines when the price moves into these lines from the bottom or the top direction. Based on the direction of the price movement one can take long or short entries.
Trading Timeframes
I usually use 30min candlesticks to swing trade options by holding 2-3 days max. Anyone can also use 3hr or 4hrs to do 2 weeks max swing trades for massive up or down movements.
I post these 1st week of every month and are valid till the end of the month.
