TLSA Catalyst Ranking and Market Update: June 2025Here's an updated/revised outlook for TSLA including all the primary
catalyst ranking and analyst ratings and overview of latest developments
🔋 1. EV Demand Growth
Strength: 9/10 → 9/10
Global electric vehicle adoption remains the dominant pillar. Tesla faces softer comp in Europe (–40.5% drop in May) wsj.com, but overall trend remains firmly upward. 🌍
🚗 2. Affordable Entry Level Model
Strength: 8.5/10 → 8.5/10
Tesla still on track to launch a < $25K EV in first half of 2025. Any delays or execution issues could pressure sentiment.
⚡ 3. Battery Cost & Margin Improvement
Strength: 8/10 → 8/10
Margins saw slight relief Q1, driven by cost cuts f, but macro headwinds persist.
🤖 4. Autonomy & Robotaxi Rollout
Strength: 7.5/10 → 8.5/10
Robotaxi debuted in Austin in June, sparking a ~10% one-day stock surge. Benchmark raised its target to $475/buy on the rollout—strong tailwind.
🚩 5. Competition
Strength: 7/10 → 6.5/10
Rivals like Xiaomi’s new YU7 are gaining ground. Tesla must maintain differentiation.
📉 6. Trade Policies & Tariffs
Strength: 6.5/10 → 6.5/10
Still relevant due to Tesla’s global footprint, though less front-page than before.
💰 7. Incentives & Subsidies
Strength: 6/10 → 6/10
U.S. IRA tax credit policies remain supportive; evolving eligibility remains a swing factor.
🛢️ 8. Commodity Costs
Strength: 5.5/10 → 5.5/10
Raw-material swings affect margins. Inventory hedges help but not wholly mitigate.
📈 9. Fed & Interest Rates
Strength: 5/10 → 5/10
A higher-rate environment still limits valuation multiples for growth-tier companies.
🎭 10. Musk Profile & Governance
Strength: 4/10 → 5/10
Analysts (e.g., Bradley Tusk) warn of being “massively overvalued” tied to Musk’s persona. Musk’s renewed focus on Tesla vs. other ventures (DOGE, SpaceX) will be watched.
________________________________________
🚀 Refreshed Catalyst Rankings
Rank Driver Score
1 EV demand growth 9
2 Affordable model 8.5
3 Battery costs/margins 8
4 Autonomy/robotaxi execution 8.5
5 Competition 6.5
6 Trade & tariffs 6.5
7 Regulatory incentives 6
8 Commodities 5.5
9 Fed Rates 5
10 Musk reputation/governance 5
________________________________________
📊 Latest Analyst Ratings & Targets
• Benchmark / Mickey Legg: Buy, target $475 (from $350) — cites robotaxi safety-first rollout, automation upside
• Wedbush / Dan Ives: Outperform, target $500 — labels TSLA as an “embodied AI compounder”
• Morgan Stanley / Adam Jonas: Buy, target $410 — bullish on AI/self driving positioning
• Cantor Fitzgerald / Andres Sheppard: Overweight, target $355 — optimism rooted in robotaxi and FSD rollout
• UBS / multiple: Sell, target $215–225 — skeptical on demand and valuations
Consensus snapshot (FactSet):
• Mean price target ≈ $311–$312
• Mean rating between Hold–Buy (~2.7/5)
________________________________________
🗞️ Recent Headlines
• “Tesla completes first fully autonomous Model Y delivery ahead of schedule”
• “Tesla robotaxis launch in Austin” boosting momentum
• “EU Tesla sales slump” May registrations down 40.5%
• “Tesla fires longtime insider as Europe slump deepens”
________________________________________
🔍 Summary Outlook
Tesla shares are navigating a volatile interplay of strong tech promise and unfolding execution risks:
• Overweight view (Legg, Ives): Robotaxi rollout and AI thrust fuel upside. Automation transition seen as transformative.
• Bullish base (Jonas, Sheppard): AI, FSD rollout, affordable model support core thesis.
• Skeptical view (UBS, Tusk): Slumping deliveries in Europe/China, heavy valuation, Musk's external focus seen as emotional dampener.
Upcoming triggers to watch:
1. Q2 delivery and production results (mid July).
2. Robotaxi rollout execution/regulatory clearance.
3. Margin trajectory as costs evolve.
4. FSD reliability and expansion in new markets.
________________________________________
✅ What This Means for You
• Bull case: Robotaxi + AI momentum may drive TSLA back toward targets in the $475–500 range.
• Bear case: Weak deliveries, macro and competition pressures could cap shares or trigger pullback toward prior support ($330–350).
• Neutral: Watch near-term delivery and autonomy news to shape next move.
TSLA trade ideas

TSLA PRICE ACTION JUNE 25 2025This is the price action for Tesla. I have discussed all the levels. I have given a trade today & have discussed it thoroughly.
If you have any doubts, then feel free to Dm me or leave a comment below
NOTE:DO NOT BUY CALLS

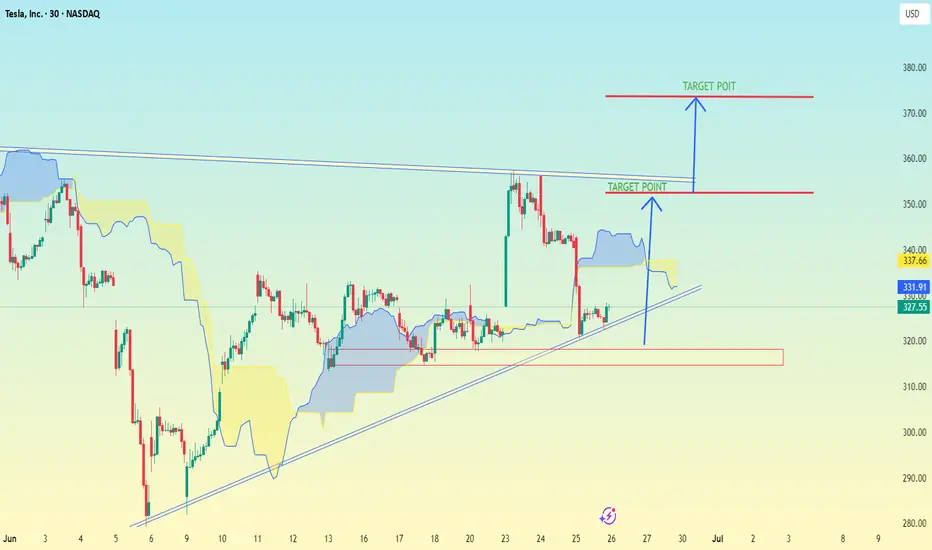
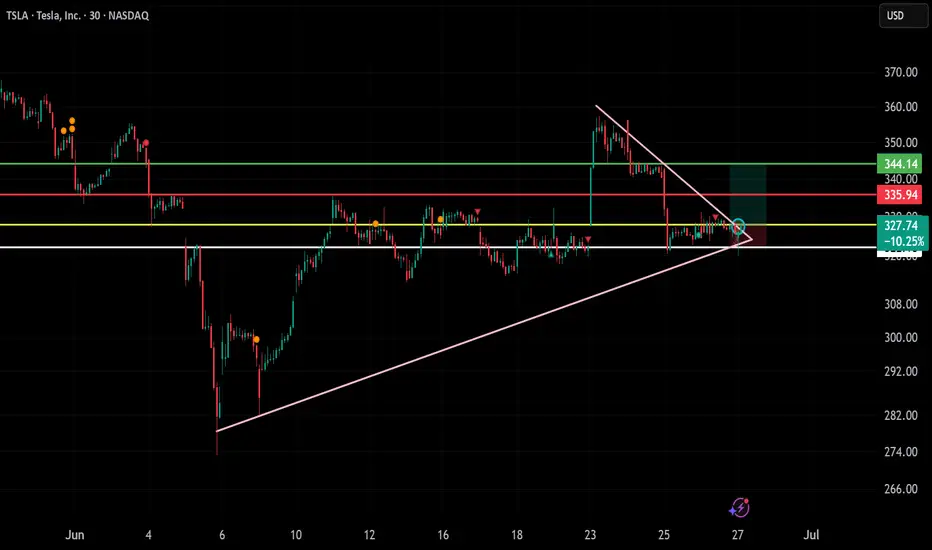
TESLA..(TSLA) 30M TIME FRAME..Tesla (TSLA) on a 30-minute timeframe using Ichimoku Cloud along with trendlines and breakout levels.
There are two target levels indicated:
---
🔵 Immediate Target Point (Breakout Target):
Price Level: ~$350
This seems to be the first breakout target if price breaks above the current resistance zone.
Based on the measured move from the ascending triangle or trendline breakout.
---
🔵 Extended Target Point (Full Target):
Price Level: ~$375–$380
This is the higher target possibly based on a full breakout move from the bottom of the triangle pattern to the top projection.
---
🟢 Current Price: ~$327.55 (at the time of the screenshot)
🧠 Suggested Trade Plan (if you’re trading this setup):
Entry: Above breakout level (possibly ~$335–$340)
First TP: $350
Second TP: $375–$380
Stop Loss: Below trendline or recent support (~$320 or slightly lower)
Let me know if you want a risk-reward analysis or SL/TP calculator based on your entry.
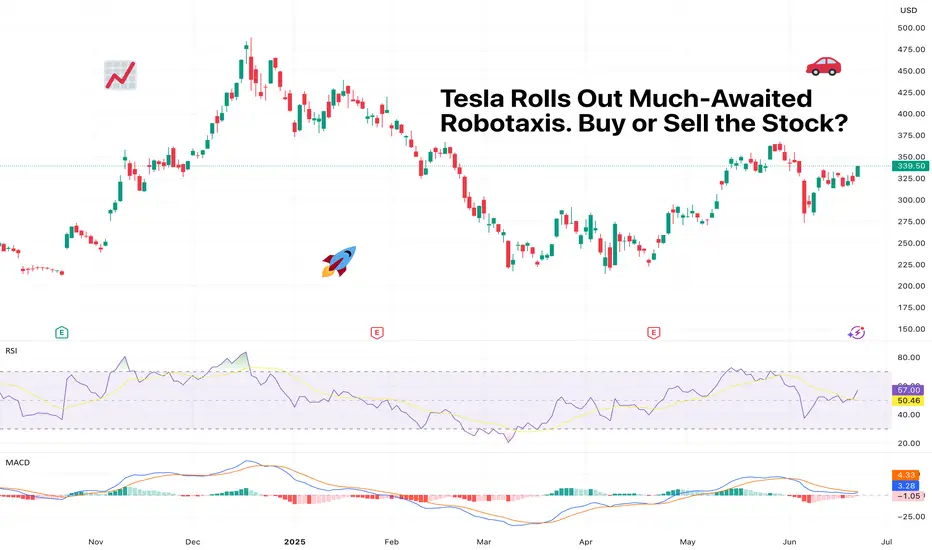
Tesla Rolls Out Much-Awaited Robotaxis. Buy or Sell the Stock?They’re here. After years of tweets, teasers, and timelines that aged like unrefrigerated dairy, Tesla NASDAQ:TSLA officially launched its long-awaited robotaxi service in Austin, Texas.
The self-driving revolution, we were told, would arrive like a lightning bolt. Instead, it quietly rolled up to the curb with a safety monitor riding shotgun.
On Sunday, ( as promised ) a small, highly curated fleet of Teslas — fully driverless, but not entirely unsupervised — began picking up paying passengers in an isolated section of Austin. CEO Elon Musk, as usual, led the cheer squad, declaring victory on X.
“Super congratulations to the Tesla AI software and chip design teams on a successful robotaxi launch!! Both the AI chip and software teams were built from scratch within Tesla.”
Investors, naturally, perked up. Tesla shares edged higher by more than 5% Monday morning as Wall Street tried to figure out whether this was the long-awaited catalyst for another rally… or just another “sell-the-news” moment that fizzles as quickly as the hype fades.
🔔 The Soft Launch Heard Around The Internet
Let’s not get carried away. This wasn’t a citywide revolution. Tesla’s launch was extremely limited — more of a PR exercise than a true market rollout. Only a handful of Teslas were involved, operating in a tightly controlled, geofenced area.
The riders? Carefully selected influencers, many of whom were more excited to film TikToks than analyze technical driving capability. In other words, this wasn’t exactly New York City rush-hour stress testing.
The rides cost a flat fee of $4.20, because, of course they did. And while the cars drove themselves, safety monitors sat in the front passenger seats — a very human reminder that the project is still very much in beta mode.
The bigger question for investors: Does this prove Tesla’s technology is ready for prime time? Or is it simply an appetizer served years before the main course?
📈 The Market Reaction: Buy the Rumor, Sell the Launch?
Here’s where things get tricky for traders.
The stock market, as always, is forward-looking. Tesla stock didn’t just wake up bullish on Monday because of a few rides in Austin — it’s been rallying for months because of the promise of robotaxis.
Since Tesla’s big October 10 robotaxi event — where Musk laid out plans to launch a self-driving cab service in 2025 — shares have climbed roughly 35%. Much of that gain is already baked into expectations for Tesla finally delivering on what Musk has been promising since at least 2016.
Now that the product is technically “live,” even in tiny demo form, some traders are wondering: is this the start of an even bigger rally?
The answer probably depends on how fast Tesla can scale. And that’s where reality gets stickier.
🤔 The Scaling Problem: A Long Road Ahead
As exciting as Sunday’s launch may have been for influencers and Tesla superfans, it’s not exactly proof of scalability. Deploying 10 carefully monitored cars in a tiny slice of Austin is one thing; blanketing entire metro areas, or states, or countries is another beast entirely.
Tesla’s AI software may be improving, and its in-house chip design gives it some vertical integration advantages. But scaling fully autonomous fleets will require navigating a minefield of regulatory, safety, and logistical challenges — not to mention stiff competition.
Alphabet’s Waymo is already operating robotaxi services in Phoenix, San Francisco, and Los Angeles, with years of public road testing under its belt. Cruise (General Motors) ran its own driverless service before recently pausing operations after high-profile safety incidents. The technology arms race is fierce — and far from settled.
Industry experts continue to caution that mass-market robotaxis may take years — if not decades — to fully materialize. And while Tesla loves to move fast and break things, cities, regulators, and insurance companies tend to prefer a bit more caution when thousands of driverless vehicles are involved.
📝 What’s Actually Priced Into Tesla Stock?
Here’s where this gets existential for Tesla bulls.
A huge chunk of Tesla’s market valuation — some would argue most of it — now rests on the idea that it isn’t just a car company. It’s an AI company. A software company. A robotics company. A future robotaxi empire. If those narratives start to weaken, so does the multiple.
Tesla remains dominant in EV production and it still benefits from profit margins (about half of the profits coming from selling regulatory credits to other carmakers). But even Musk himself has made clear that Tesla’s long-term valuation depends heavily on successfully delivering robotaxis and humanoid robots.
If Sunday’s soft launch is the start of something truly scalable, then maybe the valuation holds up. If it stalls — either due to regulatory hurdles, technological ceilings, or public skepticism — the market may need to reevaluate just how much of Tesla’s price reflects reality versus dreams.
👀 Bottom Line: Revolutionary or Just Another Test Ride?
So, should you buy or sell Tesla after its long-awaited robotaxi debut?
That depends on how you frame this moment. The bulls see a trillion-dollar industry being born, with Tesla perfectly positioned. The bears see a carefully staged PR event masking how far away true autonomy still is.
For now, Tesla gets credit for being bold — even if it’s bold enough to roll out a very small, very managed test.
But markets eventually ask: “What’s next?” And unless Tesla can quickly scale from 10 cars in Austin to fully functioning fleets in major cities, a victory lap here could feel a little premature.
As always with Tesla: the story is thrilling, the stock is volatile, and the future is still very much under construction.
And with its earnings just around the corner — you’re following the earnings calendar , right? — things might just be getting exciting.
Off to you : Which side are on? The bullish traders looking to add to their long positions or the bearish sellers who’ve been calling “overvalued” for years? Share your thoughts in the comments!
Tesla -> The all time high breakout!🚗Tesla ( NASDAQ:TSLA ) prepares a major breakout:
🔎Analysis summary:
Not long ago Tesla perfectly retested the major support trendline of the ascending triangle pattern. So far we witnessed a nice rejection of about +50%, following the overall uptrend. There is actually a quite high chance that Tesla will eventually create a new all time high breakout.
📝Levels to watch:
$400
🙏🏻#LONGTERMVISION
Philip - Swing Trader

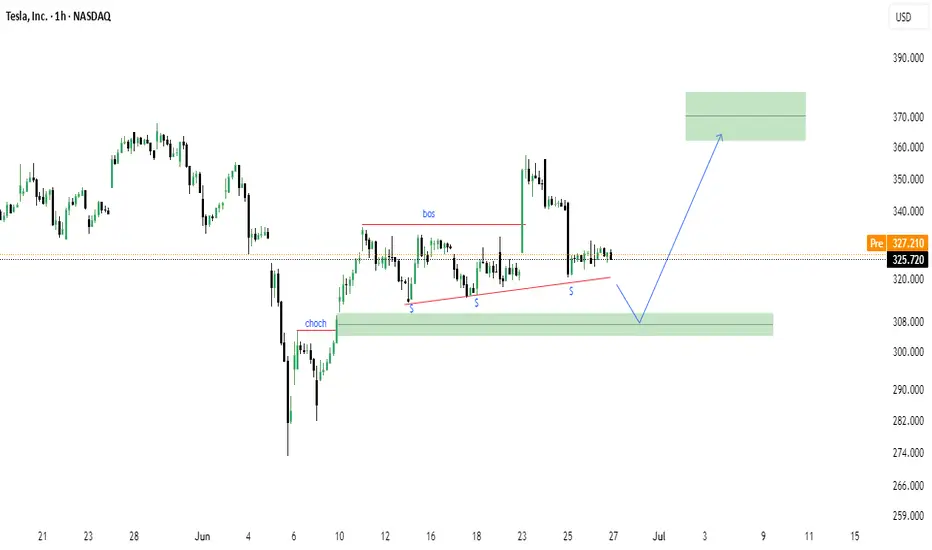
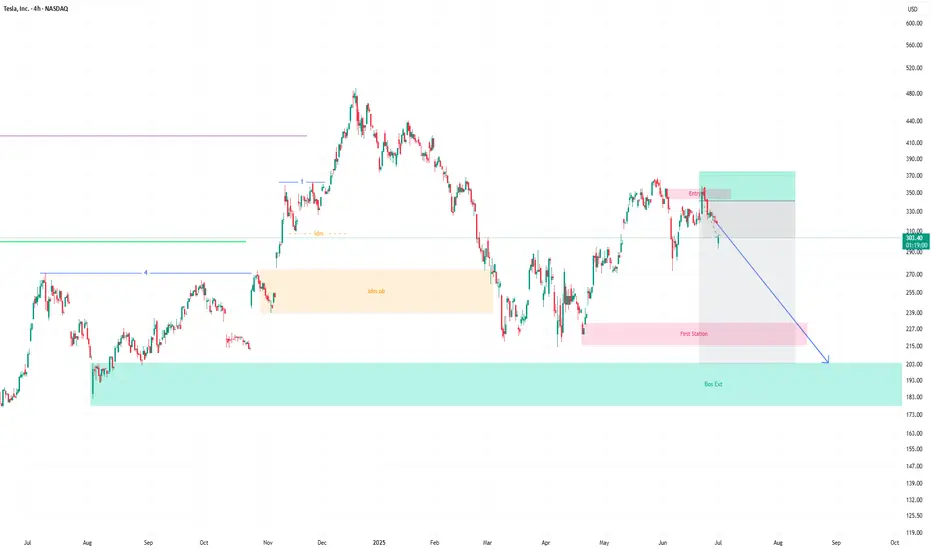
Tesla (TSLA) -Bullish Reaccumulation Setup | Smart Money conceptTesla shows a clean CHoCH followed by BOS structure, indicating a potential bullish continuation. The market is forming equal lows into a demand zone (green box), suggesting a possible liquidity sweep before a move higher.
Key Technical Points:
CHoCH (Change of Character) confirmed on strong bullish impulse.
BOS (Break of Structure) signals market intent to continue upward.
Ascending triangle structure with multiple support tests (marked "S").
Anticipated sweep into demand zone: $308–$312 area.
Potential upside target: $365–$375 supply zone.
Bias: Bullish on confirmation of demand reaction.
Disclaimer:
This is not financial advice. Always do your own analysis before investing.
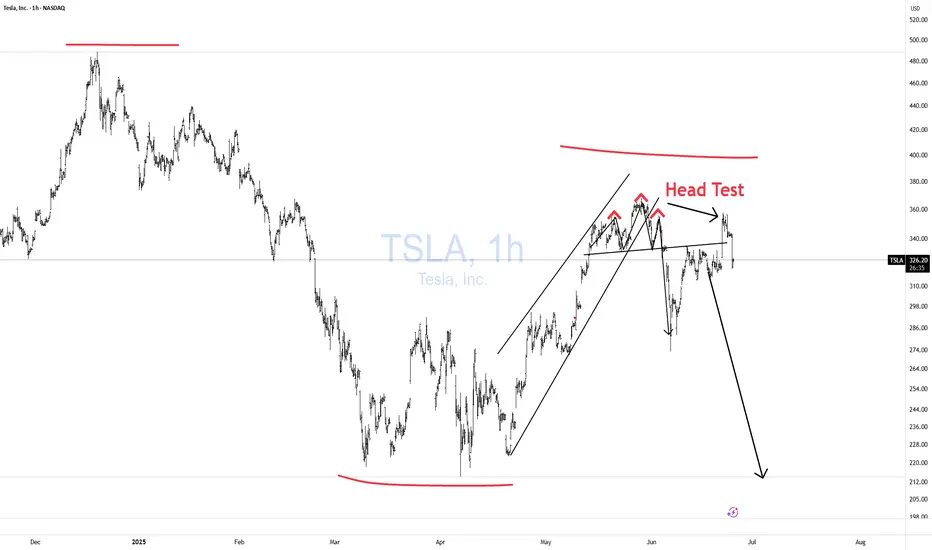
Pull-back Post Austin LaunchNot quite a dark cover cloud candlestick today but given how strong the Nasdaq was today and NASDAQ:TSLA slumped is a fairly pathetic price action on day 2 post Austin launch.
IMO a lot of shorts were on the sidelines until robotaxi commenced. They waited for the pop and now feel more confident in entering short since they were able to assess launch. Buy the rumor sell the news if you will...
Correcting below the pre-launch price back to the lower wedge trend line around low 300s is my target.
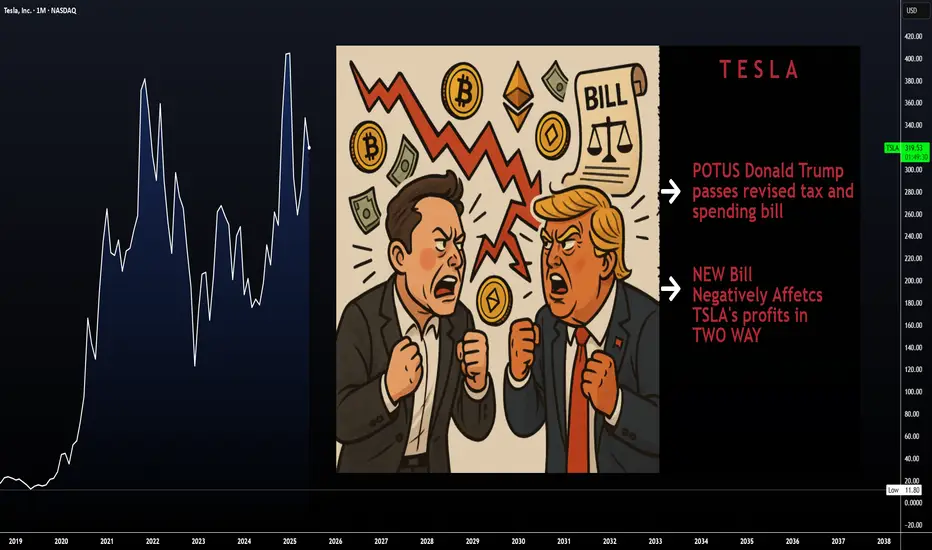
MUSK on TRUMP's Bill | "outrageous, disgusting abomination"Elon Musk’s sided against the latest Trump-backed tax-and-spending package, in a plot twist between the recent partners turned enemies.
Musk called the legislation a “massive, outrageous, pork-filled Congressional spending bill” and a “disgusting abomination,” publicly shaming senators and representatives who backed it.
With such a strong opinion against it one may wonder, is this going to negatively affect Tesla?
Together with this strong reaction, the price has already been trading lower for the past few days.
The administration has defended it as the “One Big Beautiful Bill,” insisting it will stimulate growth, even though Elon Musk warned the bill would swell the U.S. budget deficit by roughly $2.3–2.5 trillion over the next decade, calling the added debt “crushingly unsustainable”.
When I first read this, it made me think of Tesla's long generated “green credits”, which in 2024 alone, brought in roughly $2.76 billion. “green credits” (officially, zero-emission or regulatory credits) work by building more clean vehicles than required and selling the excess allowances to other automakers that need them to comply with emissions mandates.
Now I'm no expert on US policy, and so I roped in GPT to help me explain how this new bill implicates TESLA's profit:
Under the Senate’s “big, beautiful” tax-and-spending bill, Tesla’s regulatory-credit business faces two assaults:
❗ Repeal of CAFE- and ZEV-mandates
The bill would eliminate penalties for automakers missing Corporate Average Fuel Economy targets and roll back zero-emission vehicle mandates that currently force legacy manufacturers to buy credits if they fall short. Remove those penalties and mandates, and there’s no structural need for credits—undercutting the very market that funds Tesla’s $2–3 billion-a-year credit-sales business
❗ End of consumer EV tax incentives
By phasing out the $7,500 new-EV credit (and the $4,000 used-EV credit) within months of enactment, the bill dampens U.S. EV demand overall. A smaller EV market means fewer opportunities for Tesla to leverage fleet-wide ZEV regulations against higher-emitting rivals—further squeezing credit prices and volume
Bottom line: Without CAFE/ZEV obligations and with EV purchase subsidies gone, Tesla’s “green-credit” line—a major profit driver in recent quarters—would likely collapse, removing a key buffer against manufacturing and pricing pressures.
This could be the beginning of a bear market for Tesla lasting throughout the rest of the Trump administration.
________________________
NASDAQ:TSLA
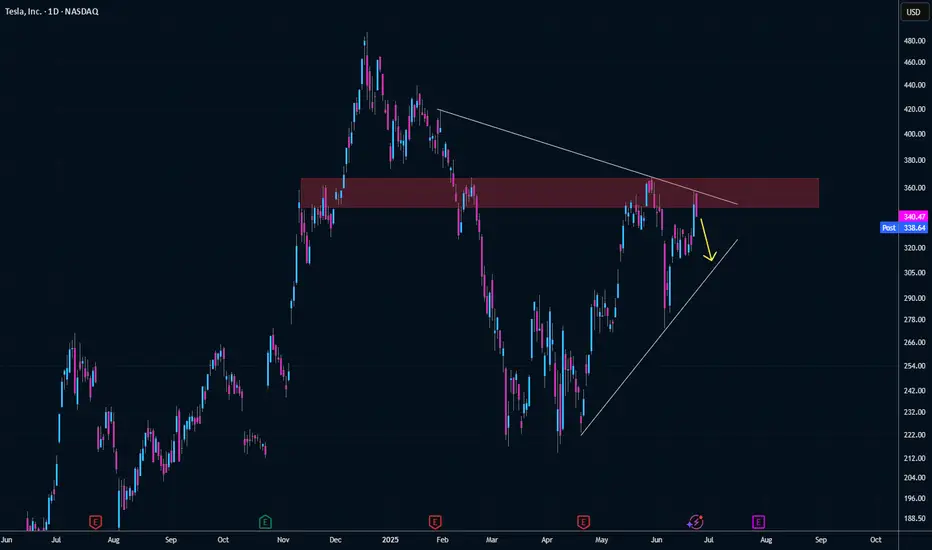
TESLA Lagging BehindA compelling reason to buy Tesla stock now—despite it being beaten down—is the asymmetric risk-reward setup driven by its depressed valuation relative to long-term growth potential. Sentiment is currently low due to concerns about EV demand, competition, and Elon’s distractions, but this pessimism is largely priced in. Meanwhile, Tesla still holds massive optionality: AI-driven autonomy, energy storage, and Dojo supercomputing. If even one of these verticals scales meaningfully, current prices may prove a generational entry.
At the moment, we are hitting some of my key support levels being the anchored vwap from the low , as well as the previous Value Area High range retest within the formation of this broader triangle, suggesting a potential continuation to the upside should we get a strong breakout.
I will be watching for further down side as the current risk is only approx 6-7% for a potential upside of 60%-70% , a massive Risk to reward.
Should this reclaim the downtrend vwap, it can be a strong sign of strength for this stock to move back to ATH's as tesla is massively lagging behind.
super sell on the run for TSLAwe looking for sells on this pair as you can see there is a trend moving up but there is likly to have a short sells going on now
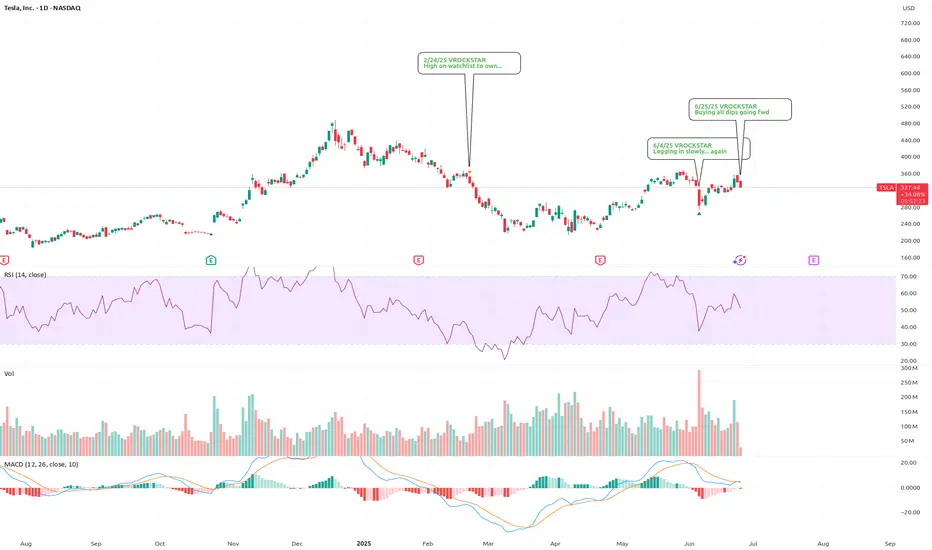
6/25/25 - $tsla - Buying all dips going fwd6/25/25 :: VROCKSTAR :: NASDAQ:TSLA
Buying all dips going fwd
- "successful robotaxi or not successful robotaxi"
- elon's clearly won the vision game
- scaling hardware (cars, infra, optimus, solar) is m-o-a-t
- so is a humanoid and robotaxi robotics company that doesn't burn cash worth a trilly in today's world if the upside is perhaps 5-10 tn in the coming decade (worst case) and your downside here is what? 30... 40... 50%? Is it more? unlikely.
- so "yes" we remain entering consumer recessy. yes "tsla" shares r not cheap. and that's for a reason.
- buy scarce paper.
- buying all dips here.
- i like the dec '27 deep ITM leaps. allows me to wrangle size with a bit more flexibility in the coming months.
- but this rocketship has yet to make any meaningful moves.
- $1,000/shr is the 2Y tgt.
V
The price will drop to at least $230The price will drop to at least $230. after that can goes to $200. but i have to re-check at $230
If you are thinking of investing, this is not a good place to buy at all.
I recommend entering in the $200 range after getting the necessary confirmations.
If you would like to follow me to see the rest of my analysis.
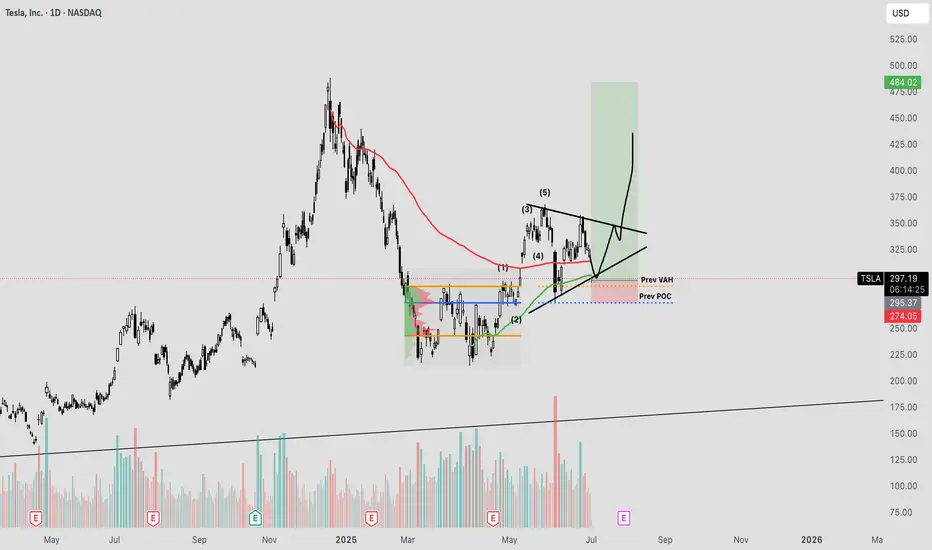
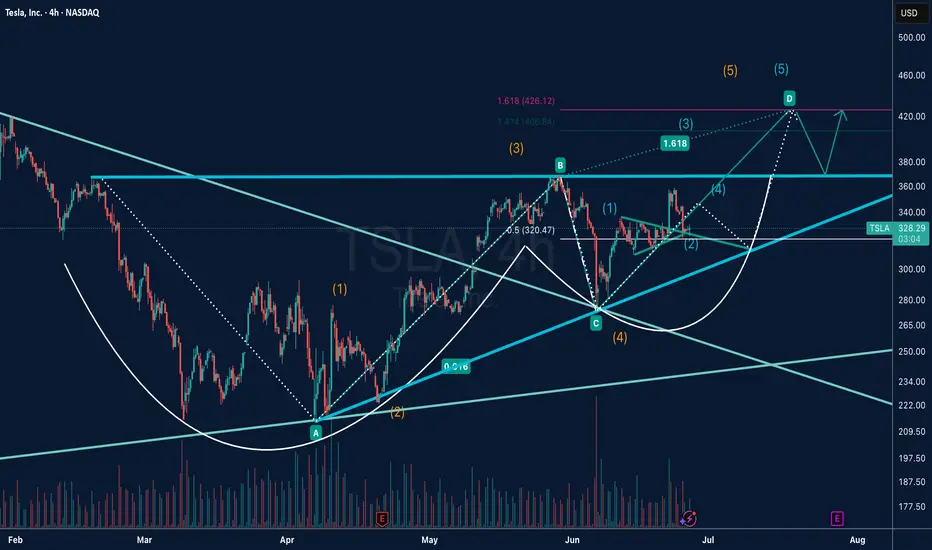
TSLA Elliott Wave Analysis | Bullish Scenario UnfoldingThis chart presents a detailed Elliott Wave analysis on Tesla (TSLA) in the 4-hour timeframe.
The price structure from the April low suggests a completed corrective ABC pattern, forming a solid wave (4) base.
A new bullish impulse appears to be underway, with wave (1) and (2) of wave (5) already confirmed.
We are now tracking the development of wave (3), which has the potential to extend toward the 1.618 Fibonacci extension zone around $426, with intermediate resistance at $406.84 (1.414 Fib).
The projected wave (5) could complete near $440, marking the end of a larger degree 5-wave impulse structure.
Key levels to watch: support near $320.47 (0.5 retracement level of wave 1–3) and resistance at $360–380 before the next leg higher.
Two possible scenarios are outlined:
Primary Path (solid lines): Strong bullish continuation toward wave D and (5).
Alternate Path (dotted lines): Short-term correction back to the trendline support before resuming the uptrend.
The chart also highlights the breakout from a long-term descending trendline and a potential cup-and-handle continuation pattern, supporting the bullish thesis.
📈 Trade Plan: Watching for confirmation above $360 to target $406 and $426+ in the coming weeks. Stops should be considered below $310 depending on risk tolerance.
NFA
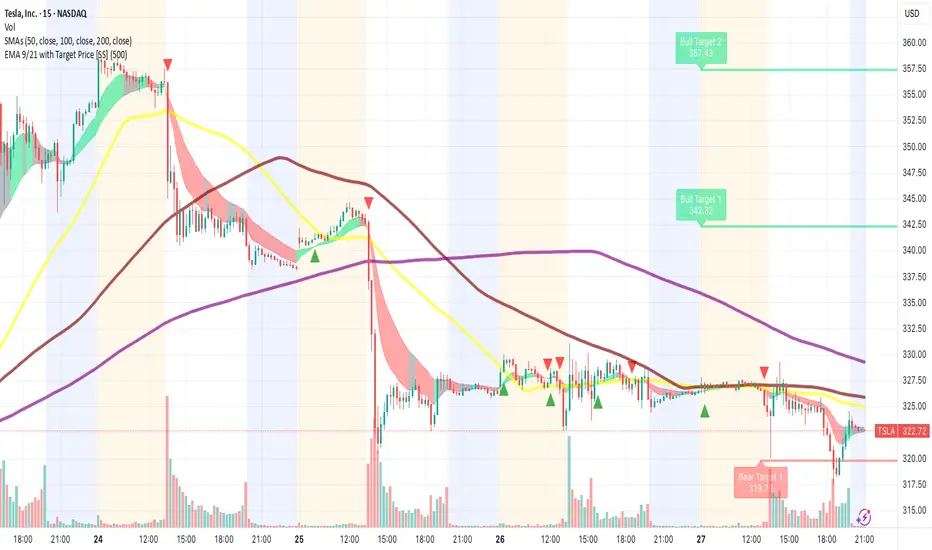
TSLA Long Trade Setup !📈 🚀
Price squeezing at triangle apex—breakout zone 📊
Entry: $327.38 ✅ | Stop: $322.18 🛑
Target: $344.14 🎯 — bullish pressure building! 🔼
#TSLA #LongTrade #TeslaStock #BreakoutSetup #TradingView #TechnicalAnalysis
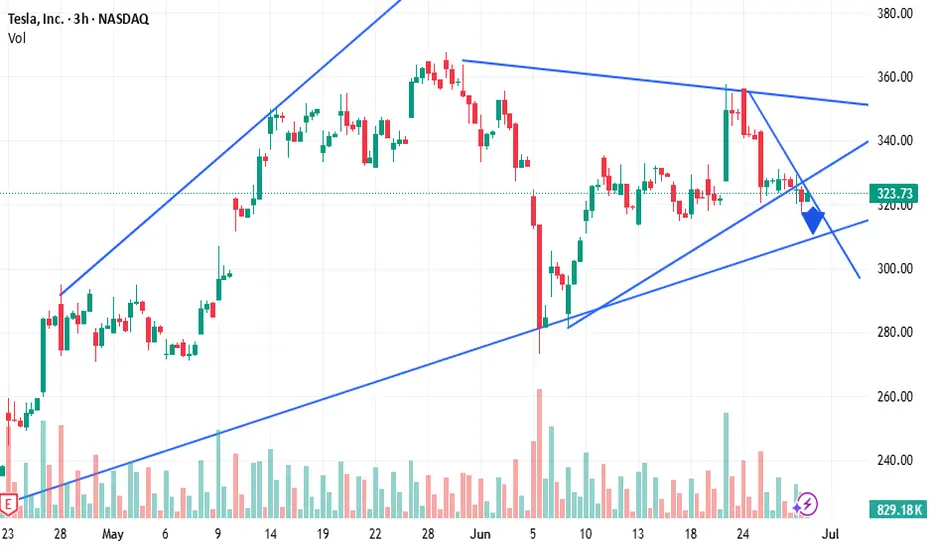
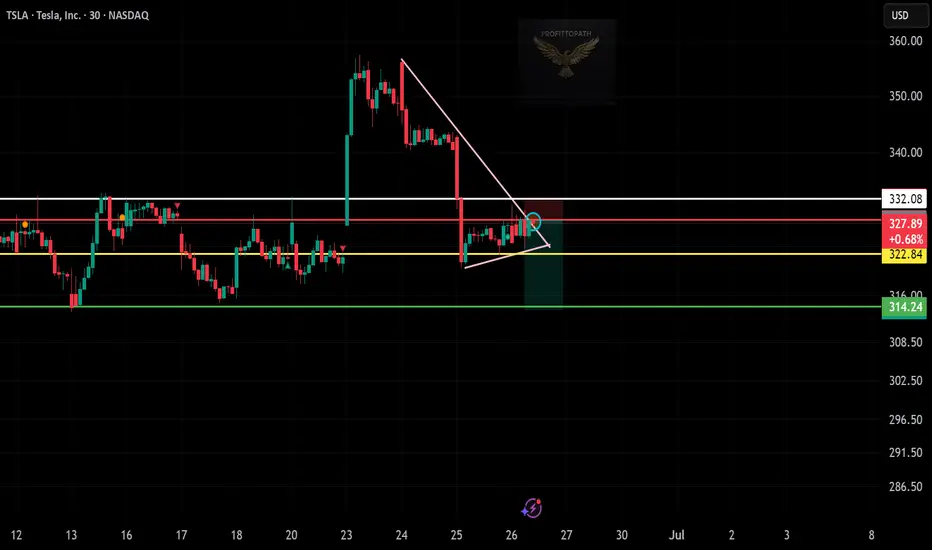
TSLA Short Setup Alert!Price rejected near resistance and forming lower highs.
Entry: $327.78 | Stop: $332.08
Target: $314.24 — watching for breakdown below support.
#TSLA #ShortTrade #TechnicalAnalysis #StockMarket #TradingSetup
TSLA Honey Ticking Bull Trap! UPDATE 1This is an updated chart, as I keep being prompted to reach "My Target" by TV.
No matter how bad things get for Elona and TSLA, there are always people who are willing to pile in and buy at any price. The problem is the chart is showing lower highs, as TSLA no longer attracts the people needed to boost price, just like TSLA the brand. As a result, people keep getting honey ticked.
Don't Get HONEY TICKED!
As I always say, never EVER!! Invest in toxic people like Elona. They always blow themselves up in the end. It's in their nature!
Click Boost, Follow, subscribe, and let's reach 5,000 followers. ;)
TESLA PRICE ACTION 20JUNE 2025This is the price action of Tesla . I have discussed everything deeply and if you have any doubts then feel free to message or leave a comment.
I am bullish on Tesla.
NOTE:DO NOT SHORT TESLA

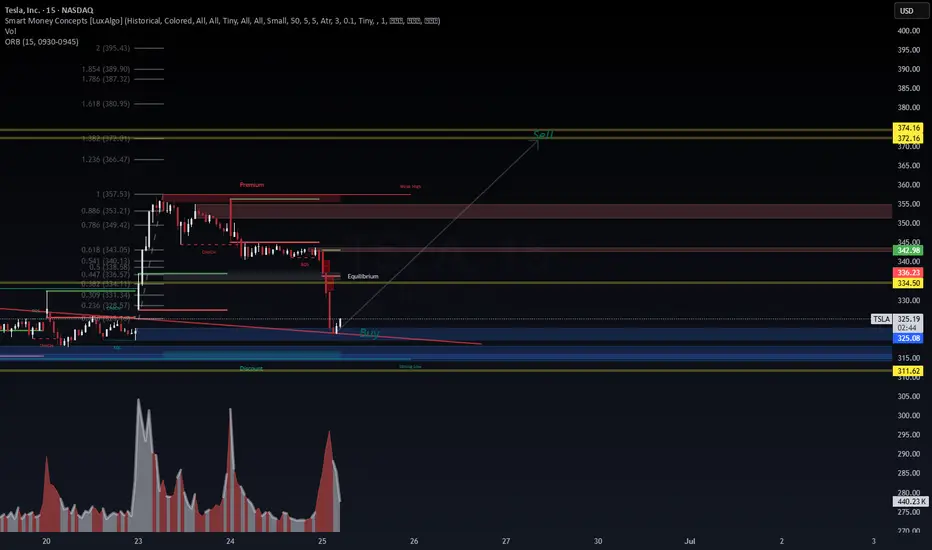
TSLA Intraday Reversal Setup | Smart Money Buy Zone HitTesla just tapped into a deep discount + strong demand confluence with SMC confirmation.
📍 Buy Zone: $311–$324
📍 Target Zone: $372.16 – $374.16 (liquidity above weak high)
📍 Midpoint (EQ/TP1): $336.23 – $345
Trade Thesis:
BOS confirmed after internal CHoCH
Price swept lows into premium discount zone
Volume spike + divergence near key Fibonacci (0.236–0.382)
Bullish intent visible if PA reclaims 336.23 (EQ)
🎯 Targeting ~15%+ intraday swing from reaccumulation. Ideal for scalpers with asymmetric R/R profiles.
🧠 Wait for confirmation – this is where Smart Money steps in.
⚠️ Not financial advice. Educational content only.
#TSLA #Tesla #SmartMoneyConcepts #SMC #LiquiditySweep #Equilibrium #Fibonacci #DayTrading #Scalping #VolumeProfile #WaverVanir #TradingView #IntradayEdge
Tesla - This bullish break and retest!Tesla - NASDAQ:TSLA - confirmed the bullish reversal:
(click chart above to see the in depth analysis👆🏻)
Tesla recently created a very bullish break and retest. Therefore together with the monthly bullish price action, the recent rally was totally expected. But despite the short term volatility, Tesla remains bullish, is heading higher and will soon create new highs.
Levels to watch: $400
Keep your long term vision!
Philip (BasicTrading)

"Tesla: Accumulating Before Takeoff?"Tesla's acting weird, but to me, it looks like it's just loading up. Every time it hits that $320 zone, it bounces back hard. That’s not random — there’s volume, and it’s holding that level with respect.
If it breaks above $330 with solid volume, this thing could easily hit $356 or more. And with earnings coming up and all that robotaxi noise Elon keeps teasing… wouldn’t be surprised if it pops hard.
I’m not saying buy right now, but I’ve got my eyes on it. If I see confirmation, I’m jumping in with a long contract. Now, if it drops below $312 with conviction, I’m out — no hard feelings.
This could get real interesting. Stay sharp.
TSLA Bearish Breakdown in Progress – $322 or Bust? TSLA Bearish Breakdown in Progress – $322 or Bust? Monday Puts On Watch 🔻
🧠 GEX-Based Options Sentiment:
Tesla is currently trading right at a critical GEX flip zone. The $330 level used to be gamma support but has now broken, leaving TSLA vulnerable to a drop toward the high-risk gamma pocket between $320–$310.
The Highest positive GEX zone was stacked near $330–$340, but that structure has failed. The gamma walls above—like $347.5 and $350—now serve as resistance, especially with no strong call flow to support a squeeze.
The downside gamma structure is open. $310 is a soft magnet, but $300 is where the largest negative GEX sits, along with the 2nd and 3rd Put Walls. If TSLA continues slipping, a drop into the $300 zone could be swift.
Implied Volatility Rank is at 25.2, with IVX above 68 — meaning options are expensive, so spreads are safer than naked calls or puts. Flow is still 8% call-heavy, but that can flip hard if Monday starts red.
🔧 Options Trade Setup (for Monday–Wednesday):
Bearish Scenario (favored setup):
If TSLA opens weak or rejects $325–$327.50 area again, consider buying a PUT debit spread, such as 322p/310p or 320p/300p (July 3 expiry).
Target zone: $312, then $300 gamma flush.
Stop: reclaim of $331 with bullish momentum.
Bullish Scenario (lower probability):
If TSLA reclaims $330 and breaks trendline toward $335, consider a CALL debit spread like 335c/345c (Jul 3).
Target zone: $345–$350.
Cut if it falls back under $327.50.
📉 Intraday Technical Breakdown (1H Chart):
The price has confirmed a CHoCH + BOS combo, rejecting from supply and pushing below the rising trendline. Friday’s recovery attempt stalled right under that broken structure, and sellers took over late day.
The 1H chart is forming a bearish descending channel, with price currently trying to bounce off short-term demand, but failing to reclaim the key mid-zone.
This current setup favors continuation lower unless bulls can pull off a breakout early Monday. Otherwise, the path of least resistance is down.
📌 Key Levels to Watch:
$330.00 – Former GEX support, now resistance
$331.10 – Trendline and bearish trigger flip
$322.00 – Key support line (last defended Friday)
$320.00 – Gamma pivot zone
$310.00 – GEX magnet and low-volume shelf
$300.00 – Highest negative GEX and major PUT support zone
$345.25 – Upper trendline + prior supply rejection
✅ Thoughts and Monday Game Plan:
TSLA is sitting on the edge of a breakdown. The gamma structure supports further downside as long as price stays below $330. Watch for early rejection at $325–$327.50 to initiate puts.
If bulls manage to gap and reclaim above $331, reassess for a reversal setup — but for now, structure, volume, and GEX are all pointing down.
This is a reactive trade — wait for early confirmation on Monday and ride the wave, especially if SPY opens weak.
Disclaimer:
This analysis is for educational purposes only and not financial advice. Always trade with proper risk management and do your own due diligence.

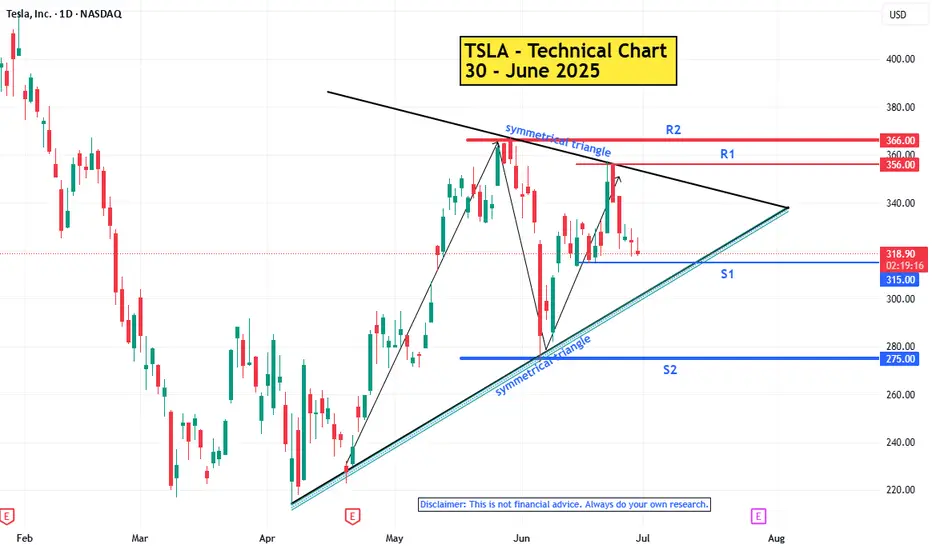
TSLA : Technical Analysis Report - 30 June 2025Trend:
The primary trend (big picture) is upward. Bullish momentum is weak.
Short Term Trend : sideways / consolidation. Regardless of the larger trend, momentum within a sideways range is typically neutral or flat, reflecting a temporary balance between buyers and sellers.
Pattern : Symmetrical Triangle Patte rn
A symmetrical triangle is like a market catching its breath. It's a temporary pause in a trend. Once the price breaks out of the triangle, it usually continues in the same direction it was going before. Until that breakout, it's a neutral pattern.
Key levels :
R2 - 366
R1 - 356
S1 - 315 -The price is facing the support 215.
S2 - 275
Tips for Trading
Wait for a confirmed breakout (e.g., a daily candlestick close above/below the trendline) to avoid false signals
-----------------------
Note :
If you’re interested in receiving detailed technical analysis reports on your selected stocks, feel free to reach out to me. I can provide you with customized reports covering trends, key levels, momentum, patterns, and price projections to support your investment decisions.
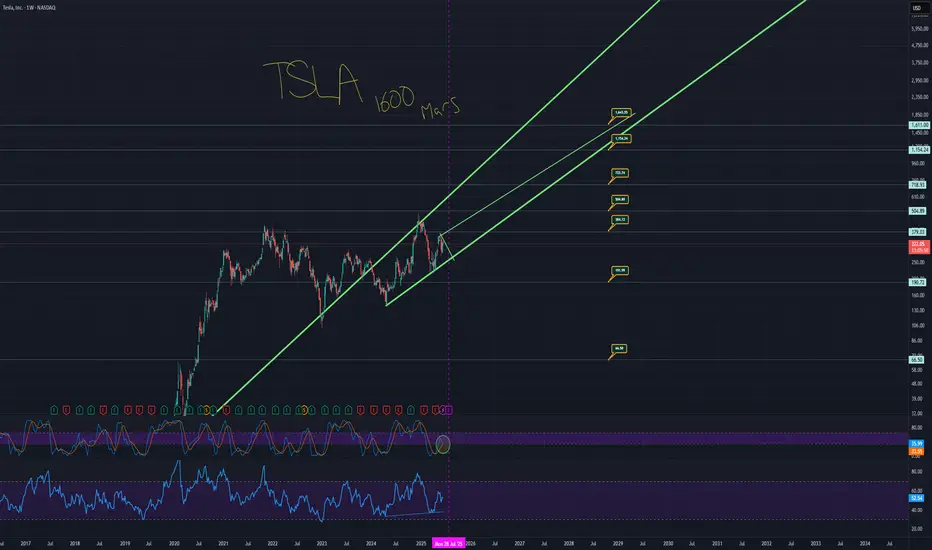
TSLA TO 1600, YOU SAW IT HERE FIRSTHere's the TA that takes Tesla legitimately to 1600.
The monthly chart has a trend that is currently acting as support.
The price has fallen under that trend.
Price action is also over a massive support trend from the weekly chart.
These are the two thickest green trends.
When you zoom back and look at TSLA as a whole, you see the bigger picture.
You have a situation where the low side takes you to around $60 to 70 dollars with a low of around $48. And then you have the high side taking you to around 1600. It sounds like a candidate for a stock reverse split.
Essentially, don't miss out on this potential solar data fast car thingy ready to really zoom.
Here is the chart with the auto fib numbers showing potential targets.
Remember, this likely doesn't occur all in one night, but the projection is really looking like it takes off from earnings. Projection line in yellow.
You have an opportunity where short term trends go to a strong long term trend which climbs to a support trend meaning price can literally take off from multiple of these trends meaning, we can price action go from 420 down to 250 and back up to 1600 in less than a year total.