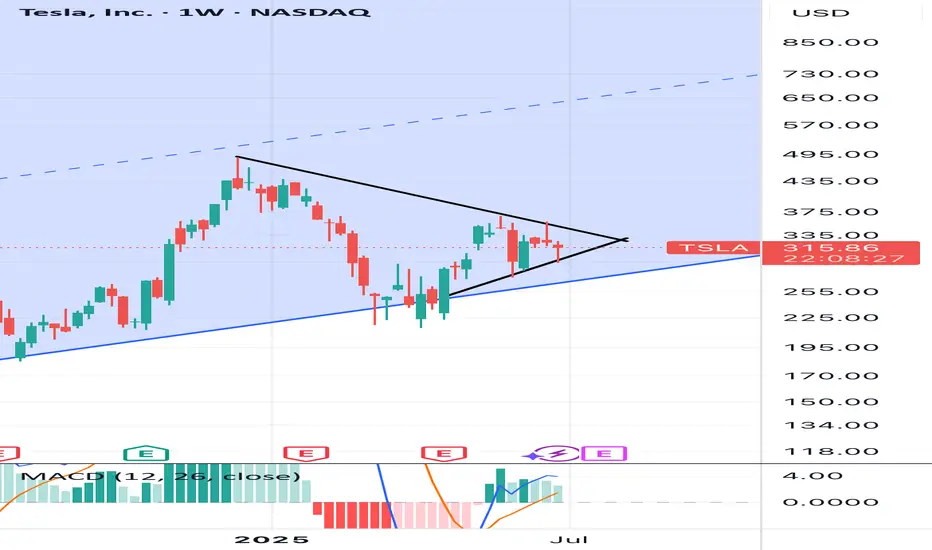
Big fat cup & handle on the weekly My instinct tells me today was the last dip buying opportunity before parabolic move. The daily chart is showing wedge consolidation and big institutions are buying. Elon just needs to focus
TSLA trade ideas
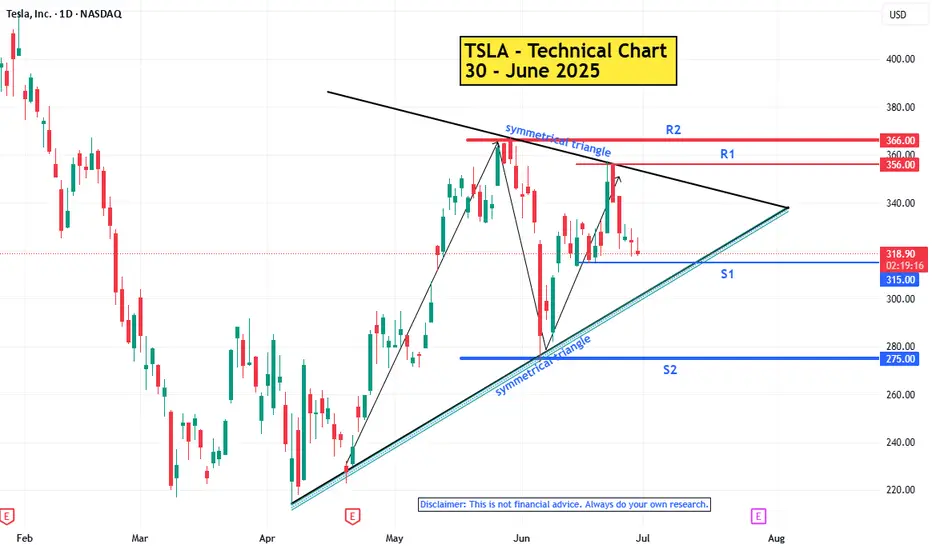
TSLA : Technical Analysis Report - 30 June 2025Trend:
The primary trend (big picture) is upward. Bullish momentum is weak.
Short Term Trend : sideways / consolidation. Regardless of the larger trend, momentum within a sideways range is typically neutral or flat, reflecting a temporary balance between buyers and sellers.
Pattern : Symmetrical Triangle Patte rn
A symmetrical triangle is like a market catching its breath. It's a temporary pause in a trend. Once the price breaks out of the triangle, it usually continues in the same direction it was going before. Until that breakout, it's a neutral pattern.
Key levels :
R2 - 366
R1 - 356
S1 - 315 -The price is facing the support 215.
S2 - 275
Tips for Trading
Wait for a confirmed breakout (e.g., a daily candlestick close above/below the trendline) to avoid false signals
-----------------------
Note :
If you’re interested in receiving detailed technical analysis reports on your selected stocks, feel free to reach out to me. I can provide you with customized reports covering trends, key levels, momentum, patterns, and price projections to support your investment decisions.
TESLA CORRECTION ON THE WAY? + MY WATCHLIST FOR JULY 2025In this video, I run through a couple stocks that look very interesting going into Q3 2025, all stocks listed below!
NASDAQ:TSLA
NASDAQ:CELH
NYSE:EL
NYSE:NKE
NASDAQ:SOFI
AMEX:SPY
NASDAQ:QQQ
NASDAQ:AMD
NASDAQ:CAKE

"Tesla: Accumulating Before Takeoff?"Tesla's acting weird, but to me, it looks like it's just loading up. Every time it hits that $320 zone, it bounces back hard. That’s not random — there’s volume, and it’s holding that level with respect.
If it breaks above $330 with solid volume, this thing could easily hit $356 or more. And with earnings coming up and all that robotaxi noise Elon keeps teasing… wouldn’t be surprised if it pops hard.
I’m not saying buy right now, but I’ve got my eyes on it. If I see confirmation, I’m jumping in with a long contract. Now, if it drops below $312 with conviction, I’m out — no hard feelings.
This could get real interesting. Stay sharp.
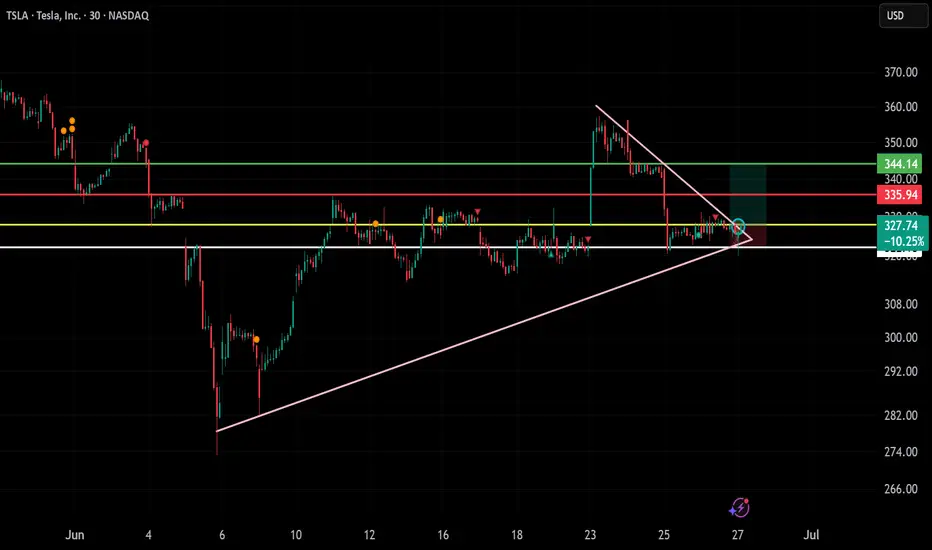
TSLA Long Trade Setup !📈 🚀
Price squeezing at triangle apex—breakout zone 📊
Entry: $327.38 ✅ | Stop: $322.18 🛑
Target: $344.14 🎯 — bullish pressure building! 🔼
#TSLA #LongTrade #TeslaStock #BreakoutSetup #TradingView #TechnicalAnalysis
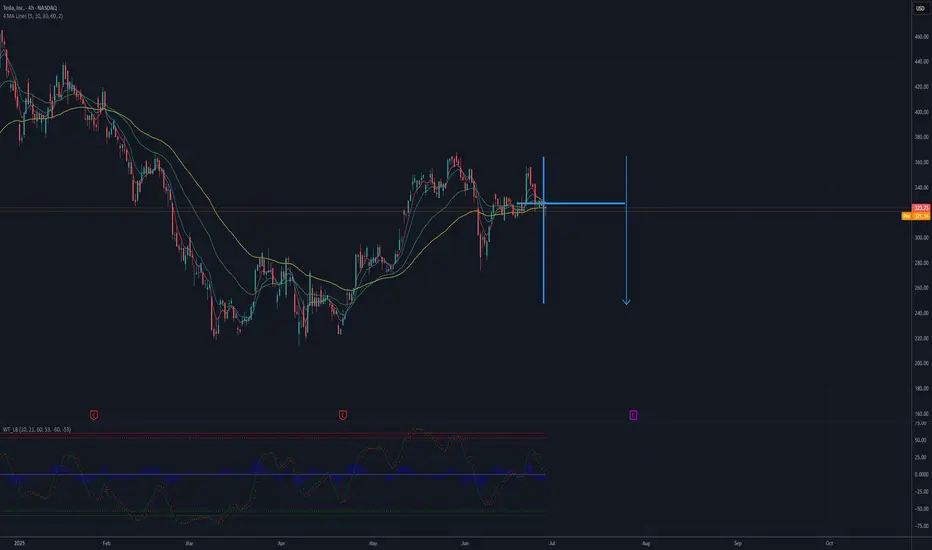
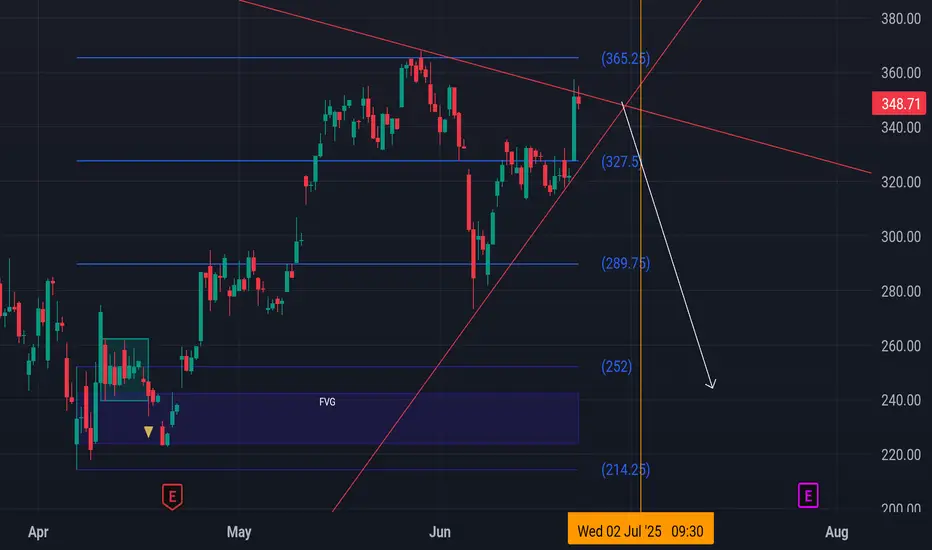
TESLA falling down to 250 USD?Tesla is consolidating in a tight range, showing bearish pressure near the lower boundary of the formation. Moving averages (MA 5/10/30/60) are flattening, indicating a loss of bullish momentum, while the Wavetrend oscillator has issued a sell signal (bearish crossover below the zero line). A downside breakout from this range projects a potential move toward the $250 level, as illustrated by the measured move. This bearish scenario gains validity if price breaks below the $315 support level.
Possible TP: 250 USD
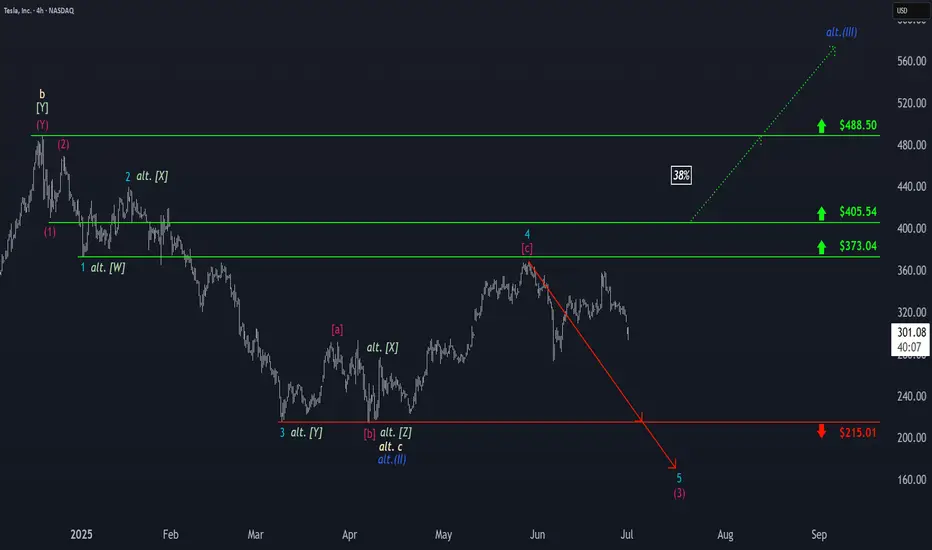
Tesla: Back on Track?Tesla has resumed downward momentum, aligning with our primary scenario and moving away from resistance at $373.04. As part of the ongoing turquoise wave 5, we expect continued selling pressure: it should break below the $215.01 support. This would complete magenta wave (3) of the current bearish impulse. A reversal back above $373.04 – and especially a breach of $405.54 – would force us to adopt the 38% likely alternative scenario. Under this count, the correction low of blue wave alt.(II) would be already in, and Tesla would now be rallying in wave alt.(III) .
📈 Over 190 precise analyses, clear entry points, and defined Target Zones - that's what we do.
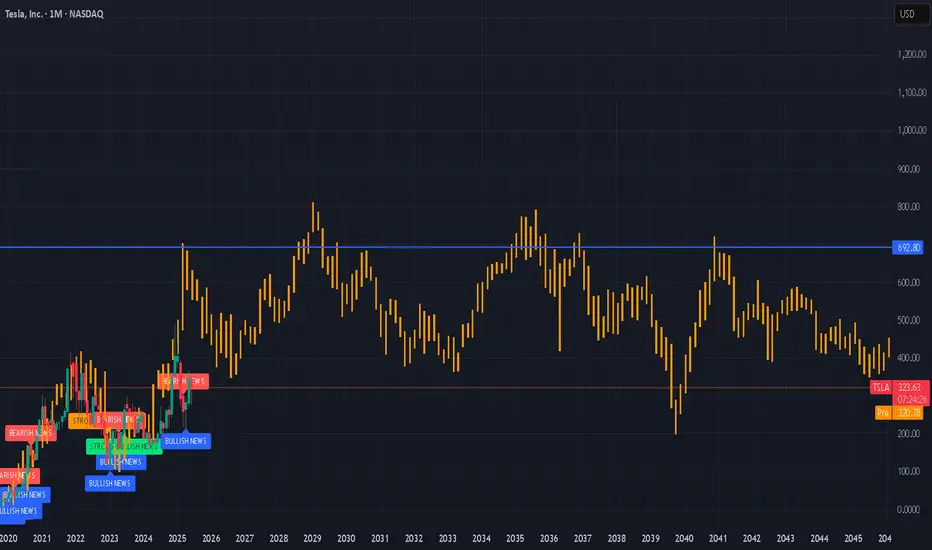
Tesla-Heading For A New ATH?NASDAQ:TSLA is looking good!
Robo-Taxi, Optimus Robots...and so more to come!
Tesla to $692 in the next years? Or months?
#stocks #tesla #stockmarket
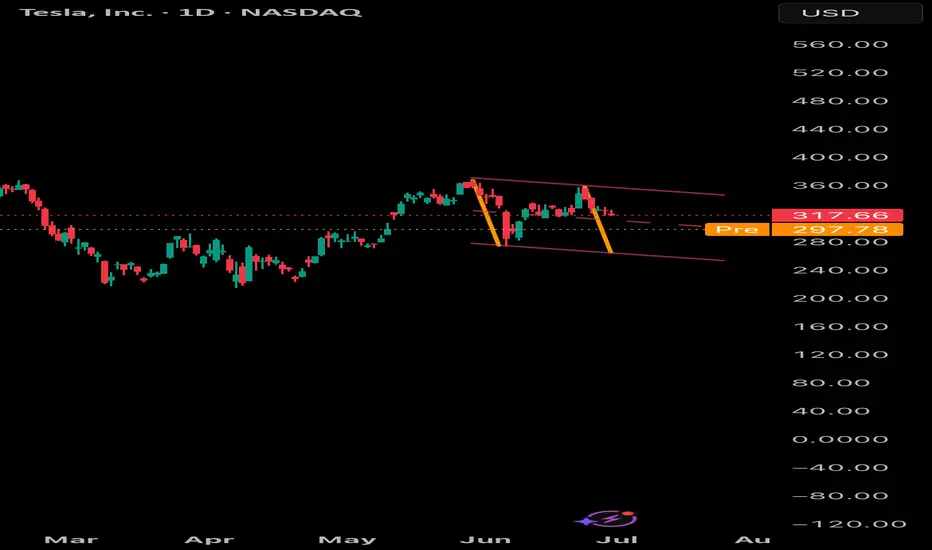
One more drop. Another dip incoming — I just hope we don’t establish below around 260, that would turn bearish.
If we drop down to 260, I’ll be looking to buy again.
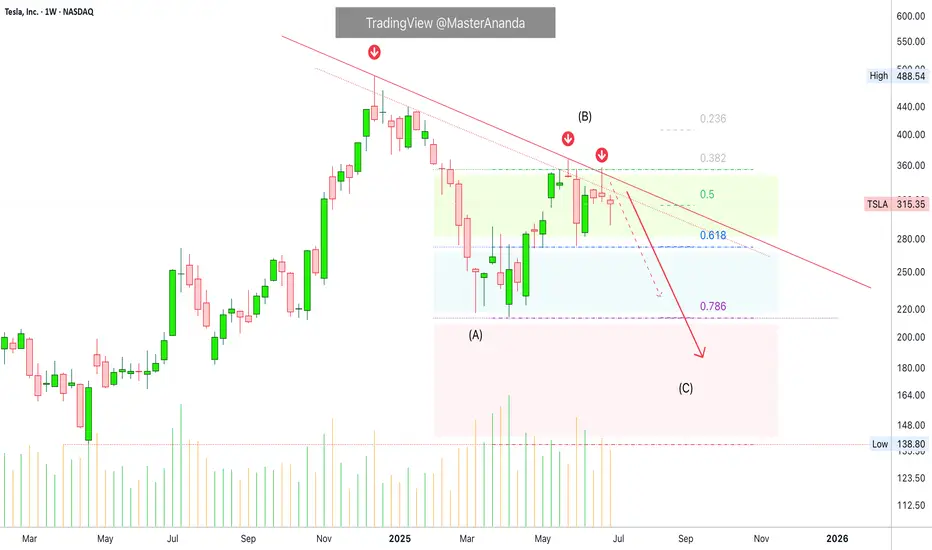
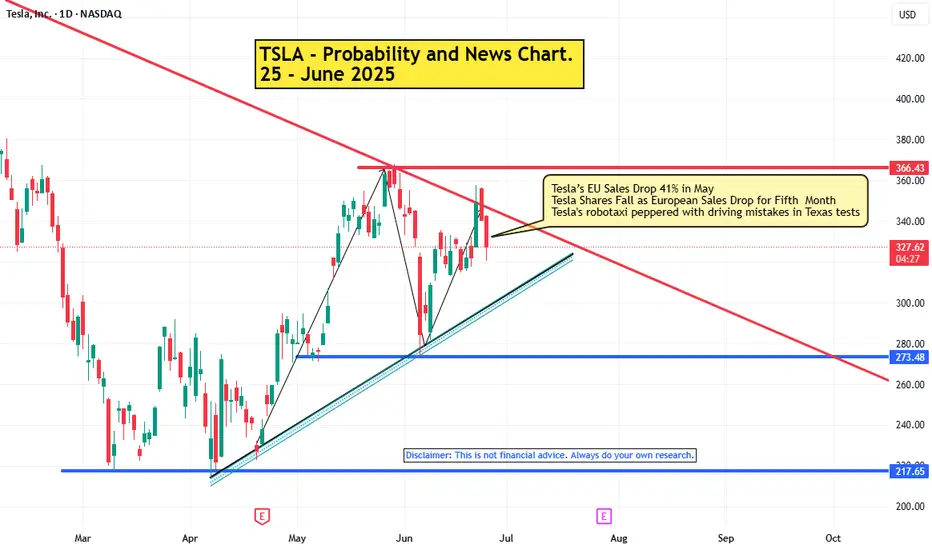
Tesla, Below 200 Next - The Crash Can Reach 140, 150 & 160Tesla has been bearish since December 2024 and producing lower highs since. A strong lower high happened late May with a shooting start candlestick pattern. A month later another lower high and bullish rejection with an inverted hammer.
This looks like an ABC correction with the low in March/April being the A wave. The lower high in May the B wave and the next low the final C wave. This would complete the corrective pattern.
Conditions for bullish
An invalidation of the bearish bias and potential would happen with a rise and close, weekly, above 355. Any trading below this number and the bearish bias remains intact.
Indicators: RSI & MACD
» RSI:
The RSI looks pretty bad as it already curved down; trending down and moving lower since December 2024.
» MACD:
The weekly MACD is weak, starting to curve but still on the bullish zone. The daily MACD already turned bearish and moving lower.
Summary
Overall, market conditions are weak for this stock and everything points lower. The chart structure points to a lower low based on a broader bearish trend.
Thank you for reading.
Namaste.
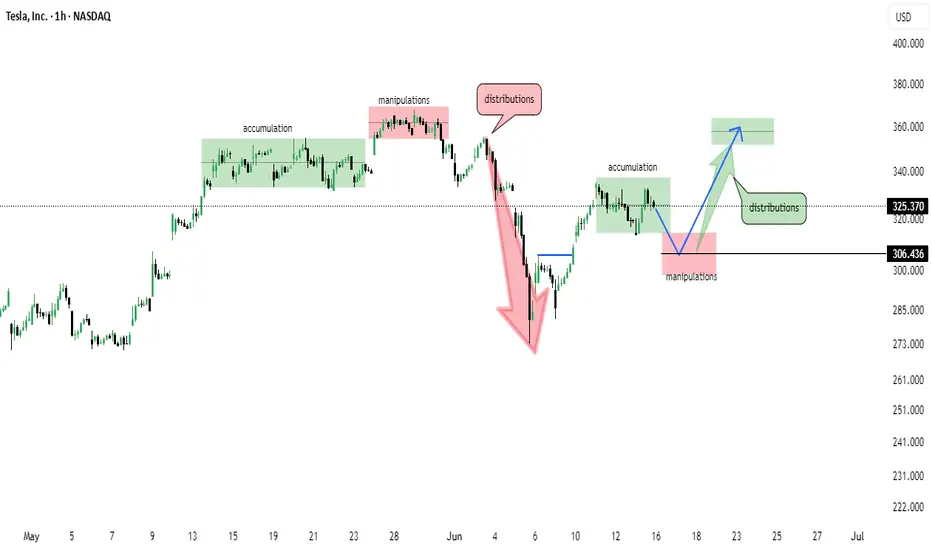
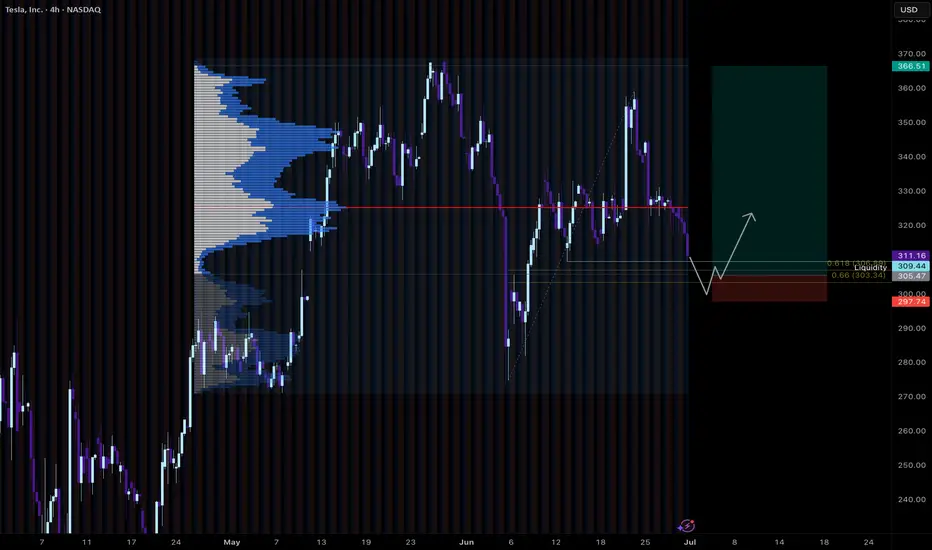
Tesla (TSLA) 1H Chart – Wyckoff Cycle in ActionThis chart reflects a textbook Wyckoff pattern unfolding on TSLA’s 1-hour timeframe:
🔹 Accumulation Phase observed early May
🔹 Followed by Manipulation & Distribution – classic trap before markdown
🔹 Sharp selloff led to another Accumulation zone around $305
🔹 Further manipulation wicks indicate smart money involvement
🔹 Now projecting a move towards $360–$370 distribution zone
📌 Structure breakdown:
Smart Money Accumulation ➡️ Manipulation ➡️ Distribution
Bullish momentum building from $306 support
Eyes on reaction near the marked green distribution box 📦
📅 As of June 15, 2025 – chart aligns with Wyckoff theory and institutional behavior.
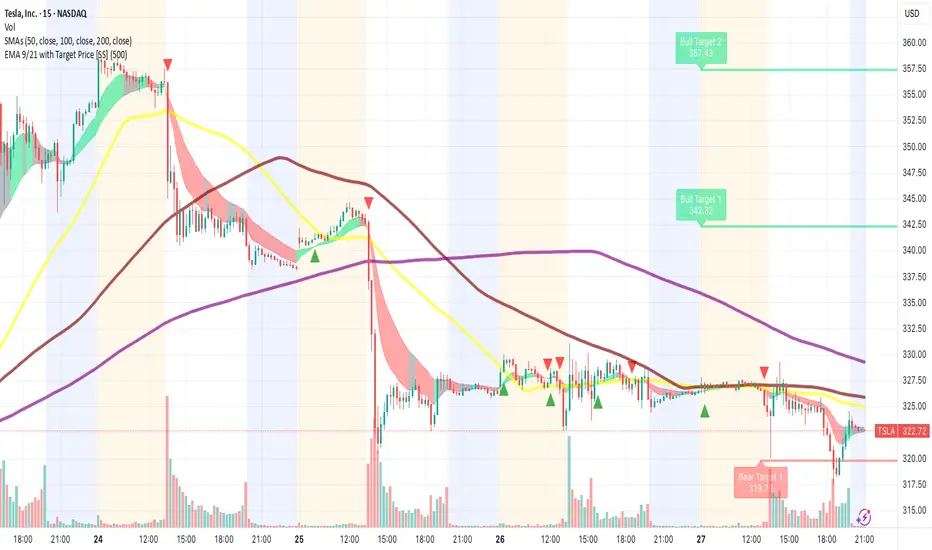
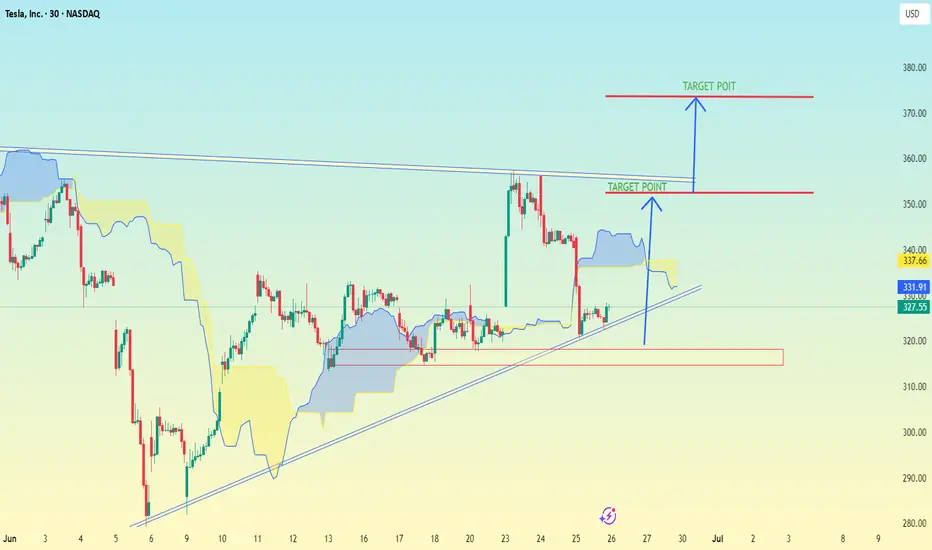
TESLA..(TSLA) 30M TIME FRAME..Tesla (TSLA) on a 30-minute timeframe using Ichimoku Cloud along with trendlines and breakout levels.
There are two target levels indicated:
---
🔵 Immediate Target Point (Breakout Target):
Price Level: ~$350
This seems to be the first breakout target if price breaks above the current resistance zone.
Based on the measured move from the ascending triangle or trendline breakout.
---
🔵 Extended Target Point (Full Target):
Price Level: ~$375–$380
This is the higher target possibly based on a full breakout move from the bottom of the triangle pattern to the top projection.
---
🟢 Current Price: ~$327.55 (at the time of the screenshot)
🧠 Suggested Trade Plan (if you’re trading this setup):
Entry: Above breakout level (possibly ~$335–$340)
First TP: $350
Second TP: $375–$380
Stop Loss: Below trendline or recent support (~$320 or slightly lower)
Let me know if you want a risk-reward analysis or SL/TP calculator based on your entry.
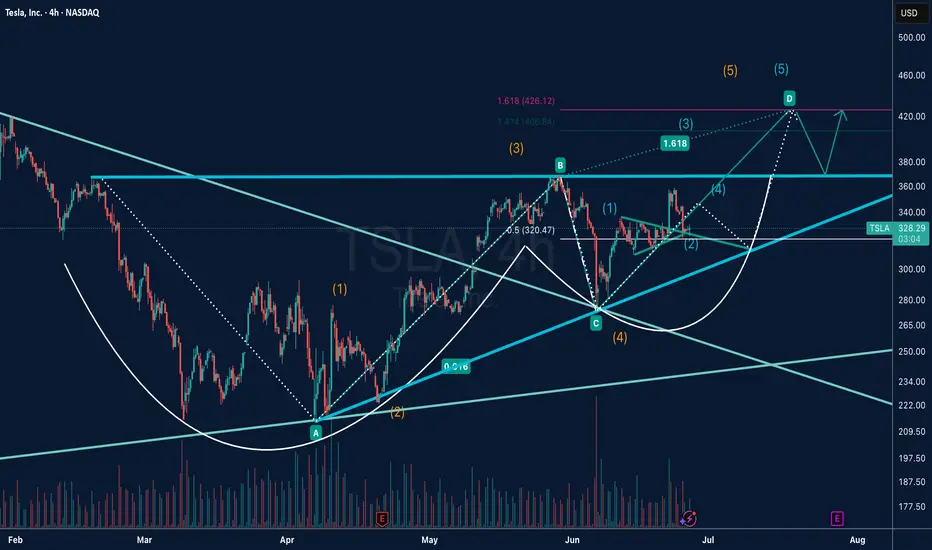
TSLA Elliott Wave Analysis | Bullish Scenario UnfoldingThis chart presents a detailed Elliott Wave analysis on Tesla (TSLA) in the 4-hour timeframe.
The price structure from the April low suggests a completed corrective ABC pattern, forming a solid wave (4) base.
A new bullish impulse appears to be underway, with wave (1) and (2) of wave (5) already confirmed.
We are now tracking the development of wave (3), which has the potential to extend toward the 1.618 Fibonacci extension zone around $426, with intermediate resistance at $406.84 (1.414 Fib).
The projected wave (5) could complete near $440, marking the end of a larger degree 5-wave impulse structure.
Key levels to watch: support near $320.47 (0.5 retracement level of wave 1–3) and resistance at $360–380 before the next leg higher.
Two possible scenarios are outlined:
Primary Path (solid lines): Strong bullish continuation toward wave D and (5).
Alternate Path (dotted lines): Short-term correction back to the trendline support before resuming the uptrend.
The chart also highlights the breakout from a long-term descending trendline and a potential cup-and-handle continuation pattern, supporting the bullish thesis.
📈 Trade Plan: Watching for confirmation above $360 to target $406 and $426+ in the coming weeks. Stops should be considered below $310 depending on risk tolerance.
NFA
Tesla LongCurrently hanging around at the Golden pocket of the uptrend.
Would be interested in a long if we got a retrace to the whole move golden pocket, which sits on the current range VAL. Would also sweep liquidity from the recent lows.
Would need to see a good reaction to take the trade.
Diamond Reversal Forming On Tesla ($TSLA)This pattern on TSLA fits the outline for a diamond reversal that is referenced on Investopedia.
It has all the "classical" facets of a diamond reversal which is a high (A), a low (C) a higher-high.
Furthermore, this is happening alongside a very similar pattern on NFLX and some bearish patterns on many other stocks.
Similar forms also occurred on SPX in 2021-2222 and Bitcoin in 2021.
The move up from the 2023 lows has the form of an ABC up... which suggests another 5 wave downmove on-par with or even exceeding the previous downmove is on the way.
The move off the highs was a whole 75% so even presuming a moderate 1:1 ratio, the next wave down could be very aggressive which means that an excellent short could be lining up.
Trade safe and be careful out there.

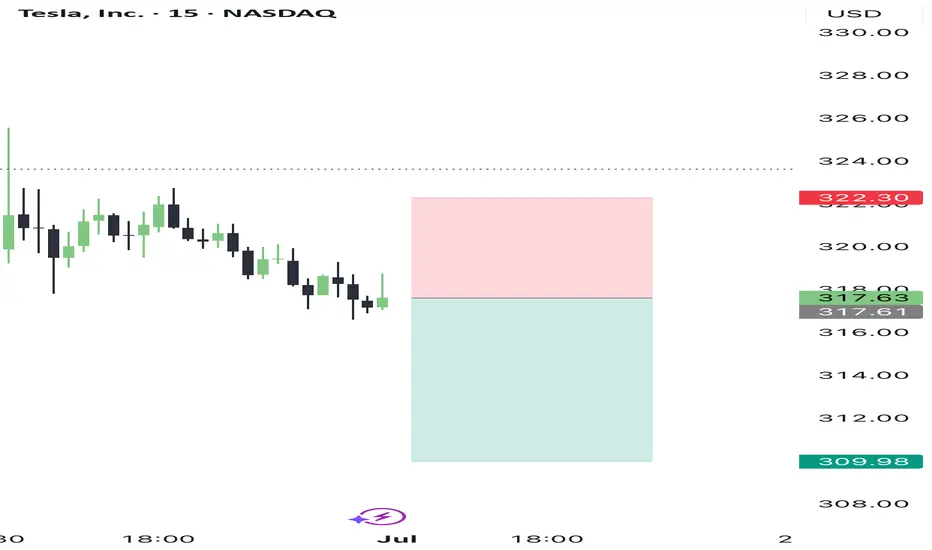
Short setup TiqGPT MARKET NARRATIVE:
Analyzing the Tesla Inc. charts across multiple timeframes, we observe a consistent downtrend from the daily (1D) to the 1-minute (1m) timeframe. The price action shows a series of lower highs and lower lows, indicative of a bearish market structure. The 1D chart reveals a significant bearish momentum with recent candles closing near their lows, suggesting strong selling pressure. This trend is echoed in the 4-hour (4h) and 1-hour (1h) charts, where price has failed to reclaim higher levels, instead forming bearish continuation patterns.
The 15-minute (15m), 5-minute (5m), and 1-minute (1m) charts provide a more granular view of the selling pressure, with price consistently making new lows. The absence of significant bullish retracements across these lower timeframes indicates that liquidity is being taken rather than created, as sellers push the price downward without substantial opposition.
INSTITUTIONAL THESIS:
Institutions appear to be in a distribution phase, offloading shares which is evident from the sustained downward movement and lack of significant pullbacks. This suggests a continuation of the bearish trend with potential further downside.
LEARNING POINT:
The consistent lower highs and lower lows across all timeframes highlight a strong bearish momentum engineered by institutional selling pressure.
SIGNAL: WAIT
SYMBOL: TSLA
ENTRY PRICE: $317.60
STOP LOSS: $322.00
TARGET PRICE: $310.00
CONDITION: Sell on a slight pullback to $317.60, which aligns with recent minor resistance levels on lower timeframes.
RATIONALE: Calculated risk/reward ratio of 1:1.7 (Risk=$4.40, Reward=$7.60) does not meet minimum 2:1 requirement. Waiting for better institutional setup with improved risk parameters.
Momentum & Exhaustion: No signs of exhaustion in selling, with candles closing near lows.
Liquidity Behavior: Continued push lower without significant retracements suggests ongoing institutional distribution.
Pressure Analysis: Strong selling pressure evident from the lack of bullish counter-moves.
Context Awareness: Price is trending down with no significant areas of demand observed that could halt the bearish momentum.
STRATEGIES USED:
Multi-Timeframe Bearish Continuation
Distribution Phase Trading
URGENCY: HIGH
TIMEFRAME: Short-term
CONFIDENCE SCORE: 85%
RISK/REWARD RATIO: Risk=$4.40, Reward=$7.60, Ratio=1:1.7 (Below 2:1 minimum)
Risk = $322.00 - $317.60 = $4.40
Reward = $317.60 - $310.00 = $7.60
Ratio = $7.60 / $4.40 = 1.72
RECOMMENDATION:
The calculated risk/reward ratio of 1:1.72 does not meet the minimum requirement of 2:1. Therefore, the recommendation is to WAIT for a better risk/reward setup or further confirmation of institutional activity that could provide a more favorable entry point.
TSLA : Up trend is becoming weakNASDAQ:TSLA is in Up trend. But the uptrend is becoming weak. Bullish momentum may become weak here. It has pull backed from the down trend line. So It may enter in sideways trend. Down trend line may act as resistance and up trend line may act as support.
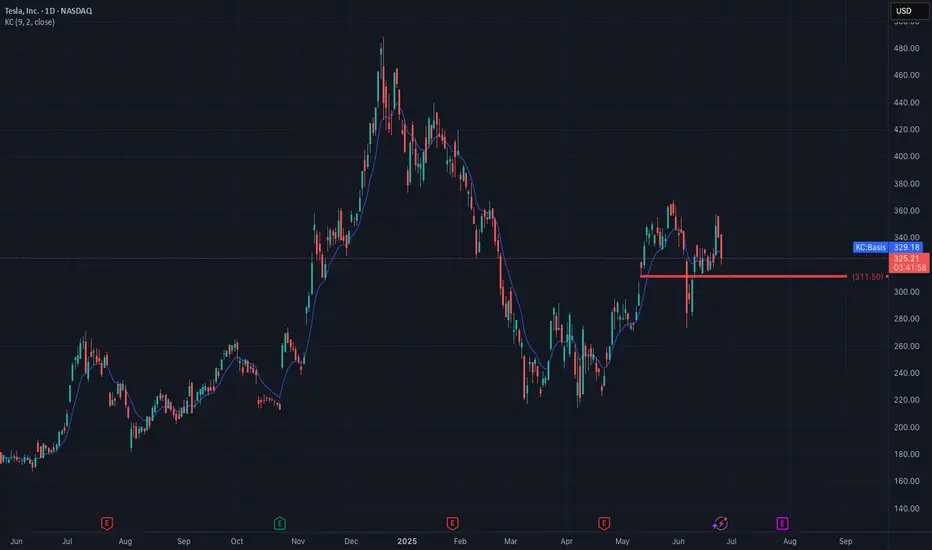
Will the Robotaxi euphoria continue to push TSLA higher?NASDAQ:TSLA pushing higher the last few days thanks to the start robotaxis. Will this rally continue? the answer is yes until the LIS gets broken.
LIS is at 311, any break below will give a retrace. If you are long, get out and get back in when the next LIS gets broken on the upside. This is efficient investing. Don't waste time doing HODL.
LIS is evolving over time, I will keep you updated on it.
This is really simple trading based on important levels. Keep following my post, so you can see it by yourself.
Bearish Elliot Triangle Wave $250 targetObserving Tesla Chart, I noticed a bearish 4hr Elliot Wave A-E. The flow is also bearish and lines up with the bear sentiment. Looking for a bearish Apex Breakout..
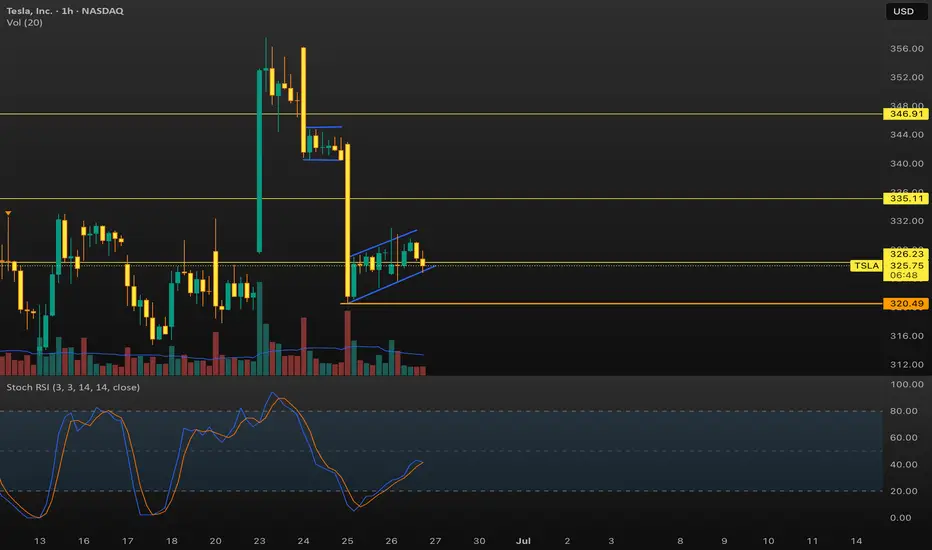
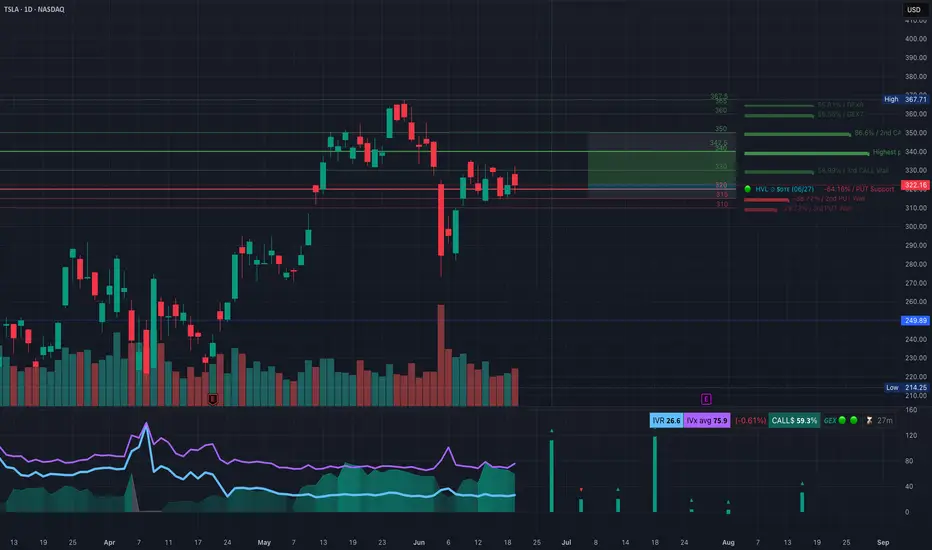
Weekly Technical Analysis for TSLA (June 24–28)TSLA is entering a critical squeeze zone between major gamma walls and key price structure levels. Let’s break this down with both the Daily GEX Map and the 1-Hour Price Action to strategize your trades this week.
📊 GEX Map (Daily Timeframe Insights)
From the first chart:
* Current Price: $322.16
* High Gamma Resistance Zone:
* 🧱 $330 = GEX Cluster
* 🧱 $336–$342 = Highest NTE/Call Wall
* 🧱 $348–$367 = 2nd and 3rd CALL Walls
* Support Levels:
* 🛡️ $315 (2nd PUT Wall)
* 🛡️ $310 (3rd PUT Wall)
* 🔻 Below $310 = Gamma unwind and vacuum toward $296
GEX Sentiment:
* GEX: ✅ Bullish (green dot)
* IV Rank (IVR): 26.6 (low) → cheap options
* CALL$ flow: 59.3% bias bullish
* IVx < IVR → low IV crush risk on CALLs
Interpretation:
TSLA is pinned between two strong gamma zones: $315–$330. A breakout could magnet price quickly to $342+, but a breakdown below $312.50 puts $296 in play fast.
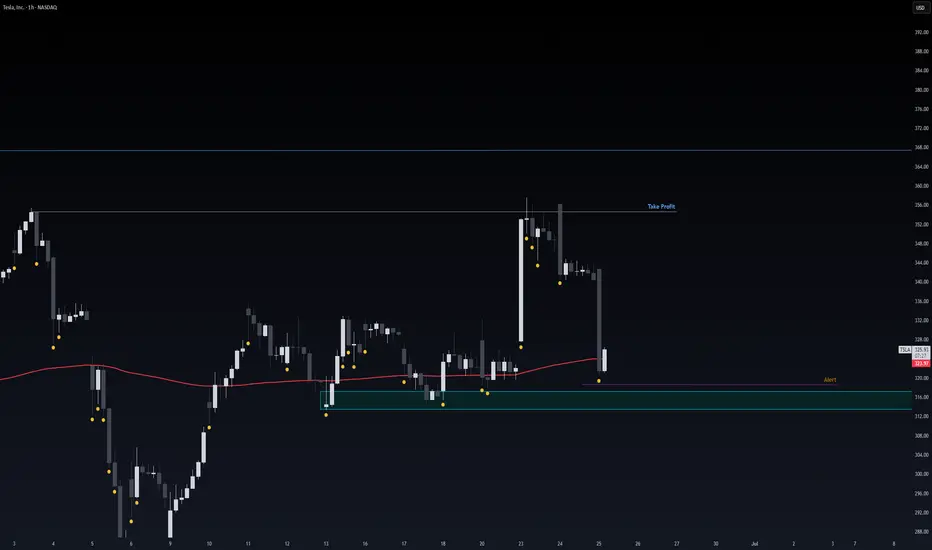
🕐 1-Hour Chart (Smart Money Concepts)
* CHoCH confirmed around $330 zone → bearish pressure
* BOS and reaccumulation near $312–$316 zone → short-term buyer defense
* Trendline support holding, price coiling in a wedge
* Volume shows weak conviction in breakdowns; potential trap under $315
🎯 Trade Scenarios for This Week
🔼 Bullish Setup (Breakout Above $330):
* Entry: Above $333 (confirm breakout + GEX flip)
* Target 1: $342 (GEX target, CALL wall)
* Target 2: $348–$357
* Stop: Below $322
* Trigger: Volume surge + clean CHoCH over pink zone
🔽 Bearish Setup (Breakdown Below $312):
* Entry: Below $311 (gap-filler move)
* Target 1: $296 (FVG + structure zone)
* Target 2: $284 (OB demand)
* Stop: Above $318
* Trigger: CHoCH failure + BOS retest fails under OB
🧠 Smart Tips
* If you’re scalping: watch the $322–$325 chop zone. Only commit on break of wedge.
* Gamma compression + low IV makes TSLA explosive this week—perfect for vertical debit spreads or lottos on direction breakout.
* Best confirmation = volume + higher timeframe CHoCH + breakout candle from consolidation.
🔚 Final Thoughts
TSLA is coiled tight. Watch for the breakout of $330 or a flush under $312. Both offer strong risk-to-reward opportunities. Stay patient, and let price confirm before sizing in.
Disclaimer: This analysis is for educational purposes only and does not constitute financial advice. Always do your own research and manage your risk properly.
Safe Entry Zone TeslaGreen Zone is Safe Entry Zone.
Target is Take Profit line.
Note: 1- Potentional of Strong Buying Zone:
We have two scenarios must happen at The Mentioned Zone:
Scenarios One: strong buying volume with reversal Candle.
Scenarios Two: Fake Break-Out of The Buying Zone.
Both indicate buyers stepping in strongly. NEVER Join in unless one showed up.
2- How to Buy Stock:
On 15M TF when Marubozu Candle show up which indicate strong buyers stepping-in.
Buy on 0.5 Fibo Level of the Marubozu Candle, because price will always and always re-test the imbalance.
TSLA shortPart of a larger analysis, at the moment Tsla rejected 332 B pivot and imo retesting possible b.o. area. missed gap up open, retest of highs sent 305p strike. looking to close at 310-305 tgt zone. n.f.a. g.l.h.f
