XRP 4H – Double Bottom… or Just Another Lower High?
XRP bounced cleanly from major support — the same zone that sparked its last leg up.
This could mark the early stages of a double bottom or just another bear market rally before continuation.
🔹 Previous top = strong supply rejection
🔹 Current support = high-volume bounce zone
🔹 Stoch RSI turning

XRPUSDT → Range formation. Retest of resistanceBINANCE:XRPUSDT.P , after a false breakout of the daily resistance level of 3.352 and the elimination of traders, has entered a correction phase. The trading range shown below has been formed, with an emphasis on resistance...
XRP previously formed a false breakout of the daily resistance leve

XRPUSDT → Hunting for liquidity ahead of a possible declineBINANCE:XRPUSDT.P is forming a downward market structure after a false breakout of global resistance. Bitcoin is in a correction phase and, after a slight rebound, may continue its movement...
Bitcoin has entered the sell zone. The price is consolidating below the global consolidation boundary

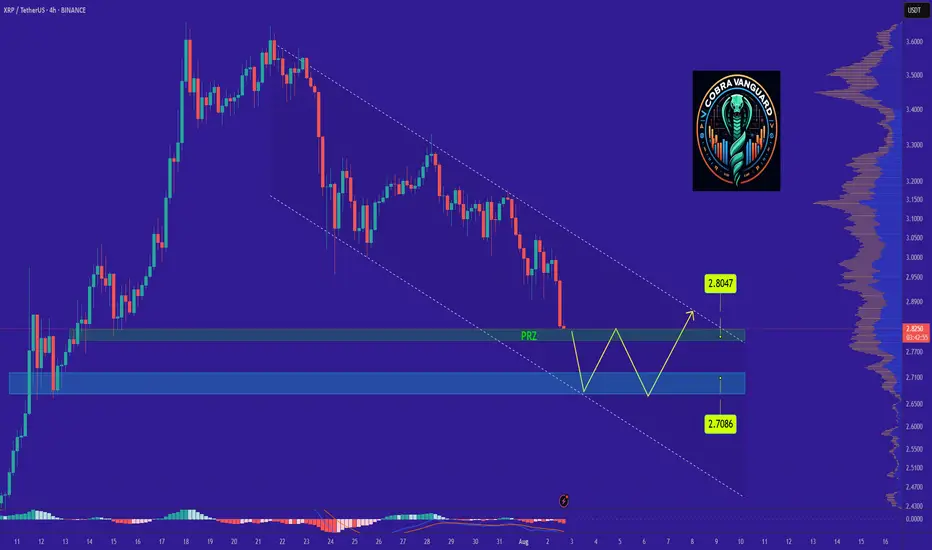
XRPs Situation (Daily) !!!If the price loses the PRZ range, it will drop to the bottom of the channel and then rise to the top of the ascending channel, which will take some time.
Best regards CobraVanguard.💚
XRP Potential BuyXRP will make a huge correction before taking up. This bearish pattern will last up to October of 2025. My possible prediction Price of XRP by 2026 is $12 -$15 mark up.
XRP PERPETUAL SELL SETUP ,Short from $3.06XRP PERPETUAL TRADE
SELL SETUP
Short from $3.06
Currently $3.06
Stoploss $3.35
Targeting $2.97 or Down
(Trading plan XRP go up to $3.14
will add more shorts)
Follow the notes for updates
In the event of an early exit,
this analysis will be updated.
Its not a Financial advice

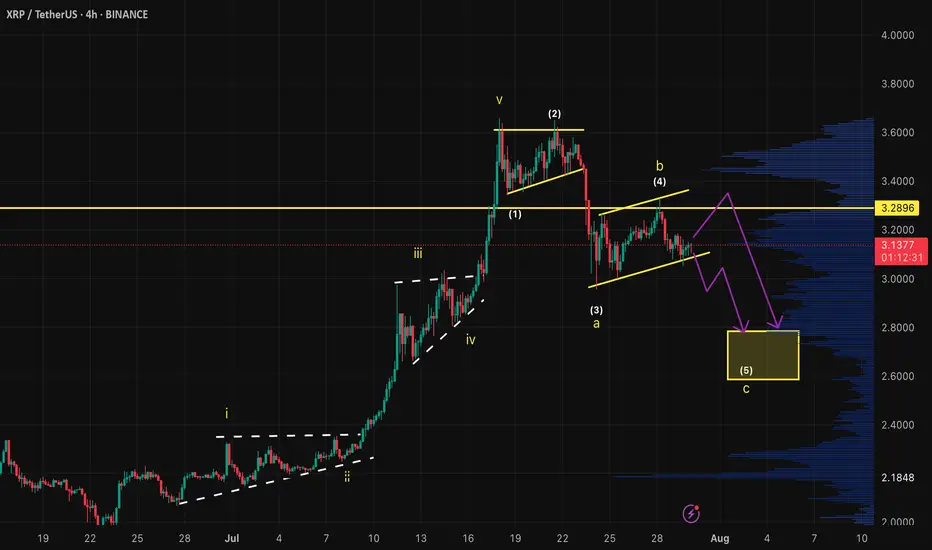
XRPUSDT ShortWe´ve just finished the 5th wave of the bullish structure and started a 5 wave corrective structure for a bigger ABC correction. Right now we´re in the 4th wave and exspecting one more bearish move into the yellow area
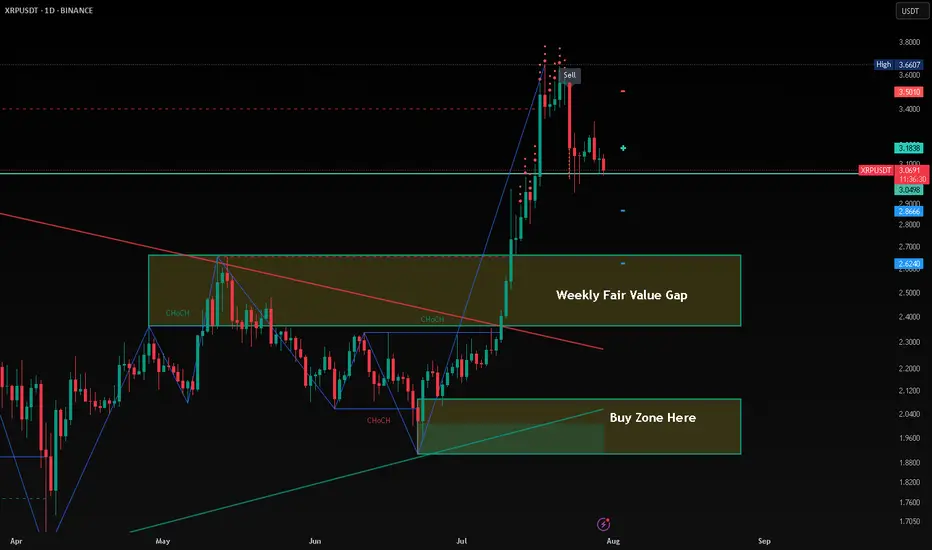
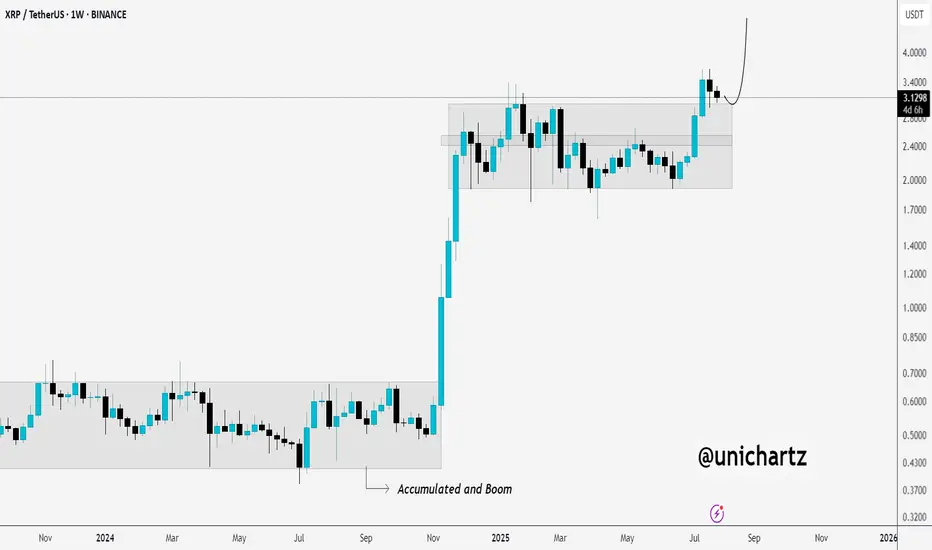
Healthy Retest After Explosive Move – XRP Eyes More UpsideCRYPTOCAP:XRP broke out of a long accumulation range and is now coming back to retest that breakout level, a classic and healthy move.
If this retest holds, we could see the next leg up kick off soon.
Accumulated. Broke out. Now confirming.
DYOR, NFA
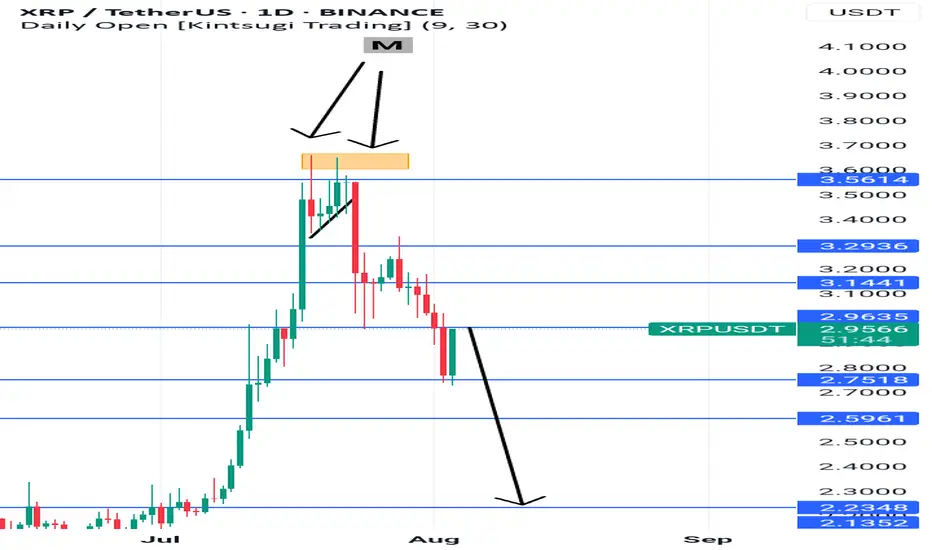
Ripening SellXrp had formed an M formation above, has retest current happen with a huge bullish candle upwards but, if you look to your immediate left-hand side you will see that the level 2.9635 is a point of reversal both with your immediate left-hand and further left.
Time will only tell with the way the can
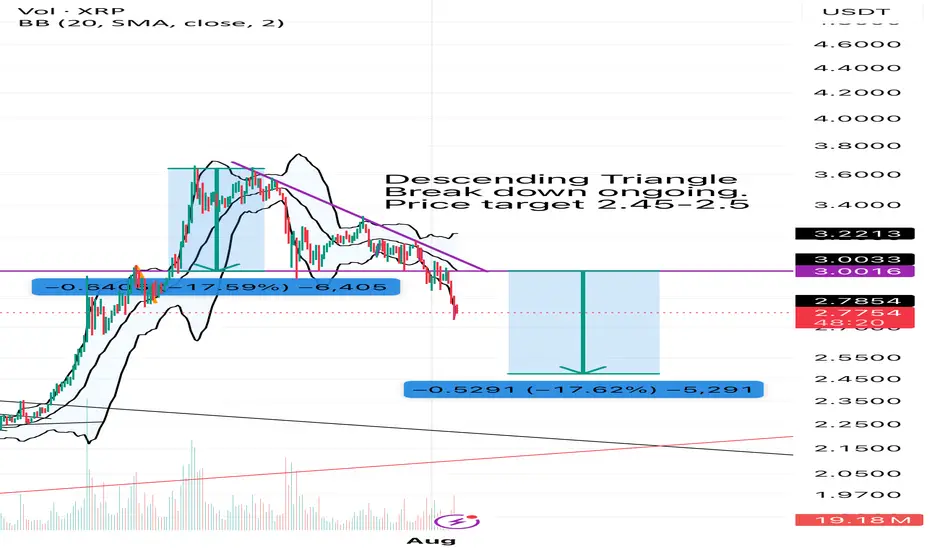
XRP dumping continuesXRP has formed a bearish descending triangle and currently broken down the neck line and continues to dump. This dump will end near $2.45-$2.5 range. Good Luck!
See all ideas
Summarizing what the indicators are suggesting.
Oscillators
Neutral
SellBuy
Strong sellStrong buy
Strong sellSellNeutralBuyStrong buy
Oscillators
Neutral
SellBuy
Strong sellStrong buy
Strong sellSellNeutralBuyStrong buy
Summary
Neutral
SellBuy
Strong sellStrong buy
Strong sellSellNeutralBuyStrong buy
Summary
Neutral
SellBuy
Strong sellStrong buy
Strong sellSellNeutralBuyStrong buy
Summary
Neutral
SellBuy
Strong sellStrong buy
Strong sellSellNeutralBuyStrong buy
Moving Averages
Neutral
SellBuy
Strong sellStrong buy
Strong sellSellNeutralBuyStrong buy
Moving Averages
Neutral
SellBuy
Strong sellStrong buy
Strong sellSellNeutralBuyStrong buy
Displays a symbol's price movements over previous years to identify recurring trends.