Gold vs UNI – Is UNI in the Early Stages of AccumulationThis comparison between Gold (MGC1!) and Uniswap (UNIUSDT) on the weekly timeframe suggests that UNI could be in Phase 1 of a buy program, similar to how gold accumulated before its major breakout.
📌 Key Observations in the Chart Comparison:
PHASE 1: The Accumulation Zone (Green Highlighted Area)
Gold went through a long accumulation period (2013–2017), trading in a sideways range before its parabolic impulse leg kicked in.
UNI is currently in a similar consolidation phase, potentially in the early stages of accumulation.
The monkey face + pointing emoji suggest a "stealth phase" where most retail traders remain unaware of the underlying accumulation.
Old High & Market Structure
Gold formed a major high, crashed, and accumulated before breaking out.
UNI also reached an all-time high (~$44), crashed, and is now ranging in what looks like a potential accumulation phase.
Similar structural formation suggests UNI could be following gold’s footsteps.
Impulse Leg & Breakout Potential
Gold’s first major breakout came after a long accumulation, followed by a massive impulse move (Phase 2).
If UNI is mirroring gold, the next breakout could start the impulse leg leading to a retest of old highs and beyond.
Standard Deviation Extensions (STDVN) – Potential Price Targets
Gold reached 0.5 and 1 STDVN levels after its breakout, which became short-term targets before continuation.
If UNI follows a similar trajectory, targets could be $44.77, $64.98, and eventually $85+ if the accumulation plays out.
🔮 What This Means for UNI?
Early accumulation phase means the smart money is likely positioning.
Price compression leads to expansion—UNI could be preparing for an explosive move.
Similar to gold, UNI could break above accumulation and enter Phase 2, targeting 0.5 and 1 STDVN levels.
If UNI truly follows gold’s structure, long-term price discovery is on the table.
🚨 Lord MEDZ Trading Perspective
"Not financial advice, but let’s keep it real…"
Gold showed the exact same pattern before making a historic move. UNI is mirroring the early accumulation phase.
This is the shakeout before the breakout. Smart money is accumulating while retail panics.
Patience = Wealth. Stay ahead of the crowd.
🚀 UNI could be setting up for something massive. 🚀
XAUUSD1! trade ideas

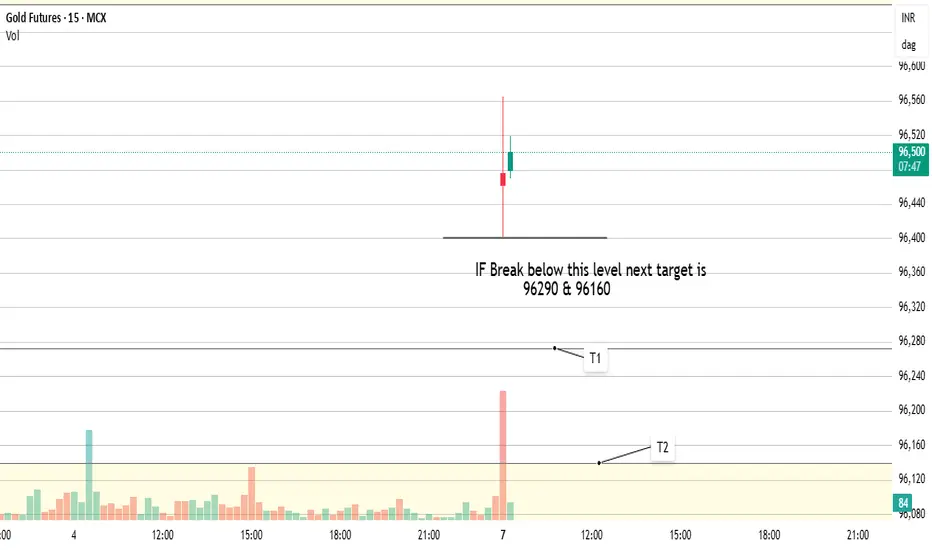
Gold will continue with its bullish breakoutLooking for new highs to be made. Price has pushed bullish as trump started talking about the tariffs early today. Even though they are not supposed to discuss till the 9th. We can get a early move for the week. Monitoring the price action to see if I can get in where I fit in!

IF GOLD drop below 96400 next targets would be 96290 and 96160 If price break 96400 level then u can look to short it for small targets.
July 4 GOLD FIREWORKS!!!Gold bout to POP!!!! and it could be seriously huge! Im just patiently waiting for a area of entry. I have never traded a July 4th Holiday with this much clarity on what I see so this could get interesting.

Gold Short Source, Trust me bro.
I mean well its in a downtrend and the price just keeps hitting lower, the 4h reacting very bearishly and the 1 day also didnt say much more than daily downtrend (recently).
So i think i have good confidence in this trade as i took the long pullback trade yesterday and the price showed that its respecting my analysis, so i would assume this will work out.
$GC / $MGC /Gold - Elliot Wave Analysis - Weekend Update - 7/6Hello fellow gamblers,
As we prepare for a new trading week, I revisited my EW count and was able to come up with 2 scenarios to present to you today.
- For our bullish scenario, I am looking for a break above 3418 and my next target will be at the 3574 - 3525 range.
- For our bearish scenario, I am looking for a break below 3283 and my next target will be at the 3086 - 2846 range.
- Price went through a consolidation as we closed last week's candle, and we are now at POC.
- Levels to Watch: 3418, 3363, 3283

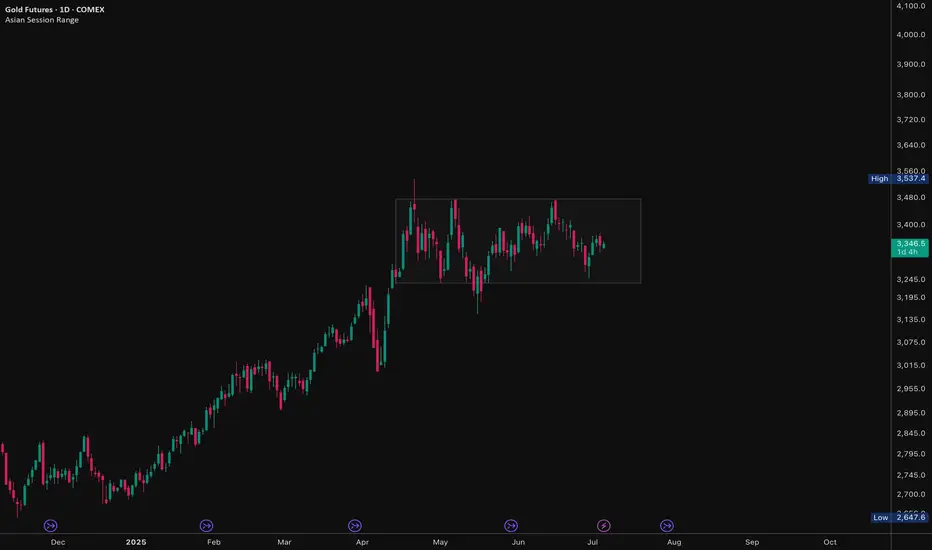
Gold Futures (GC1!) – Accumulation Brewing? Major Move IncomingGold has been stuck in a tight range since April, and to me, this looks like a textbook accumulation zone forming on the daily chart.
Price is coiling within a defined box, showing signs of both strength and weakness — classic behavior before a manipulative move (fake breakout) followed by distribution (true direction). This is where many traders get trapped, chasing the first breakout — only to get caught before the actual move begins.
I’m not committed to a direction yet, but here’s my roadmap:
🧠 First breakout = likely trap (manipulation)
🧭 Wait for confirmation of rejection/failure, then prepare for the real move out of the range
This kind of price behavior often precedes explosive volatility, so I’m watching closely for:
False breakouts above or below the box
Volume spikes or traps
Shift in market structure on lower timeframes
📍 No trade for now, but I’ll be reacting — not predicting.
What’s your bias? Do you think the breakout will hold or fake out?
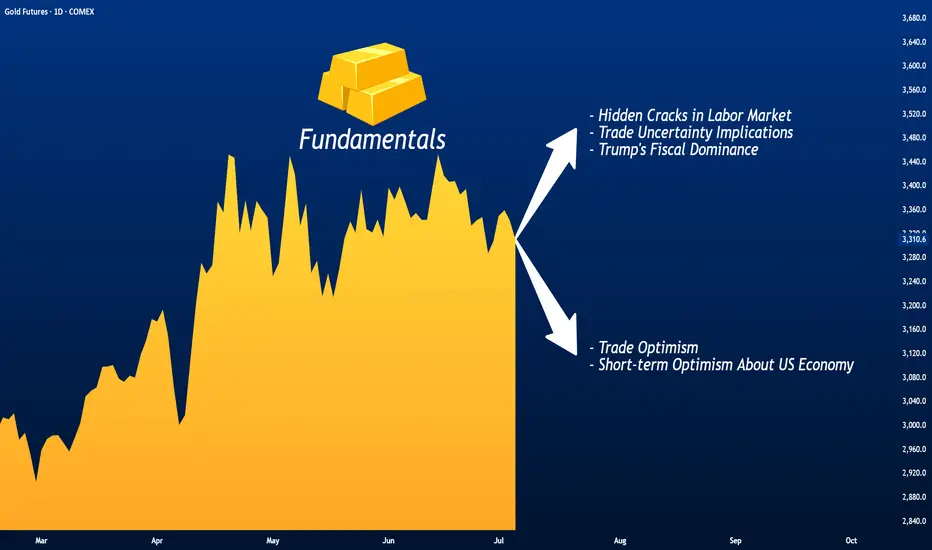
Gold Between Trade Optimism and Economic Concerns
Gold is declining for the second consecutive session, although it remains above the critical psychological level of $3,300 per ounce in early spot trading this morning.
Losses in the precious metal come amid renewed optimism over potential trade agreements that could de-escalate the global trade war, alongside upbeat sentiment regarding the strength of the U.S. economy following last Friday’s labor market data.
The 90-day suspension of tariffs imposed by the administration of President Donald Trump is set to expire on Wednesday, but it could be extended at least until August 1, according to statements from both the president and Treasury Secretary Scott Besant.
Both the United States and its allies and trade rivals appear eager to reach an agreement. China and the U.S. are moving to implement the framework of a previously reached trade deal by reviewing the export restrictions imposed on one another. Meanwhile, European officials stated last week that a draft agreement with the U.S. may be near, aiming to maintain base tariff rates at just 10%, according to The Wall Street Journal .
Markets appear largely unbothered by trade developments, given the flexible and seemingly open-ended deadlines and the lack of major surprises, according to analysts cited by Reuters . This easing of concern may lead gold to gradually lose the risk premium it had gained from fears of a global trade war.
Still, those concerns could return swiftly if negotiations fail and heavy tariffs are reinstated. The Washington Post reported that a potential U.S.-Vietnam trade deal may anger China and, in turn, reduce the likelihood of a broader deal between Beijing and Washington.
Additionally, the prolonged uncertainty itself may start to weigh on the U.S. economy, which could, over time, rekindle demand for gold as a safe-haven asset. The Editorial Board of The Journal noted cracks in the U.S. labor market that lie beneath the better-than-expected headline figures released Friday. The report revealed weak hiring in key private sectors, a decline in manufacturing employment, and a drop in labor force participation to its lowest level since 2022.
The Editorial Board called for dissipation of uncertainty around trade policy to encourage private sector hiring, as companies remain hesitant amid the current indecision in the White House. Another report from The Journal also warned that prolonged uncertainty could weaken the U.S. dollar, delay corporate investment and spending, and dampen business confidence.
On a related front, The Journal’s chief economics commentator Greg Ip criticized what he called “fiscal dominance” under Trump, where the Federal Reserve may be pressured to lower interest rates to ease the burden of the rising deficit caused by tax cuts. He warned this could undermine economic strength and increase inflation in the long run.
In my view, the early signs of a deteriorating U.S. fiscal position could become one of the key long-term drivers of sustained gold gains—even if markets remain complacent for now and equities continue climbing to record highs. This would not reflect an economic cycle, but rather a deeper shift in market fundamentals characterized by eroding confidence in the U.S. economy and its currency.
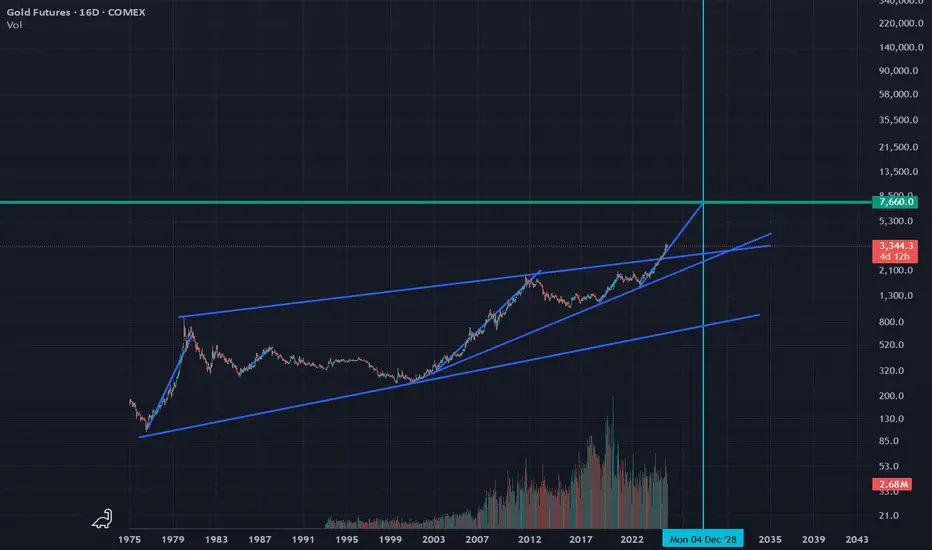
Gold to double in value over the next 3 years!Keeping in line with the massive dollar dump that is about to occur, it is gold that will be the biggest beneficiary.
If it keeps its current rate of advance, it will double in value before the end of '28!
#XAUUSD Bearish on GOLDLooking for shorts from these zone on XAUUSD, Will be looking for confirmation before entering.
GOLD WATAFALL INCOMINGOkay so this is called a channle and golds not holding it to well so down we go also with war pressues relaxing its a real GOLDKiller anyws use SL be safe and
have fun! XD
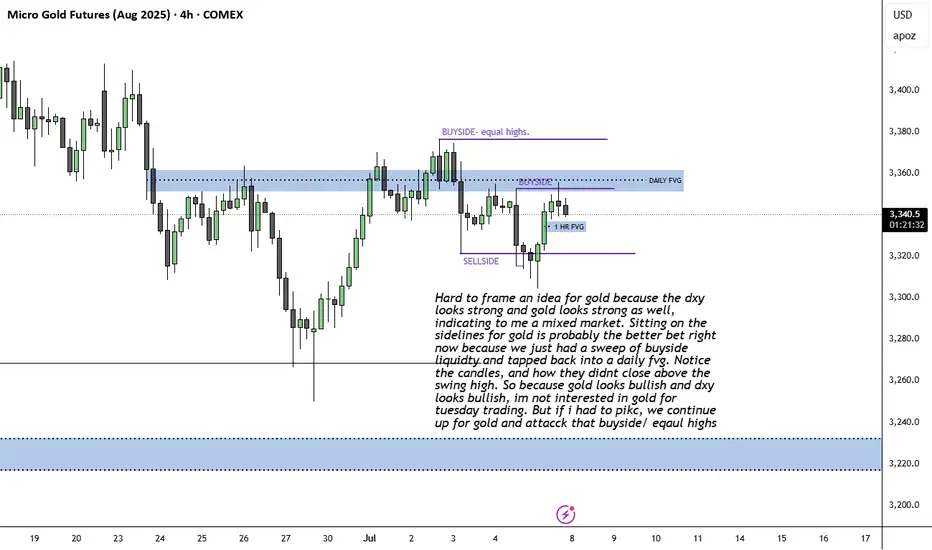
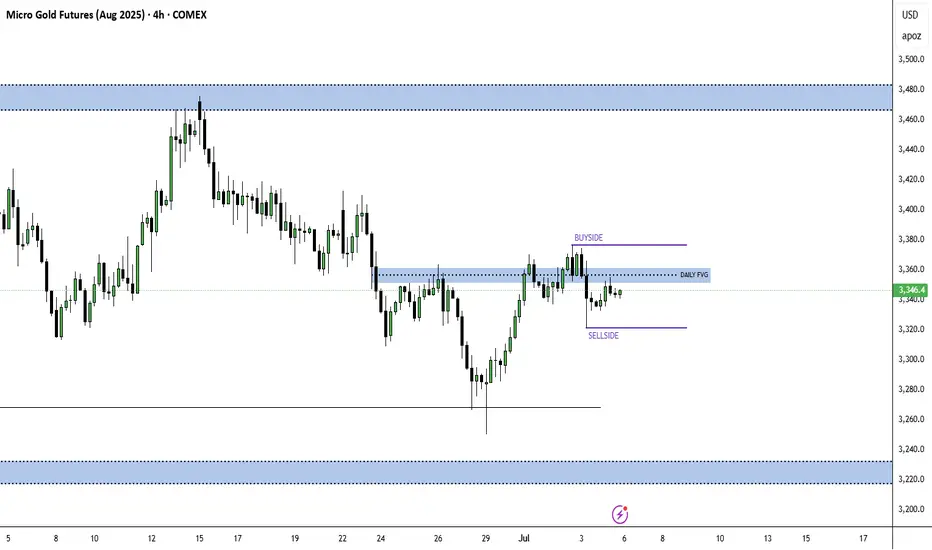
Mixed market for GOLDHard to frame an idea for gold because the dxy looks strong and gold looks strong as well, indicating to me a mixed market. Sitting on the sidelines for gold is probably the better bet right now because we just had a sweep of buyside liquidty and tapped back into a daily fvg. Notice the candles, and how they didnt close above the swing high. So because gold looks bullish and dxy looks bullish, im not interested in gold for tuesday trading. But if i had to pikc, we continue up for gold and attacck that buyside/ eqaul highs
Will The new Week kick off more bullish Pressure for GOLD?looking for more bullish activity this week but need to sit on my hands for now to see if they establish a Low for the week first. Once we see that and start to see HH's made then we can consider a entry to get in on the move. I cant rush it though. Have to be patient.

NEUTRAL ON Gold FOR NOWI dont see a clear direction for Gold just yet, I am on the sidelines, waiting for buy side or sell side to get ran first,
I am more bearish than bullish because Dxy seems to be cooling off from its down trend.
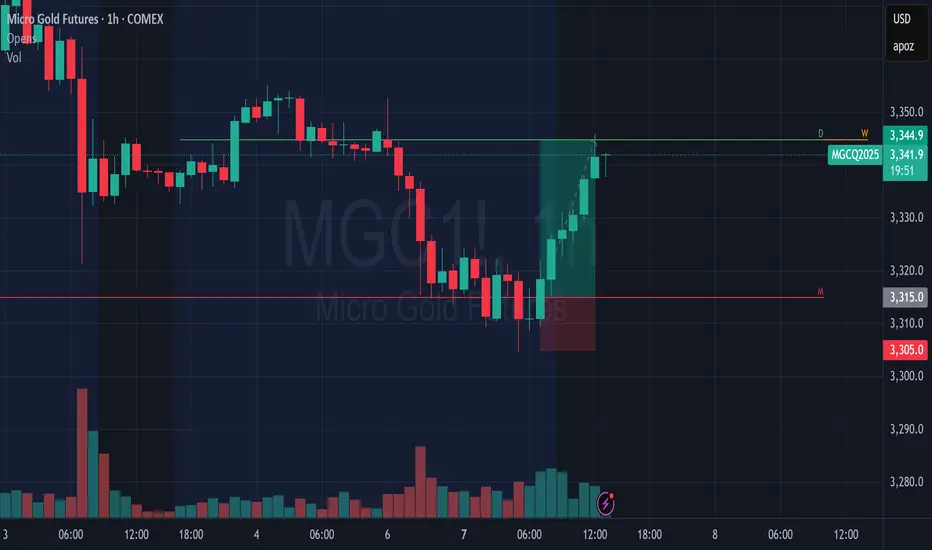
Buying the Dip or Catching a Knife? My Gold Setup Explained.Entered a long position on XAU/USD from the 1H demand zone following sharp intraday selling into a key support level. With gold hovering near $3,300 and a significant testimony from Fed Chair Powell on deck, the setup aligns with both technical rebound potential and fundamental uncertainty that could fuel upside.
The goal here is to play the liquidity vacuum left after aggressive positioning was cleared, with tight invalidation and asymmetric reward.
Technicals:
• Entry aligned with prior price inefficiency and confluence of multiple demand zones
• 1H structure shows clear deviation below the range with immediate buy-side response
• EMA channel flattening, indicating potential compression ahead of expansion
• First target: $3,352
• Risk-managed with defined stop-loss below $3,260
Execution Note: This is not a “hold forever” trade. It’s an opportunistic reaction to unwind + sentiment imbalance.
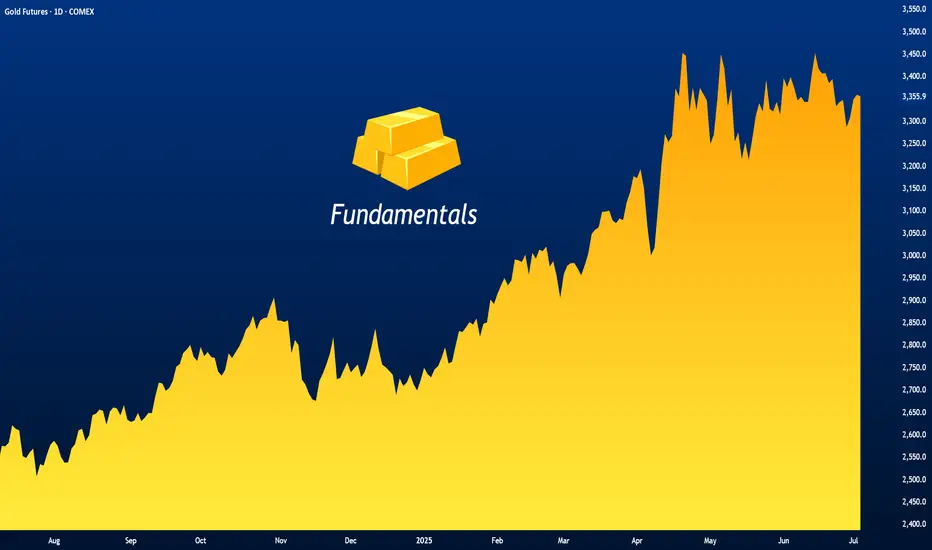
Fundamentals
• Gold saw a 25% surge in 2024 due to safe-haven demand and dovish policy, but enters 2025 under pressure from:
▫️ A strong USD
▫️ Higher cost of carry
▫️ Speculators taking profit
• Fed policy remains the core variable:
▫️ A hawkish tone from Powell could weigh on price
▫️ Rate cuts would likely revive bullish momentum
• Central bank demand remains supportive
• Geopolitical tensions (Russia-Ukraine, Israel-Iran) could trigger safe-haven bids again.
Bearish headwinds:
• Waning bullish momentum per RSI divergence
• Reduced rate cut expectations post-election
• Powell’s testimony could revive volatility either way.
This is a short-term tactical long, not a macro bet. With sentiment temporarily overextended and key support defended intraday, this is a high R/R window to exploit Powell-related volatility.
Let’s see how price reacts into $3,350+. Any sustained strength there would open room toward $3,400, while failure would confirm a retest of $3,260s.
Note: Please remember to adjust this trade idea according to your individual trading conditions, including position size, broker-specific price variations, and any relevant external factors. Every trader’s situation is unique, so it’s crucial to tailor your approach to your own risk tolerance and market environment.
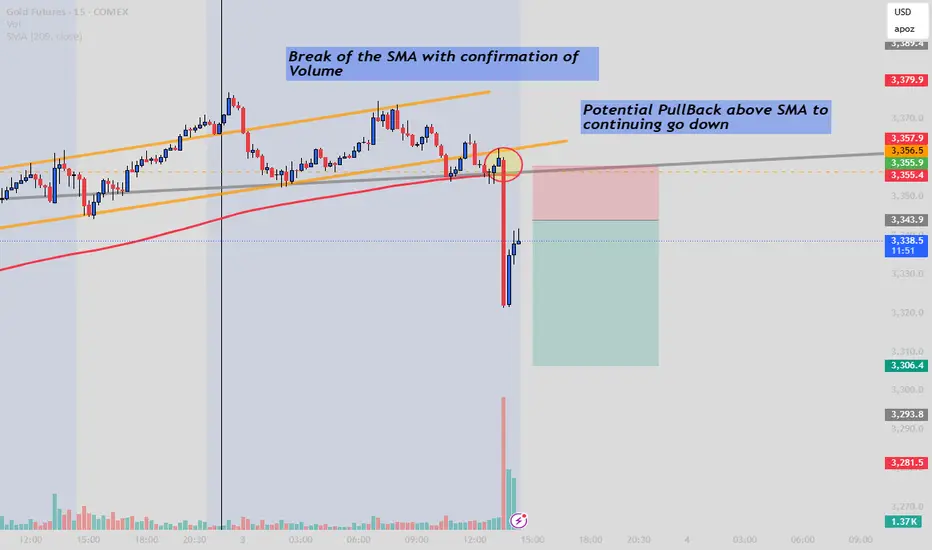
Gold Futures BOS does Bearish move might steps in?There is a breakout of the EMA with confirmation of rising Volume, which indicate a strong short position also with NFP shows strong job claims that's why we anticipated a fall in gold, especially for those who want to enter lastly you should consider waiting for a pullback to catch the second move. Follow GoldenZoneFX For more content and valuable insights.
Gold May Find Support From These Various FactorsGold May Find Support Amid Concerns Over U.S. Debt Sustainability, Economic Weakness, and Renewed Geopolitical Tensions
Gold prices are holding steady today, near $1,353 per ounce in spot trading, in what is expected to be a low-liquidity session due to the early closure of U.S. markets. This follows three consecutive days of gains.
The yellow metal’s subdued movement comes as markets await key labor market data that may offer further insight into the health of the U.S. economy, especially after the recent shock from ADP figures.
Gold continues to find support from several underlying factors that could sustain its upward trend this week. These include rising uncertainty around the long-term sustainability of U.S. public finances and the risk of renewed conflict in the Middle East.
Concerns over U.S. fiscal stability have intensified following the introduction of the “One Big Beautiful Bill Act,” which combines tax cuts with spending reductions. In an opinion article for The New York Times , former Treasury Secretaries Robert Rubin and Lawrence Summers warn of the bill’s potentially severe consequences, including persistently high interest rates, reduced business confidence, falling investment, and the risk of a financial shock that markets may struggle to absorb. This could also leave the economy more vulnerable to economic and geopolitical threats.
Such risks may erode investor confidence in U.S. government debt, potentially boosting gold’s appeal as a safe-haven asset even in an environment of elevated bond yields and prolonged high interest rates.
On the geopolitical front, the specter of renewed escalation in the Middle East looms, and this time, the consequences could be more severe. Amid conflicting reports and statements regarding the extent of the damage to Iran’s nuclear facilities, both sides appear to be preparing for the possibility of renewed hostilities.
Diplomatic efforts remain stalled, and hardline voices continue to call for a return to conflict. In an opinion piece for The New York Times, former National Security Advisor John Bolton described negotiations with Iran as ineffective and dangerous, calling instead for regime change and the use of force.
While previous rounds of conflict have not caused lasting damage to the global economy or energy supply chains, a new round may prove more disruptive. According to Reuters , Iran has reportedly loaded naval mines onto vessels, raising fears that it may attempt to close the Strait of Hormuz.
Such a move would cross a critical threshold and turning a contained conflict into one with global economic implications. The Strait of Hormuz handles over one-fifth of the world’s crude oil and liquefied natural gas exports.
However, Iran may avoid this step as long as its own oil exports continue flowing through the strait, as was the case during the last conflict in June.
On the trade front, there is growing optimism about the potential for new agreements that could ease tensions that have disrupted global supply chains and threatened U.S. and global economic growth. This optimism follows President Trump’s announcement of a trade deal with Vietnam.
There is also hope that progress can be made with China. Recent reciprocal steps, that involve the easing of restrictions on rare earth exports by China and some relaxation of U.S. technology export controls, suggest that the de-escalation agreed upon earlier in Switzerland could hold, potentially laying the groundwork for a broader trade agreement.
Samer Hasn
Gold is Setting up for another moveLooking for price to make some impulsive moves before we get active. Looking like they are trying to establish a low for the week before they go full on bullish. waiting for them to find that bottom.

Gold.. in the fog of global chaosNotes:
Markets for metals are at a ATH.
Global events are evolving rapidly.
Most of the time, war=raging gold prices
Markets are ripe to retrace and or maybe reverse at all. Taking setups on gold with a grain of salt.
Gold is an event driven market. I expect for now a consolidation until bearish signals show.

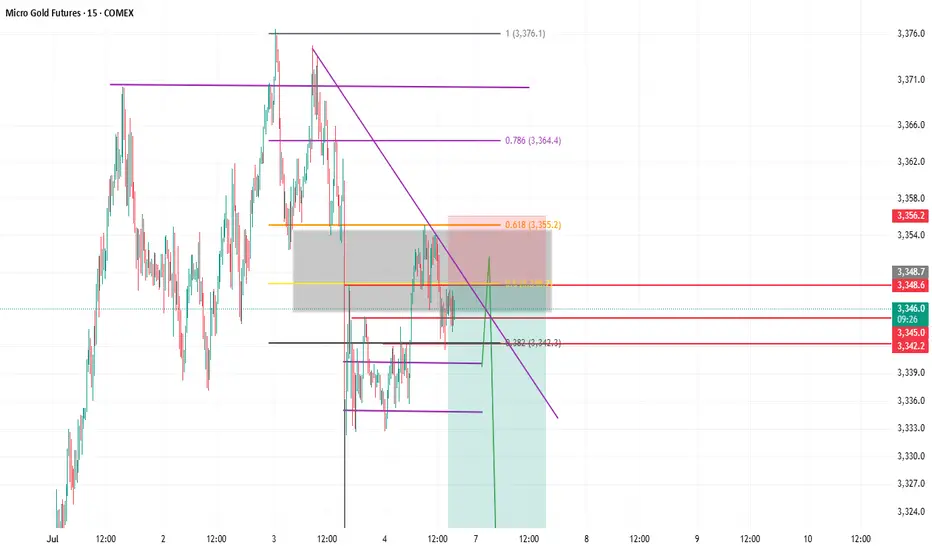
Beneath the Shelf Lies OblivionThis setup on MGC is a textbook example of what happens when structure, compression, and liquidity converge at a critical price shelf.
We’re currently sitting on top of a demand break zone near 3330, right at the intersection of a long-term ascending trend line and a descending supply-side compression line. This convergence zone is what I’m calling the Decision Point and the reaction from here will likely dictate the next directional leg.
Bearish Scenario – Breakdown Play
If price breaks and closes below 3330, I’m looking for a clean short setup triggered by:
- Loss of structure at the imbalance shelf
- No reaction from buyers at the previously defended zone
- Bearish pressure from HTF supply overhead (3385 zone)
- Momentum break from recent liquidity sweep at 3360
Trigger Entry: Below 3327 (post-break retest)
Stop: Above 3338 (invalidates reclaim)
TP1: 3305 (minor demand pocket)
TP2: 3285 (full move into HTF demand)
TP3 (optional): 3275 (tail end of imbalance)
Price would be transitioning from demand acceptance to supply dominance. The HTF supply above has been respected, and sellers remain in control if 3330 gives out.
Bullish Scenario – Reclaim Play
If price holds the 3330 demand shelf and reclaims structure with strength, I’m interested in a long position toward resting liquidity above.
Trigger Entry: Above 3342 (engulfing + reclaim of broken structure)
Stop: Below 3325 (demand failure = no-go)
TP1: 3360 (liquidity sweep)
TP2: 3385 (HTF supply retest)
If buyers defend this compression shelf, this could become a failed breakdown setup which often results in sharp squeezes. There’s also layered liquidity above 3360 from late sellers that could get raided quickly.
Let me put it in context:
HTF Zones Labeled: These areas are not just visual, they’ve driven major moves previously. I'm using them to anchor bias.
Compression Point: This is where your edge lies. Price is coiled between trendlines and major levels meaning the breakout will be decisive.
Volume Ignition Expected: Whether long or short triggers, expect strong follow-through due to the nature of the buildup.
No bias here just structure, zones, and execution plans. I’ll trade whichever side triggers first with confirmation, not prediction. This is the type of setup where patience pays more than opinion. Would love to hear how others are seeing this are you leaning with the shelf or looking to fade the break?

Why says they want to short gold again, line up in hereLol, so far whales keeps manipulating the price to stop me out 🙄.
Nah, fr, i will short gold again today for sure, iam just waiting to see a confirmation that this is even the right decision.
But so far it looks massively short, it could yield anything from 1:3, or 1:4. Depends on the setup.
Wait for confirmation, will make sure that whales dont get me this time. LOL

Gold Took the Bait Then Got Body BaggedThis afternoon I stepped outside my usual mechanical system and ran a classic: the Opening Range Breakout (ORB) on MGC just to see if gold still respects the old-school plays.
Marked the range of the first 15-minute candle, waited for the break and confirmation close, then entered on the short side.
Asset: Micro Gold Futures (MGC1!)
Timeframe: 15-Minute
Strategy: Opening Range Breakout
Session: NY
Bias: Short
Trigger: Bearish 15-min close below the ORB low
Notes
ATR Expansion: Signalled volatility coming off the open (range >20 ticks)
Liquidity Trap: Gold swept ORB highs before dumping a classic trap-and-flush
Volume Confirmation: Delta turned aggressively negative at the break
Risk-Reward: Tight stop above range, clean 1:3 move into session lows
ORB: Dumb-Simple, Still Deadly
ORB is one of the simplest tools in a trader's playbook and that’s what makes it dangerous (in both directions). When it works, it works. You define the opening range, wait for price to break out and confirm, and ride the move.
But here’s the nuance:
Gold LOVES to fake one side before exploding the other. It’ll sweep liquidity, bait breakout traders, then detonate in the opposite direction. Today was a textbook clean sweep of ORB highs, then a brutal reversal and breakdown.
I usually lean on mechanical, model-based strategies, structured entries, rule-based exits, logic-driven setups. But I’m not blind to price. Having a few flexible strategies like ORB in the toolkit gives you options on days where market intent is obvious. So… does ORB actually work? Here's what the research says:
- Al Brooks (Price Action Trading)
ORB-type plays win 55–60% of the time when confirmed with price action and managed properly.
- Linda Raschke (Street Smarts)
ORB entries rated highly during volatility expansions especially in futures.
- Quantified Strategies (S&P 500 ORB backtest)/b]
57% win rate with basic 1:1 R:R and no filters.
Internal Bookmap/Tradovate tracking on MGC .
Fake outs occur in 30–40% of ORB plays, especially during thin liquidity or low-news days. But let’s be real that 55–60% win rate is open to interpretation. It depends on the confluences. Are you using delta confirmation?
Are you filtering by session or volatility? Are you waiting for a close outside the range or just guessing? ORB works if you work it. The strategy isn’t magic. The execution is.
The twist with today wasn't a "trend continuation" move. It was a rejection. Gold baited breakout longs, then pulled the rug. This is where mechanical structure meets tape intuition.
Retail chased. Price snapped. Quant stayed calm and shorted the flush.
What Do You Think?
Do you still trust ORB? Or is it a trap most days? Do your stats back it up or have you evolved beyond it? Let’s open it up. Drop your ORB rules, tweaks, or horror stories below. I’ll reply to every serious one.
