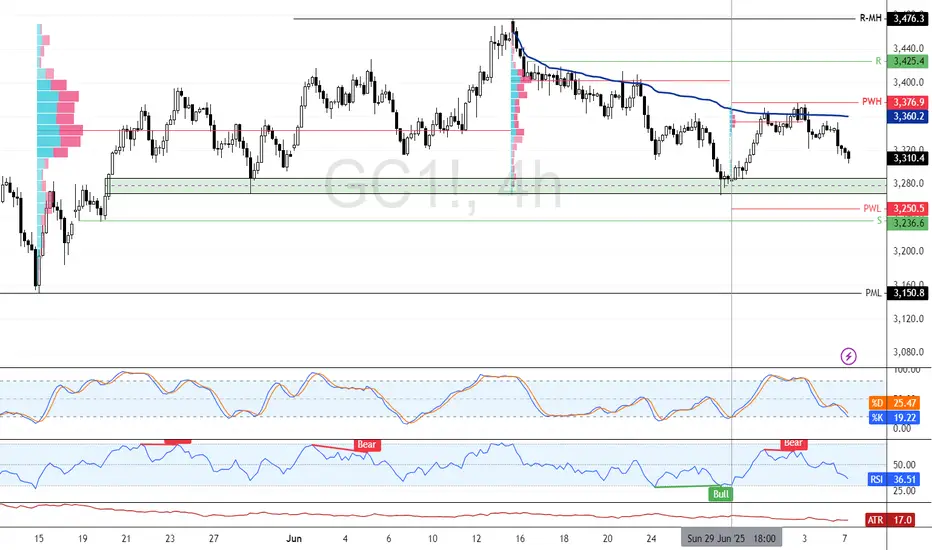
Gold Faces Pressure After Rejection at $3,376 ResistanceFenzoFx—Gold dropped from the $3,376.0 resistance, a level reinforced by the anchored VWAP. June’s bounce at $3,250.0 marks a key support for the broader bullish trend.
If the $3,250.0 support holds, XAU/USD can potentially resume its uptrend. However, a close below $3,236.6 would invalidate the bullish scenario.
XAUUSD1! trade ideas
MGC UPDATE 7/2/2025COMEX_MINI:MGC1! played out as expected weekly level was respected and it it clear because of BFI sponsorship Thanks for the people who gave some interest to my last post always happy to help another fellow trader
tradingview.sweetlogin.com
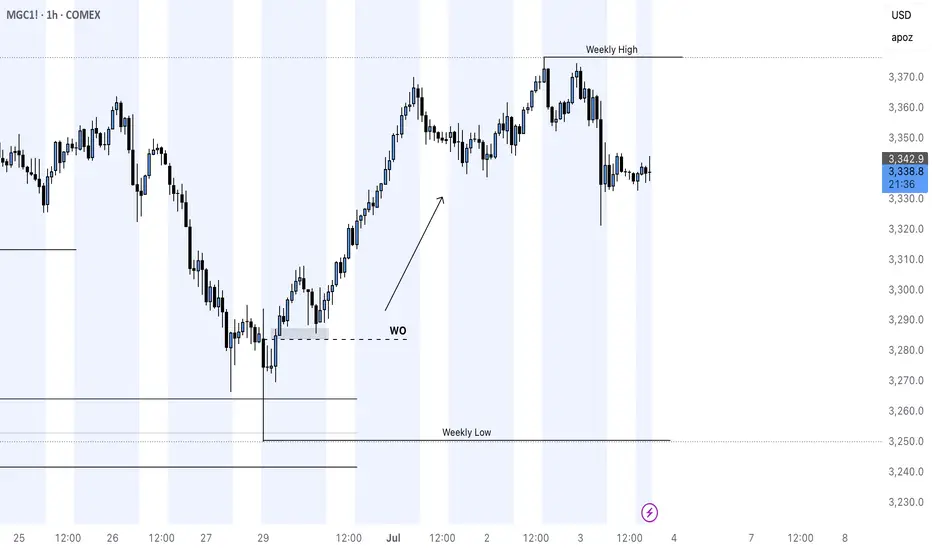
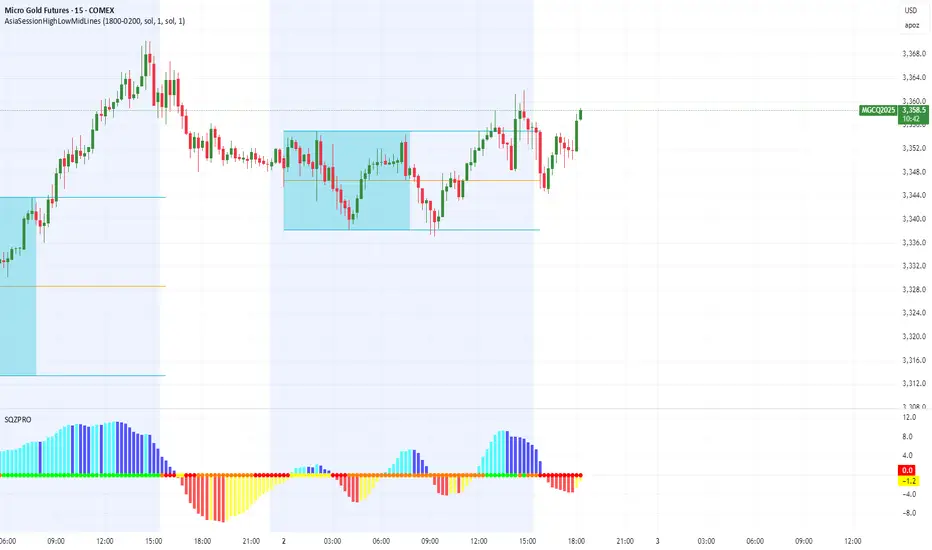
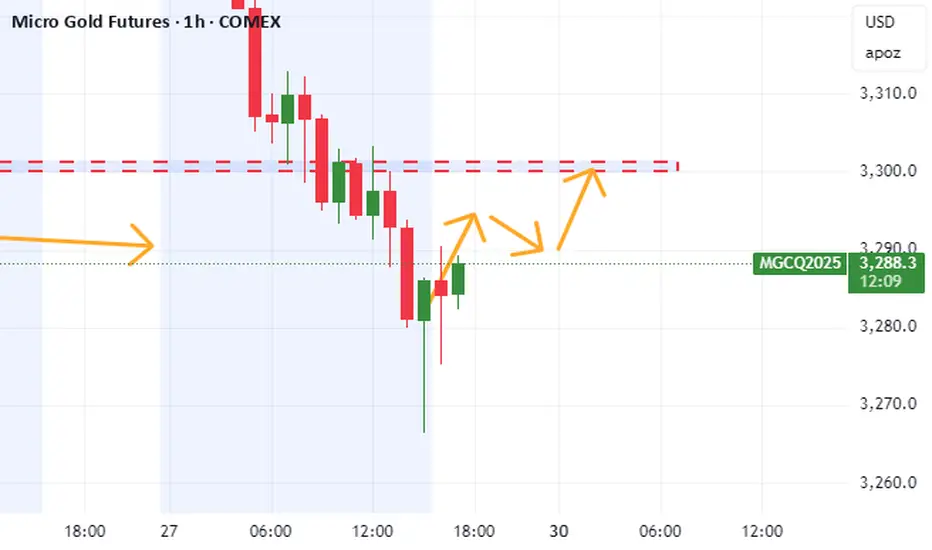
Gold is Pushing Bullish but is it really ready???This looks like a early move to move full on bullish. I feel like it might need to sweep the low from mid week before they really ready to go bullish. waiting for things to show a bit more clear during the Kill Zone.

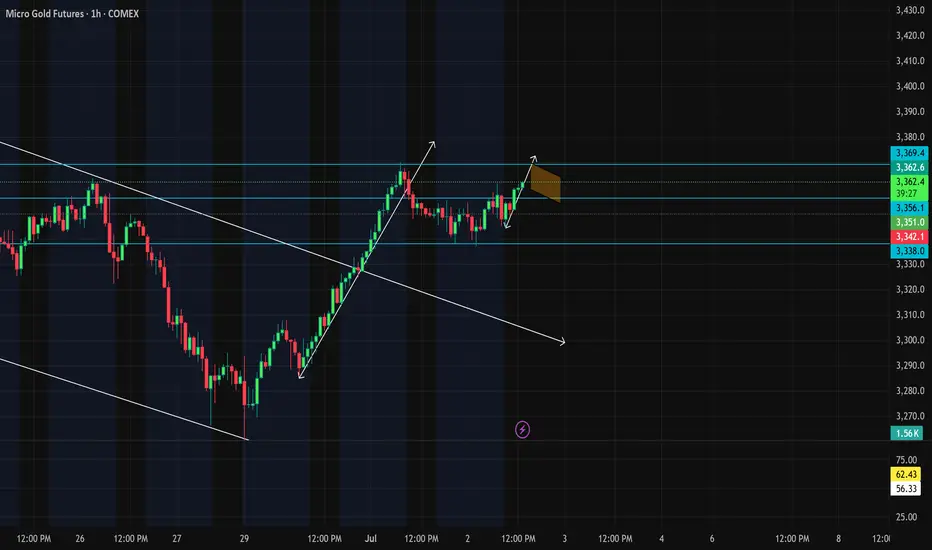
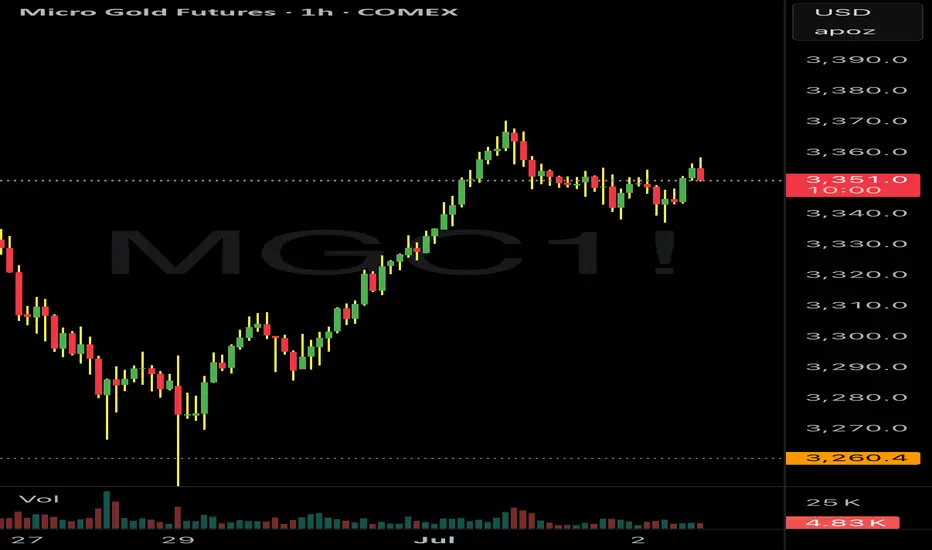
$MGC1! cup and handle forming.will this cup and handle play out on the 1HR and make a rip back up around 3400.?
Gold Market Update – Buy Signal (Swing Trading)A buy signal has been confirmed on the gold market for swing trading. if we want to scalp, it’s better to focus only on long opportunities — short positions could be too risky for now.
Big buyers are active, aggressive, and clearly pushing the price up.
As for targets, I prefer not to give fixed levels. I always monitor the market in real time to see how big buyers and sellers are reacting.
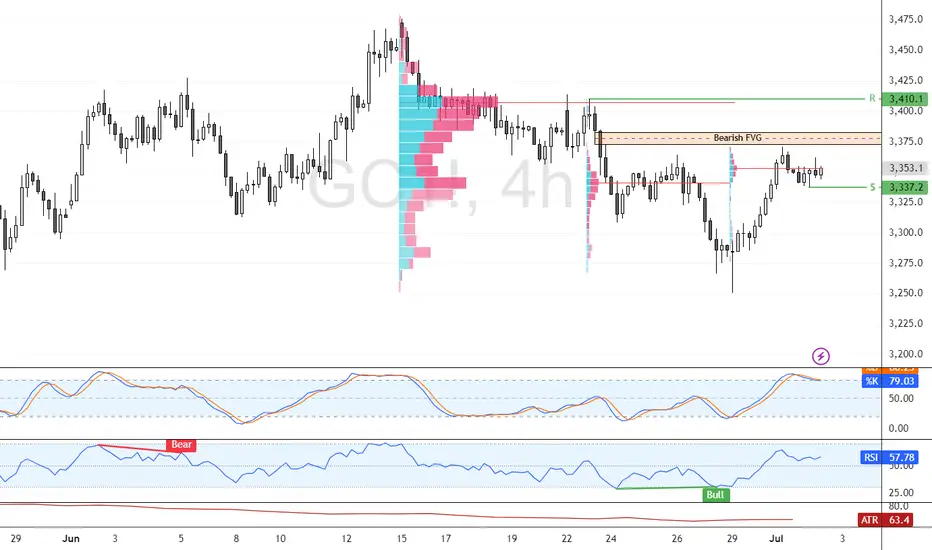
Gold Holds Ground as Bulls Eye $3,410 Volume ZoneGold built support at $3,337.2 in today's trading session. However, the uptrend is capped, and the price remained below the Bearish Fair Value Gap.
From a technical standpoint, XAU/USD outlook remains bullish above $3,337.2. In this scenario, the target is likely to be the next high volume area, which stands tall at $3,410.0.
Please note that the bullish outlook should be invalidated if Gold closes and stabilizes below the $3,337.2 support.
Gold back to $3300 - Week of July 4thPretty clear cut and dry, we have a significant mark down followed by a pump overnight.
Today and into tomorrow I’m looking for a drop back to the $3300 levels.
How to Trade Double Tops & Bottoms in TradingViewLearn how to identify, validate, and trade double top and double bottom reversal patterns using TradingView's charting tools in this comprehensive tutorial from Optimus Futures. Understanding these classic chart formations can help you spot potential trend reversals and capitalize on contrarian trading opportunities in the futures markets.
What You'll Learn:
• Understanding contrarian vs. continuation trading strategies and when to use each approach
• The psychology behind buying low and selling high through reversal pattern trading
• How to identify double top and double bottom formations on any timeframe
• Key characteristics of valid double tops and bottoms, including volume confirmation
• Using TradingView's XABCD pattern tool to validate potential double top/bottom setups
• Real-world example analysis using crude oil futures charts
• Risk management techniques for trading reversal patterns
• How to calculate appropriate entry points, stop losses, and profit targets
• Setting up 1:1 risk-reward ratios for mathematical trading edge
• Understanding win rate requirements for profitable pattern trading
• How double bottom patterns work as the inverse of double top formations
This tutorial may benefit futures traders, swing traders, and technical analysts interested in contrarian trading strategies and reversal pattern recognition. The concepts covered could help you identify potential turning points in market trends and develop systematic approaches to trading these classic chart formations.
Visit Optimus Futures to learn more about trading futures with TradingView: optimusfutures.com/Platforms/TradingView.php
Disclaimer:
There is a substantial risk of loss in futures trading. Past performance is not indicative of future results. Please trade only with risk capital. We are not responsible for any third-party links, comments, or content shared on TradingView. Any opinions, links, or messages posted by users on TradingView do not represent our views or recommendations. Please exercise your own judgment and due diligence when engaging with any external content or user commentary.
This video represents the opinion of Optimus Futures and is intended for educational purposes only. Chart interpretations are presented solely to illustrate objective technical concepts and should not be viewed as predictive of future market behavior. In our opinion, charts are analytical tools—not forecasting instruments. Market conditions are constantly evolving, and all trading decisions should be made independently, with careful consideration of individual risk tolerance and financial objectives.

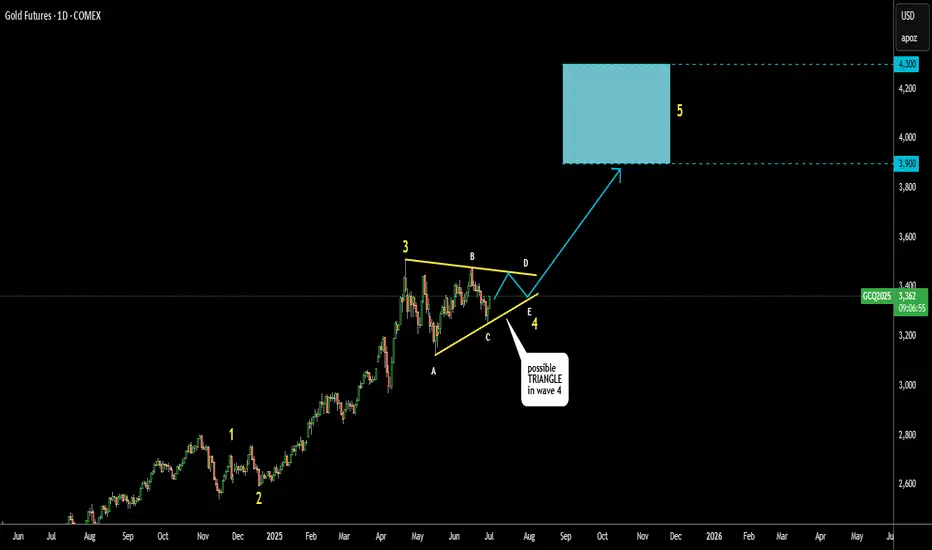
Gold Update: Possible Triangular Consolidation Before New RallyIt looks like corrective wave 4 is in the making within a large Triangle
3 waves A, B and C already emerged in 3-waves structure
which confirms triangle
Wave D should stay under the top of wave B
Wave E could either touch or break down the support line
It should keep above the valley of wave C
Target area changed higher as this consolidation tends to narrowing within a
contracting triangle.
Lowest target now $3,900
Optimistic target is at $4,300
Breakdown below $3,123 would invalidate the pattern
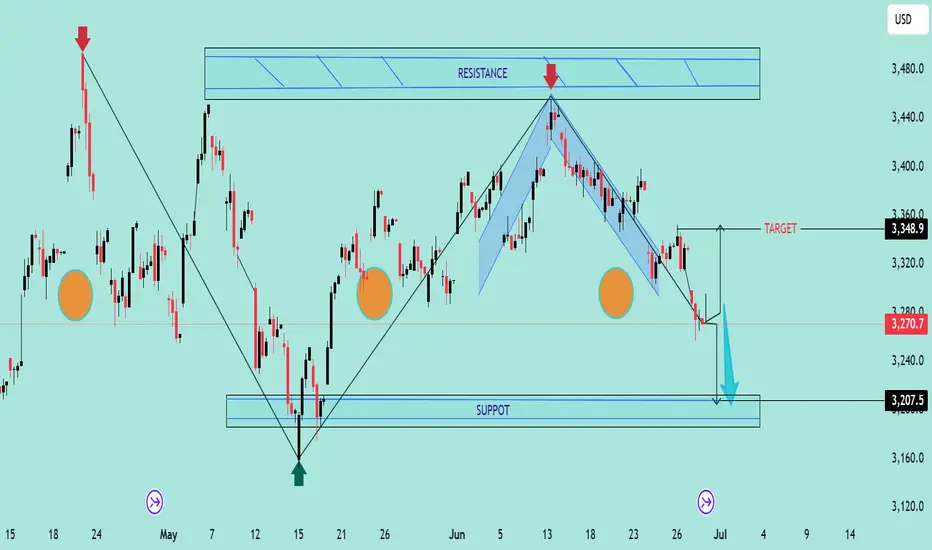
Double Top Breakdown at Resistance ZoneThe chart reveals a classic Double Top pattern formation near the 3,360–3,480 resistance zone, followed by a clear bearish rejection (highlighted with red arrows). This confirms the presence of strong supply pressure in that region.
🔍 Key Technical Highlights:
🔺 Double Top Pattern
The price formed two swing highs near the resistance zone, failing to break above.
After the second peak, the price started declining, confirming the reversal pattern.
📉 Bearish Channel
The recent downtrend is contained within a descending channel, with consistent lower highs and lower lows.
Price broke below the neckline of the double top pattern around 3,270.
🎯 Target Projection
Based on the height of the double top pattern, the projected downside target is near 3,207.5, aligning perfectly with the support zone marked below.
🟠 Historical Support Areas
The large orange circles indicate key reaction points, confirming that the 3,207–3,220 area has acted as support in the past.
📊 Outlook:
If the current bearish momentum continues, price is likely to head towards the support target zone at 3,207.5. Any pullback toward 3,320–3,350 could provide a shorting opportunity with stops above the recent highs.
🔧 Bias: Bearish
📍 Resistance: 3,360–3,480
📍 Support: 3,207–3,220
📍 Target: 3,207.5
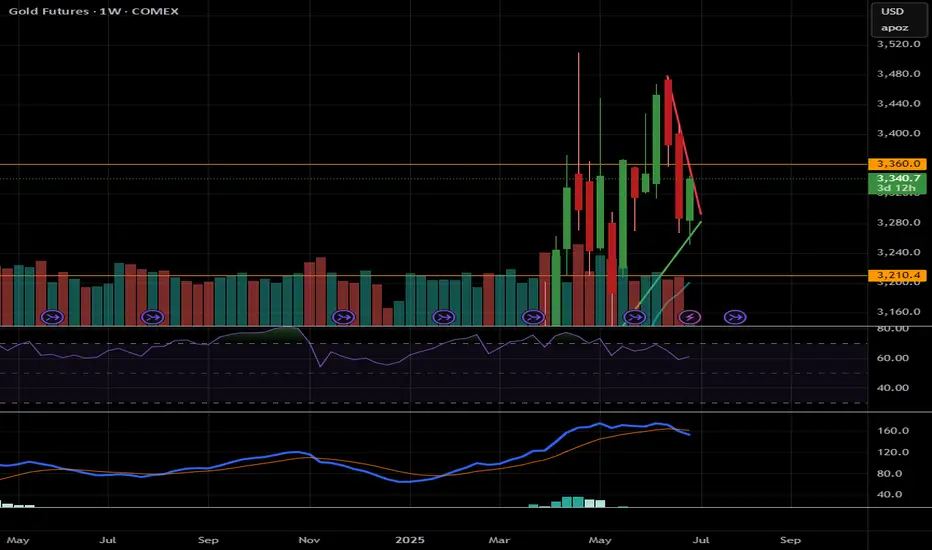
Gold, GC!, Sideway to the Downside (Long Term)06/30/2025, 10:30 PM PT
GC! is currently at its max around 3,500.
On the Weekly MACD, the crossover between MACD lind signal line already happened. There is also a bearish divergence on weekly chart.
On the Daily chart, RSI just crosses below 50 on RSI, and MACD shows weakness on the bull (it still not in the bear's territory just yet).
Reversasl to bear side may happen if price stays below 3,200
Bullish will continues if price break out of all time high
Current range for big timeframe from 3,200 - 3,500
Plan for swing trade:
Bullish Case (short term): break trendline. If hold above 3,360, price could go up to 3,400 -> 3,450
Bearish Case (short term): If price rejects and stays below 3,360, price could go down 3,310 -> 3,280
***Disclaimer: This analysis and trade plan are for educational and informational purposes only and should not be considered as financial or investment advice.
Whats the Play for the week? Are we bullish?Looking for more bullish activity to continue. Just need to see price confirm if it is indeed ready to proceed. if we can find a solid entry we will rock with it. but not trying to force anything.

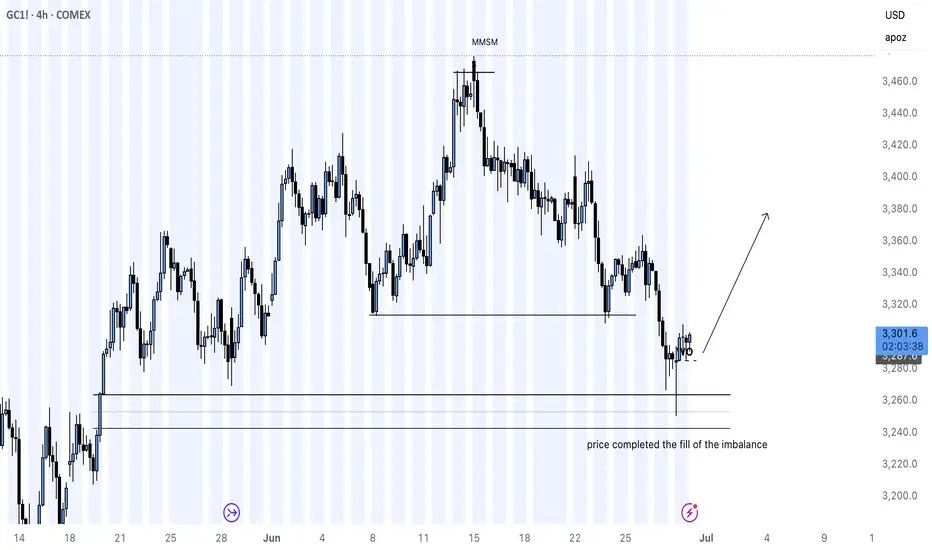
GOLD LONG IDEA MARKET STRUCTURE CHANGEgold futures were on a full sell off due to ongoing global turbulence in the month of June macro news is there to show the bigger picture but price tells the full story
imbalance was filled and the week opened with a bearish candle closing above 3,250 COMEX:GC1! price range now it is time to see It play out to the buyside for the precious metal
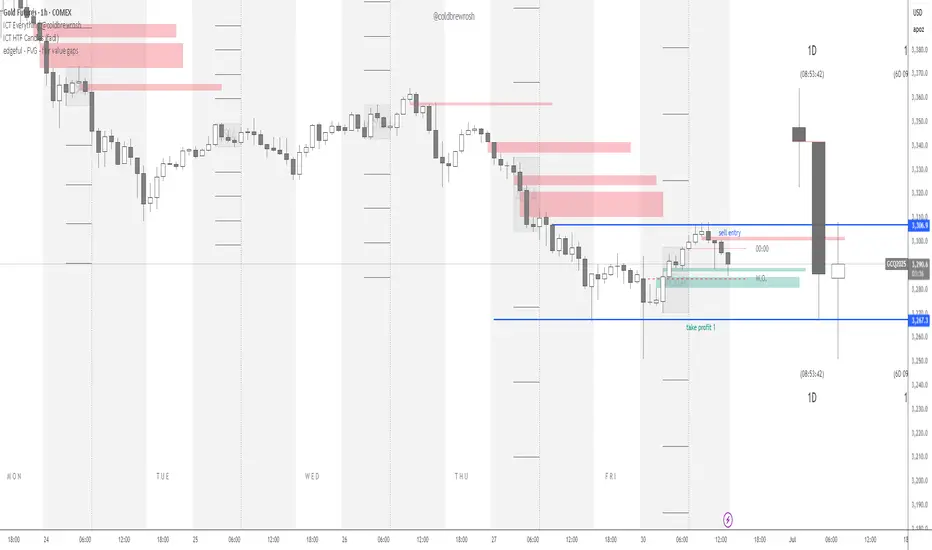
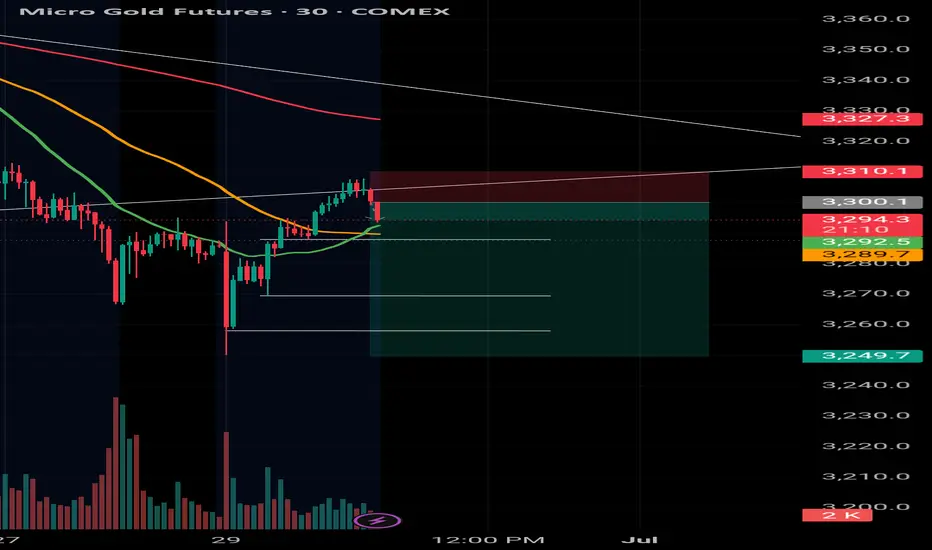
Short GC futures at 3,290.Strategy: Short GC futures at 3,290.
Entry: 3,290 (near current price, aligning with resistance).
Target: 3,250 (support level, 1.2% downside).
Stop: 3,310 (above resistance to limit risk).
Rationale: Bearish technicals (RSI divergence, declining open interest) and USD strength support a short-term pullback, with US Retail Sales as a potential catalyst.
Broken uptrend on the dailyBreak and retest of the uptrend on the daily.
Entered short position after retest break.
STEEL-NERVE SETUP – ARE WE RE-LIVING GOLD’S 2020 BEAR-TRAP?Retail sentiment is ultra-bearish, positioning is cooling, Silver is outperforming and the S&P 500 is screaming risk-on … exactly the cocktail we saw in June 2020, right before Gold & Silver exploded higher.
1️⃣ WHY THIS FEELS LIKE 2020 AGAIN
2025 (now) 2020 (pre-rally) Read-through
> 70 % of TradingView ideas are bearish 💬 > 60 % were bearish Crowd may be offsides again
Managed-money net-longs -18 % from April peak 📉 -25 % from March peak Powder for fresh longs
First monthly ETF outflow (-$1.8 bn) 🚪 Record inflows Capitulation, not euphoria
Gold/Silver ratio down to 94 ⚖️ Fell to 95 Silver leadership = bottoming tell
S&P 500 at new ATH 📈 S&P at new ATH Risk-on backdrop identical
2️⃣ WHAT’S DIFFERENT THIS TIME
Real 10-y TIPS yield +0.7 % (2020: -1 %) → smaller monetary tail-wind.
Gold already at inflation-adjusted ATH → upside could be shorter & sharper, not a fresh super-cycle (yet).
3️⃣ CHECKLIST FOR A REAL BEAR-TRAP
Signal Watch-level
Gold holds $3 200–3 250 (100-d SMA + fib) Daily close above zone
Gold/Silver ratio breaks < 90 Momentum confirmation
CFTC net-longs < 150 k Position flush
ETF flows turn positive Fear → FOMO
S&P stumbles / vols spike Classic risk-bid for Gold
Need 3 of 5 boxes ticked to validate the squeeze thesis.
4️⃣ CATALYST CALENDAR
3 Jul – NFP: sub-75 k print could fire the opening salvo.
9 Jul – Tariff freeze decision: escalation would revive safe-haven demand.
15 Jul – CPI & 30-31 Jul – FOMC: dovish turn + soft data could complete the squeeze.
Disclaimer: This post reflects my personal opinion for educational purposes only; it is not financial advice. Trading futures and commodities involves substantial risk and can lead to total loss of capital—do your own research (DYOR) and consult a qualified professional before acting.

$GC / $MGC / Gold - Weekend Update - 6/29Hello fellow gamblers,
The target for the ABC retracement has been hit and we are now looking for a reversal confirmation to enter any buying positions.
- The target for a possible Wave 1 of a new cycle will be above 3402.
- 3283 level needs to hold. A break of this level could take price lower towards 3208 to fill the VP gap.
- Levels to watch: 3208 - 3283 - 3357 - 3418

Will Gold Break out for the New Month this week?I was anticipating these possible sweeps. with it being the end of the month I'm thinking I might need to do more watching for now than positioning. waiting for the market to show its hand on what it wants to do next.

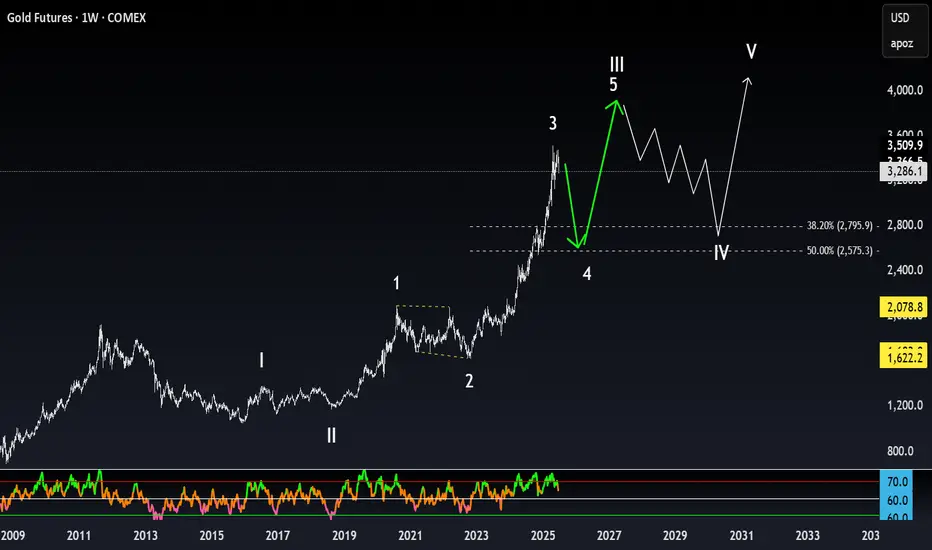
Navigating Gold Futures: Support, Resistance, and ProjectionsCOMEX:GC1!
The chart appears to depict a clear five-wave pattern: I, II, III, IV, and V.
Waves I to III show strong upward movements, indicating bullish sentiment.
Wave IV looks like it could be a corrective phase, with a potential dip before another upward movement in Wave V.
Support and Resistance Levels:
The horizontal lines around 2,800 and 2,575.3 indicate critical Fibonacci retracement levels (38.20% and 50%).
If the price approaches these levels during the correction, they could serve as support, making it a potential buying opportunity.
RSI Indicator:
From the bottom indicator (RSI), we can see fluctuations in momentum, which can aid in timing trades.
Look for interpretations of the RSI: if it trends towards the extremes (overbought/oversold), that could signal reversal points.
Future Projections:
Should the market respect the outlined support levels, Wave V could potentially push towards a new high above 4,000 as indicated by the upward projection.
Market Sentiment:
Overall, the pattern suggests a bullish outlook long-term, but caution is warranted during corrective phases as prices might retrace towards support levels.
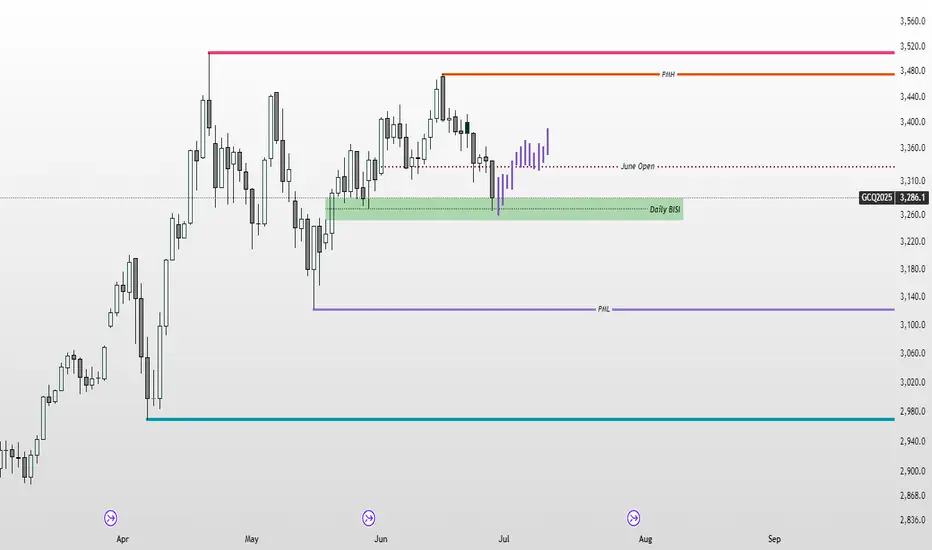
Is time to be a Gold Bull?Gold has been steadily repricing lower prices since June 16th after it took out May 16th's High. On Friday, June 27th, Gold moved into the Daily BISI (+FVG) zone and retraced upside. We may see another lower prices to purge the sellside liquidity before reverse upside for the short term. I don't expect another ATH next month, unless we have the right catalyst to do so. I'd anticipate for the price action to remain inside a large consolidation within the current Dealing Range as indicated in the chart. My Bullish case will be if price breaks above the 3500 convincingly, and the Bearish case if it breaks below 3120 convincingly also. In the meantime, we'll have to be satisfied playing tic tac toe inside the range. Don't get married to a strict bias at this time. Stay nimble, and let the price presents itself to you.
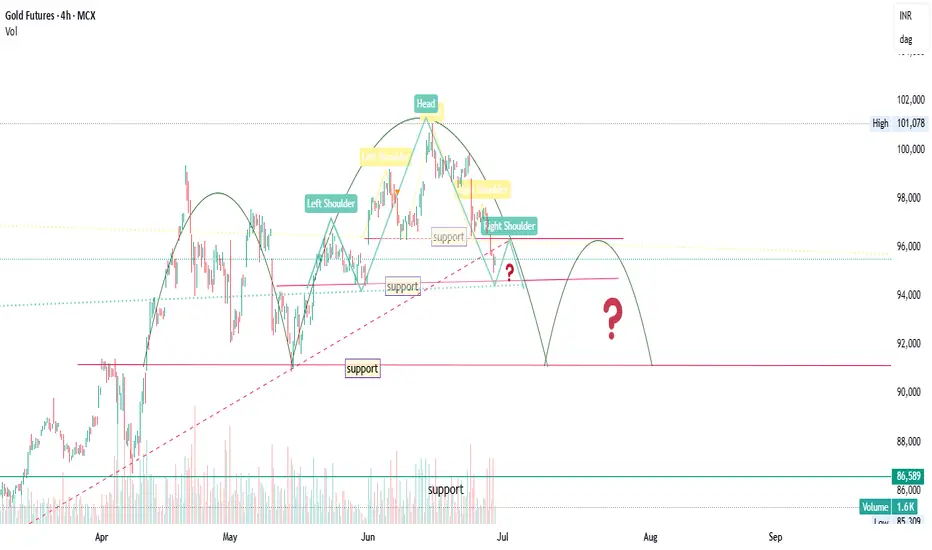
Gold 4H-figment of my imagination. Chart Overview:
Timeframe: 4H (MCX)
Current Price: ₹95,524
Volume: 1.6K
Trend: Short-term bearish
📉 Observations:
1. Break of Support Zones:
Multiple support zones have been drawn on the chart:
Around ₹96,200, ₹94,700, ₹91,800, and finally near ₹86,600–82,200.
Price is now trading below the ₹96,200 support, showing clear weakness.
2. Structure:
This looks like a lower high – lower low formation.
Recent price action has broken previous swing lows, indicating bearish momentum continuation.
3. Next Key Supports:
₹94,700 – could act as the next immediate support (minor bounce possible)
₹91,800 – stronger historical zone
₹86,600 to ₹82,200 – major demand zone (strong support last seen in April)
4. Volume Analysis:
Volume hasn’t spiked significantly on the recent fall, suggesting no panic yet, but also lack of buying interest.
📌 Conclusion:
The trend is weak and corrective, favoring sell on rise until price reclaims ₹96,200 convincingly.
Safe buy zone: Near ₹91,800–₹86,600, if price shows reversal signals.
Watch out: If ₹91,800 breaks, ₹86,600 or even ₹82,200 could be tested.
Gold Trade Suggestion
With a 90% win rate on recent gold trades, I recommend a long position.
Target 1: Around 3290.6
Target 2: Around 3300
Strong buying pressure is present in the market — big buyers are here and pushing with force.
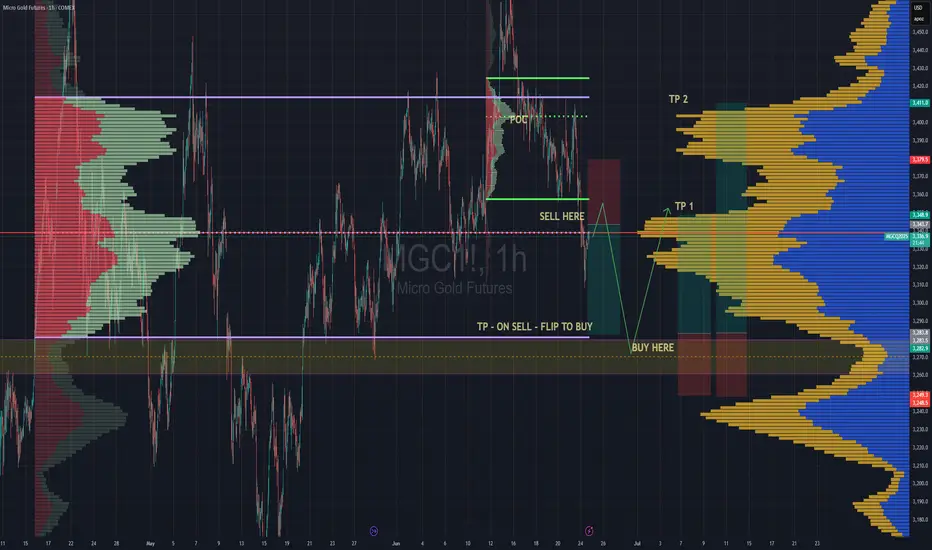
Long & Short Entry Forecast For GoldCooling war tensions seem to be cooling the Gold bullish rally as well.
But we're still in the same range since April 15th and will likely stay in the range until further notice *or the next tweet*
The Sell entry is great now cos we're near the top of the high volume node, so even if we consolidate around that POC this sell entry will still be putting us closest to the top of the node.
Hold your sell and TP at the VAL . We have a very deep low volume area there and its being a point of support since April. So we can place bets with small risk on hoping it holds cos if it doesn't, it wont be pretty. That is still the best place to buy regardless. So manage your risk accordingly
TP 1 for the Buy trade is at the POC , which also happens to be the top of the huge volume node. Totally make sense to take a decent chunk of profit of your position there, then move you stop loss into profit and grab some pop corn. Depending on the news , the best case scenario of for the uptrend is to continue all the way up to TP2 which is at the VAH
Secure the bag :)
Enjoy