BITCOIN trade ideas
BTC Touching Heights !BTC Extremely bullish. BTC analysis shows that it touch supply zone of 107500 and later went to cross the day before previous day high which was residing on 109,684 and then swept previous week high which was 110,600 with strong buying. It hinted crossing the all time high. After crossing all time high of 111,900 gave a change of around 6000 dollars , At this position the BTC outlook shows it may show reversal of around 4K dollars change. The possibilities for the BTC are shown here. Take risk accordingly.
Disclaimer : It isn't a financial advice check my analysis and decide on your own.
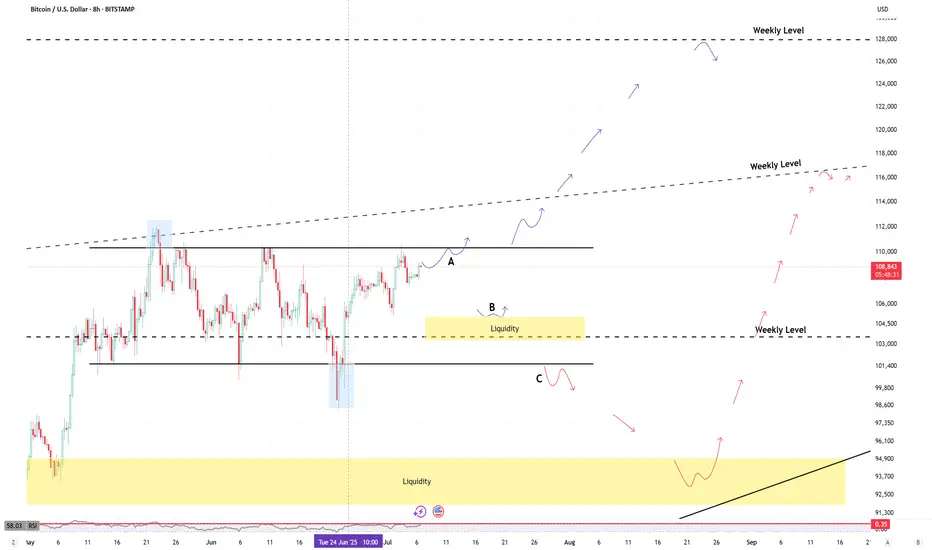
BTC Summer Roadmap: Key Levels & Breakout ScenariosBTC has retested the weekly resistance trendline (around $114K) that has been in place since February 2021. Over the past 4 years, this trendline has been tested four times, and a fifth retest appears imminent in the short term.
Historically, a fifth retest often leads to a breakout. If that breakout occurs, the next major target for BTC is around $128,000.
That said, the market rarely moves in a straight line.
As outlined in the chart, I’ve considered three potential scenarios for BTC to unfold this summer.
New trades will be based on these movements, with optimal entries either at the yellow-highlighted zones or upon a confirmed breakout above the current weekly resistance.
Disclaimer:
This analysis is based on my personnal views and is not a financial advice. Risk is under your control.
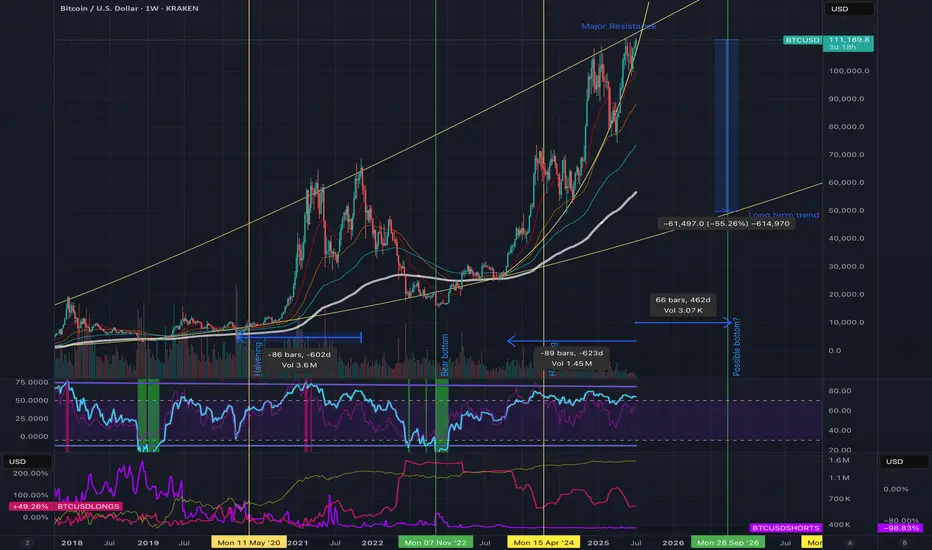
End in sight, Bull run near complete, don't be fooled. Bitcoin has experienced an incredible surge, rising from $15,000 to over $111,000 in this bull cycle so far. I expect the market peak to be around $114,000 to $115,000, with historical trends indicating strong resistance at these levels. As a long-term Bitcoin bull who has navigated through multiple cycles, I see several indicators suggesting we might be nearing a market top.
Firstly, this bull run has lasted 623 days, with only 462 days remaining until the predicted next cycle bottom. This could lead to a significant correction in the short term, potentially dropping prices by at least 50% down to below $40,000. Additionally, trading volume is declining; although exchange volume is decreasing, the number of trades per day is also dwindling. This means there’s less buying and selling pressure in the market. If this trend shifts to more selling pressure amidst such low volume, we could see a rapid decline. This scenario seems to align with what market whales may be anticipating.
MicroStrategy (MSTR) is certainly supporting the market, along with new institutional investors. However, we have yet to fully assess the impact of tariffs and other economic factors, which could result in fewer people willing to invest, especially in high-risk markets.
The Net Unrealized Profit/Loss (NUPL) has been high, remaining above 66 since March 2024, which also suggests that a correction is due, as many holders are currently in profit. Although institutional investment has been steadily increasing, we are now observing a plateau in the Accumulation/Ddistribution chart. The number of BTC long positions is decreasing, while shorts remain very low, indicating a lack of confidence that Bitcoin will rise significantly higher. This low interest in both longs and shorts suggests that market pressure could shift soon.
ETF inflows have remained stable, but profit-taking is likely to occur as investors seek to increase their positions in the bear market. While we all love Bitcoin and want the rally to continue, it's crucial to remember that a bear market will eventually happen, along with the next halving—it's just a matter of timing.
Looking at the charts, if anything signifies a market top more than “Laser Eyes,” it could very well be Trump coin. We might see another upward push, but history has shown that if everyone expects a massive rally in September or the fourth quarter, the opposite usually occurs; we end up buying the rumor and selling the news.
Safe trading, everyone! I remain a staunch Bitcoin bull, but I recognize that all good things must eventually come to an end and the next cycle will be so exciting, so make sure youe have the reserves to invest in the bear!
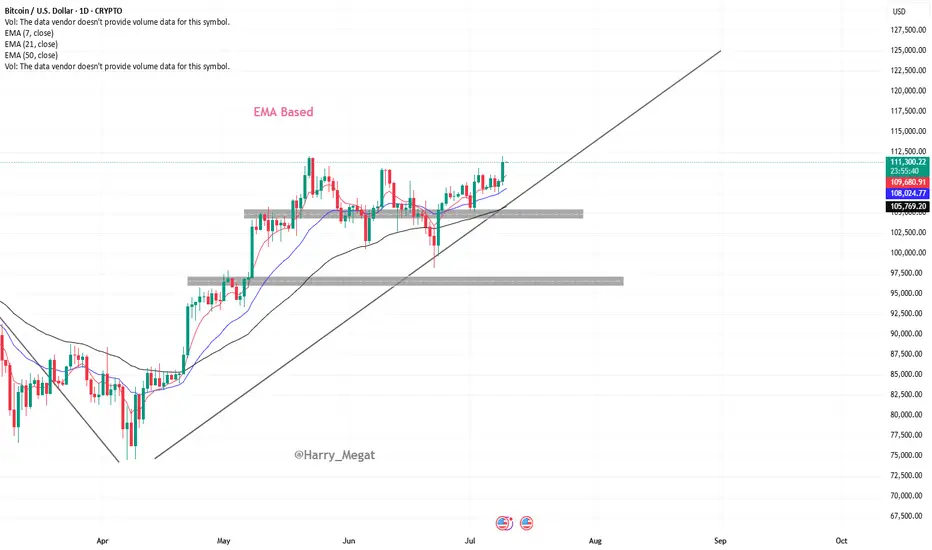
BTCUSD Chart Analysis (Daily Timeframe)Chart Analysis – BTC/USD (Daily Timeframe)
Trend Overview:
* The chart shows **Bitcoin (BTC/USD)** on the **daily timeframe**.
* Price is in a **clear uptrend**, making **higher highs and higher lows**.
* The recent breakout above **\$111,000** suggests a **bullish continuation**.
Moving Average Analysis (EMA 7, 21, 50):
* **EMA 7 > EMA 21 > EMA 50** — this alignment confirms **strong bullish momentum**.
* Price is **well above all EMAs**, especially the 50 EMA (\~\$105,546), showing trend strength and possible institutional support.
* EMAs are **sloping upward**, which further confirms the upward momentum.
Recent Breakout:
* BTC broke out of a **short-term consolidation zone** between \~\$108,000–\$111,000.
* Today’s candle shows a **strong bullish close**, indicating fresh buying interest.
* If this breakout holds, price could extend toward the **next psychological level of \$115,000–\$117,500**.
Support Zones to Watch:
* **Minor support:** \~\$109,000 (EMA 7 + breakout retest area)
* **Stronger support:** \~\$105,500 (EMA 50 and previous swing low)
A break below **\$105,500** could signal a trend shift or deeper pullback.
Summary:
Bitcoin is showing **strong bullish structure** on the daily chart with EMAs aligned upward and a recent breakout above \$111,000. If momentum holds, next upside targets are around **\$115,000–\$117,500**. The bullish trend remains intact unless price breaks and closes below **\$105,500**.
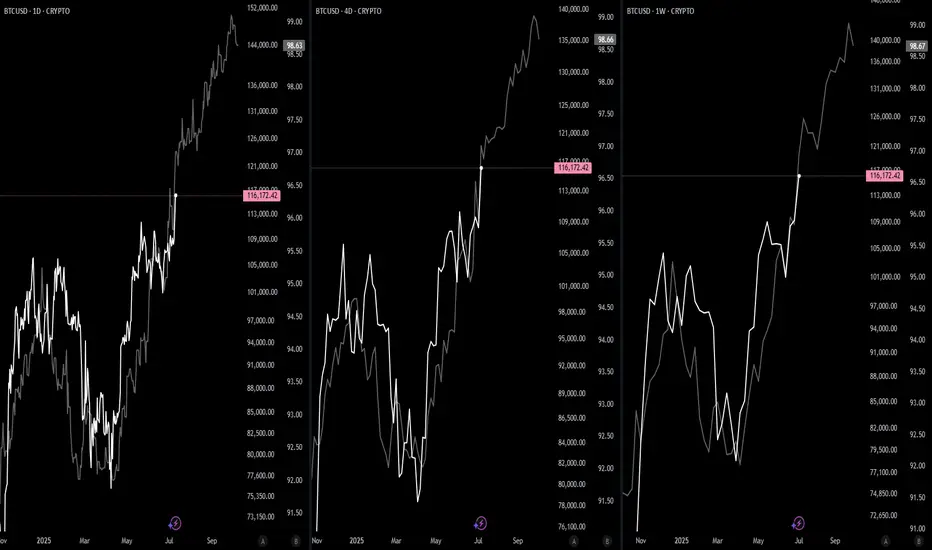
BTC-M2!Sooo much liquidity out there currently! I think everyone calling for 150 as the cycle pico top are being bearish. As I have said before, I predict that BTC will take the full cycle and max out its potential early to mid October.
My thesis for over a year...
Base -- 160
Norm -- 220
Bull -- 280
FYI, the M2 adjustments as shown...
1D -- 90
4D -- 22
1W -- 12
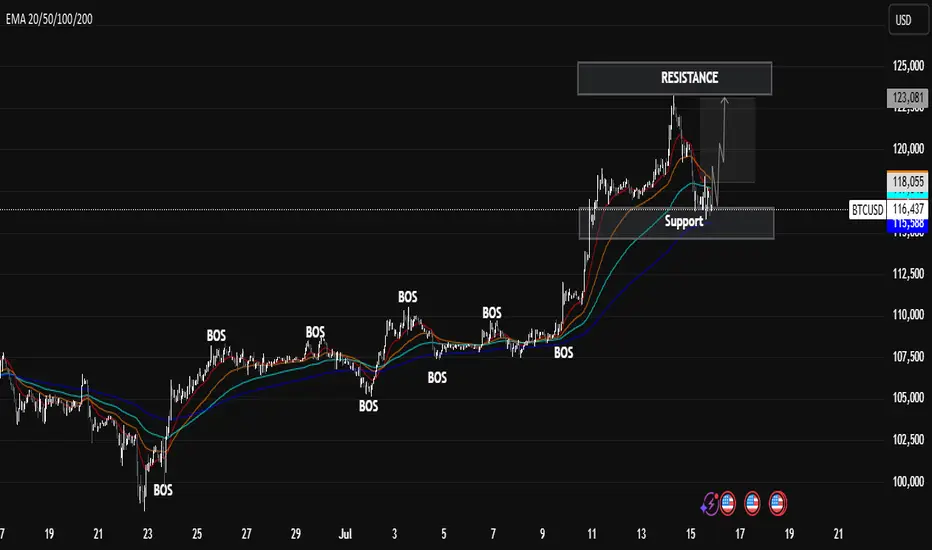
BTCUSD Technical Analysis – Break of Structure + SupportBTCUSD Technical Analysis – Break of Structure + Support/Resistance Strategy
🔍 Market Structure Insight
The chart clearly shows multiple Breaks of Structure (BOS) throughout the uptrend, indicating strong bullish momentum. Each BOS confirms a higher high formation and continued market strength.
📌 Key Zones
Resistance Zone: Price recently tested this level and faced rejection, indicating potential short-term selling pressure.
Support Zone: Price is currently retesting this level after a correction, showing signs of a possible bounce. It aligns well with the EMA support cluster (20–200 EMAs).
🔄 Current Price Action
After a significant impulse move to the upside, BTC is now in a corrective phase. However, the support zone is holding, and there's potential for a new bullish wave if price sustains above $115,000.
📈 Bullish Scenario
Price holds above support
EMA cluster continues to act as dynamic support
Break above $118,000 resistance could trigger the next rally toward $122,000+
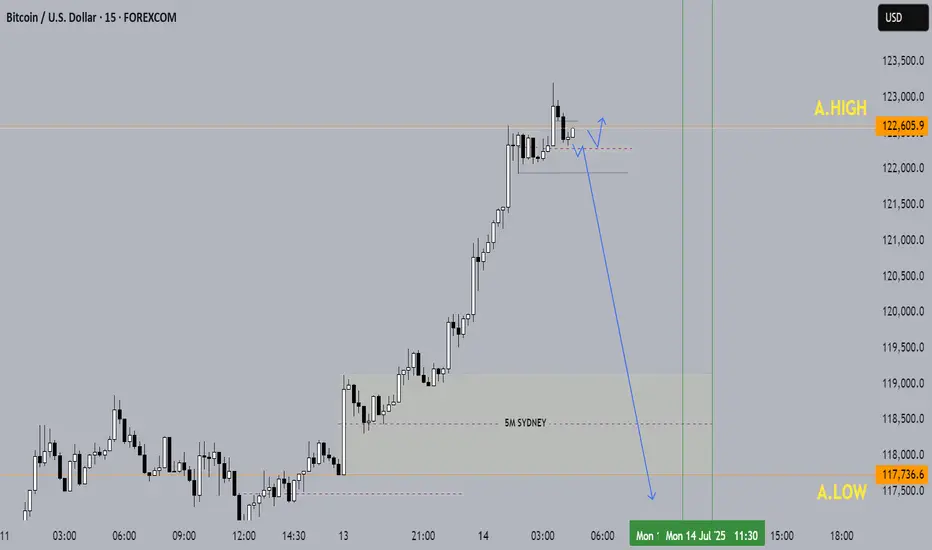
BTUUSD ASIAN HIGH/LOW LIQUIDITY PURGESweeps often happen early in the London session
Price reverses back inside the range or moves strongly in opposite direction.
Ascending Inverse H&S on the BTC weekly chartThe longer it takes to break above this neckline the higher the breakout target will be. I have arbitrarily placed the measured move line at July 18th 2025. If the breakout were to happen on that day the measured move target is around 208k, which could take quite awhile to reach or if we entered a truly hyperparabolic blow off top we could reach such a target way quicker than when the dotted measured move line reaches it. *not financial advice*

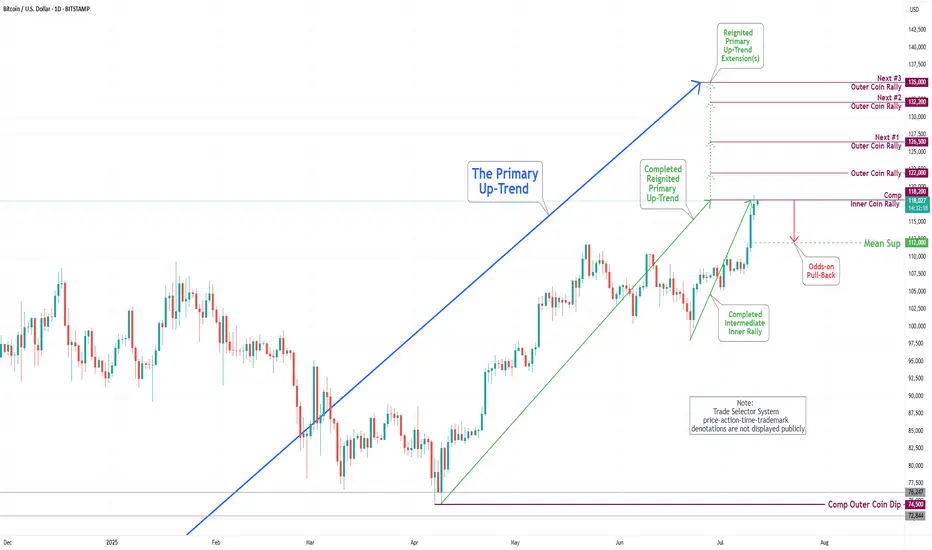
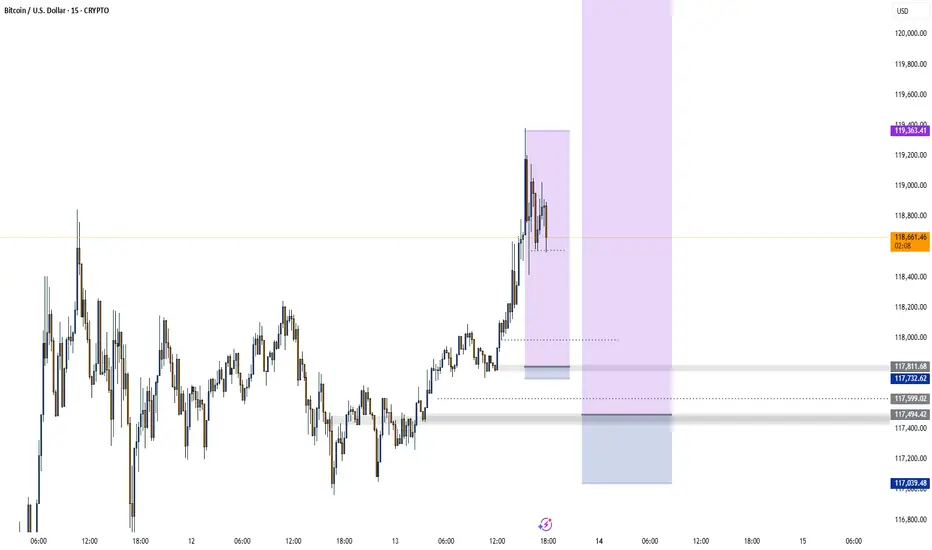
Bitcoin(BTC/USD) Daily Chart Analysis For Week of July 11, 2025Technical Analysis and Outlook:
In the last week's trading session, Bitcoin has demonstrated a significant surge, achieving historical prices as anticipated by TSS for an extended period. The cryptocurrency has successfully completed both the Outer Coin Rally 114500 and the Inner Coin Rally 118200. Presently, Bitcoin is poised to celebrate this notable accomplishment with a victory lap, but it may face a potential downward trajectory, targeting the Mean Support level of 112000. This anticipated decline will necessitate the resilience to a retest of Inner Coin Rally 118200. The designated targets for the Outer Coin Rally at this juncture are 122000, 126500, 132200, and 135000.
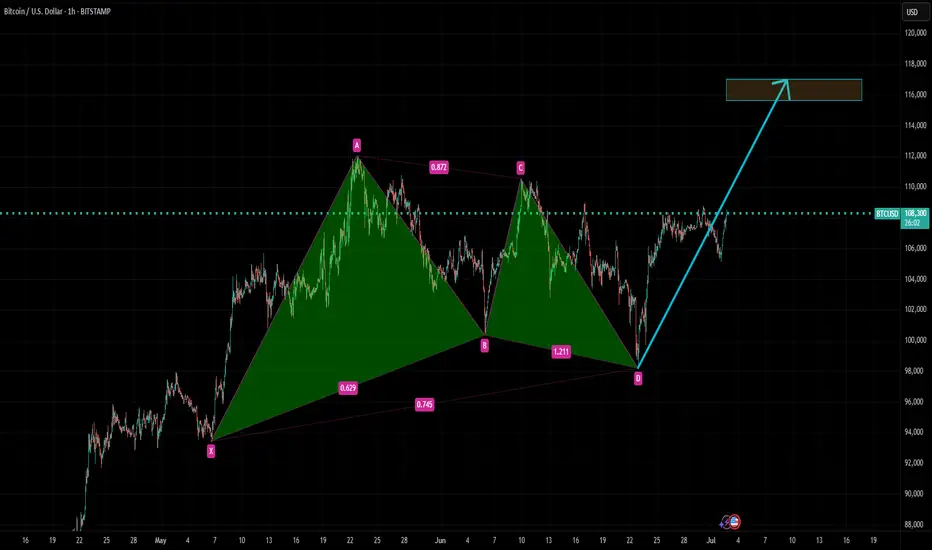
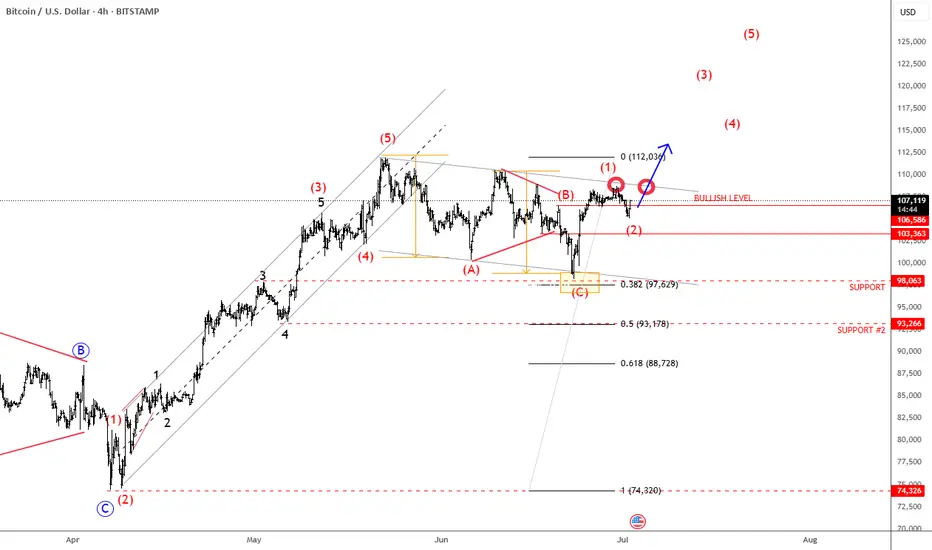
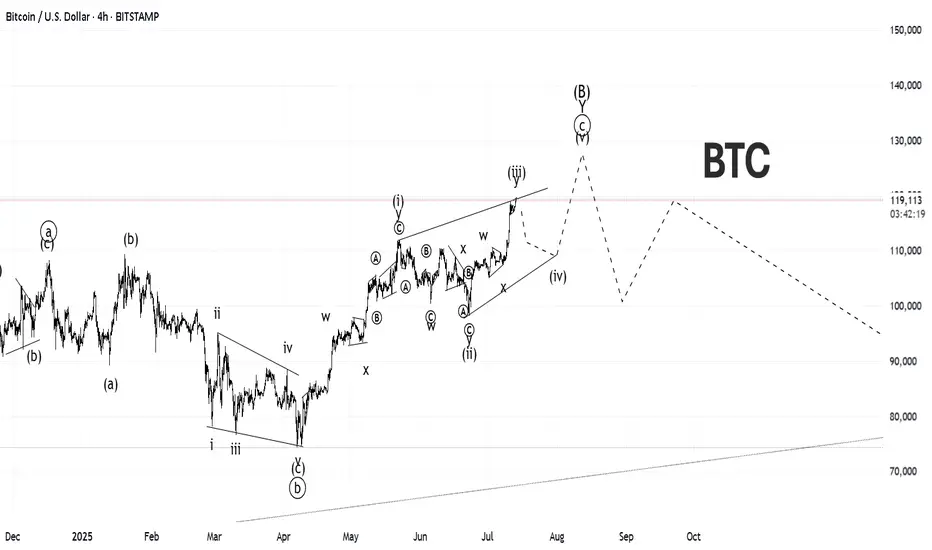
Bitcoin Is Looking For A Bullish ContinuationMorning all! Bitcoin has impulsive characteristics on 4h time frame, and we can clearly see five waves up that can send the price even higher after recent projected ABC correction. With the current impulsive recovery back above 106k area, it confirms that bulls are still here and we should be aware of further rally in July, especially if breaks above channel resistance line near 110k area. Seems like it's in wave (1) of a new five-wave bullish impulse, so after current wave (2) pullback, we can expect more gains within wave (3).
watch the laws, not just the charts.stablecoins were once the rebels of finance—anchored to fiat yet untethered from traditional banking laws, but the tides are turning. Across major economies, lawmakers are drawing up legal frameworks that place stablecoins inside the banking sector rather than outside of it. This shift could be the most pivotal regulatory development since Bitcoin was born.
But what does this really mean for traders, investors, and markets?
In this @TradingView blog we’ll unpack the new laws on stablecoins entering the banking realm, and what their ripple effect might look like, using past regulatory shifts as a lens to foresee market behavior.
🧾 Section 1: What the New Stablecoin Laws Say
Many regions—especially the EU, UK, Japan, and the US—are moving toward a model where stablecoin issuers must register as banks or hold full banking licenses, or at minimum, comply with banking-like oversight.
Key pillars of these laws include:
Full reserve requirements (1:1 backing in liquid assets)
Audited transparency on reserves and redemptions
KYC/AML compliance for users and issuers
Supervision by central banks or financial regulators
In the US, the House Financial Services Committee recently advanced a bill that would make the Fed the ultimate overseer of dollar-backed stablecoins.
In the EU, MiCA (Markets in Crypto-Assets) requires issuers of e-money tokens to be regulated financial institutions.
Japan now allows banks and trust companies to issue stablecoins under strict regulations.
💥 Section 2: Why This Is a Big Deal
Bringing stablecoins into the banking system could change how liquidity flows, how DeFi operates, and how capital moves across borders.
Potential market impacts:
Increased trust = more institutional money entering stablecoins and crypto markets.
DeFi restrictions = protocols may face scrutiny if they allow unverified stablecoin usage.
Flight from algorithmic or offshore stables to regulated, bank-issued stablecoins (e.g., USDC, PYUSD).
On-chain surveillance increases, potentially limiting pseudonymous finance.
Think of it as crypto’s "Too Big To Ignore" moment—where stablecoins become infrastructure, not outlaws.
📉 Section 3: Past Laws That Shaped Crypto Markets
Let’s examine how previous regulations have affected crypto markets—offering clues about what to expect.
🧱 1. China’s Crypto Ban (2017–2021)
Kicked off a massive market crash in 2018.
Pushed mining and trading activity overseas, especially to the US and Southeast Asia.
Resulted in more global decentralization, ironically strengthening Bitcoin’s resilience.
🪙 2. SEC Lawsuits Against XRP & ICO Projects
Ripple’s XRP lawsuit caused delistings and volatility.
Set a precedent for how tokens are treated under securities law.
Resulted in more structured token launches (via SAFEs, Reg D, etc.).
🧮 3. MiCA Regulation in Europe (2023 Onward)
Provided regulatory clarity, prompting institutions to engage more with regulated entities.
Boosted legitimacy of Euro-backed stablecoins like EURS and Circle’s Euro Coin.
Sparked a race among exchanges to gain EU registration (e.g., Binance France, Coinbase Ireland).
Each of these regulatory waves caused temporary volatility, followed by long-term growth—as clarity invited capital.
📊 Section 4: The Possible Scenarios for the Market
Here’s how things might play out as stablecoin laws become mainstream:
Golden Path-Regulated stablecoins coexist with DeFi; innovation meets compliance - Bullish for crypto adoption and capital inflows.
Walled Garden-Only bank-issued stablecoins are allowed; DeFi stifled -Neutral or bearish short-term, bullish long-term.
Backlash-Overregulation pushes stables offshore or into non-compliant zones - Bearish, liquidity fragmentation returns.
🔍 Nerdy Conclusion:
Stablecoins are no longer just tools for traders—they’re becoming the backbone of digital finance. Their formal entrance into banking law marks a turning point that traders must understand.
While regulation has historically caused short-term fear, it often leads to long-term maturity in crypto markets. The stablecoin laws now in motion could unlock the next chapter of institutional adoption, cross-border finance, and perhaps, the integration of crypto into the real-world economy at scale.
💡 Nerdy Thought:
When a technology becomes systemically important, it stops being ignored—it gets integrated. Stablecoins have reached that level.
put together by : @currencynerd as Pako Phutietsile
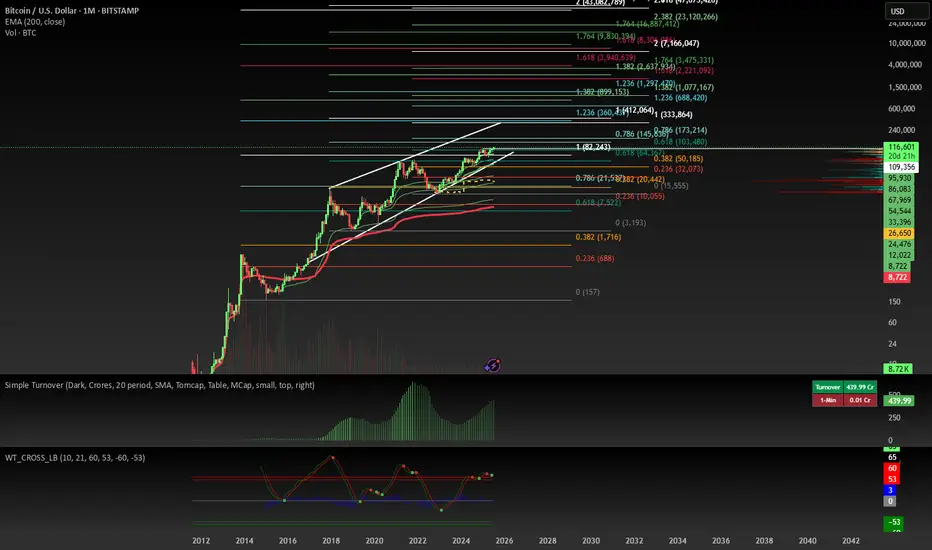
$BTC Will Hit Unimaginable Numbers :) Honestly not much to say the chart looks fantastic a lot of potential to the downside but from a Macro standpoint we could reach 150k in the coming months. Bitcoin will see extreme gains in the next 5 years. If you are not bullish I have news for you. you lost......
Short term I think we reach as far as 120k before a pull back. Only time will tell but these fib extensions do not lie. When you blow through the 1 fib ALWAYS AND I MEAN ALWAYS LOOK HIGHER. Obviously this is the monthly chart and will take year to play out. I do not expect much attention as I am a small trader but I will post occasional updates. In the mean time I will be buying large dips.
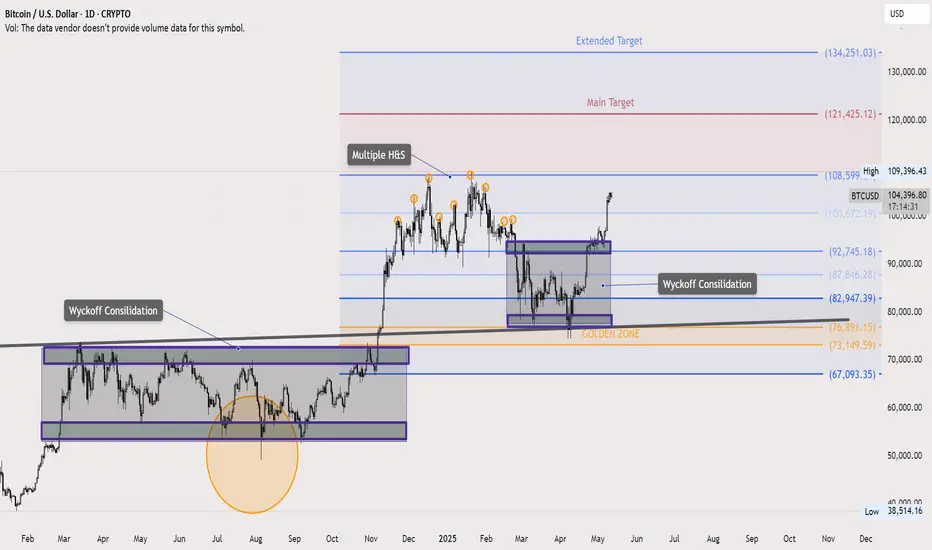
Bitcoin Update – Textbook Patterns Playing OutIn last week’s Bitcoin idea, I highlighted a key technical setup: price retested the neckline of a massive inverted Head & Shoulders pattern and launched a strong move upward. Let’s dive into what’s unfolding on the daily chart.
We’re seeing classic Wyckoff consolidation behavior—appearing right before the breakout and again after the neckline retest. Multiple smaller Head & Shoulders patterns have also formed and hit their targets cleanly.
The Volunacci pattern came alive after a precise bounce from the Golden Zone, adding more fuel to the bullish narrative.
Next major level in focus: $120K. Will Bitcoin reach it? Let the market decide.
#LetsRideThePeak BTC ₿₿I checked my old BTC forecast and realized that Bitcoin has been following it loosely.
There's a clear pattern emerging that might surprise everyone very soon. In the coming days, I’ll post a long-term BTC analysis and add it to the toolkit.
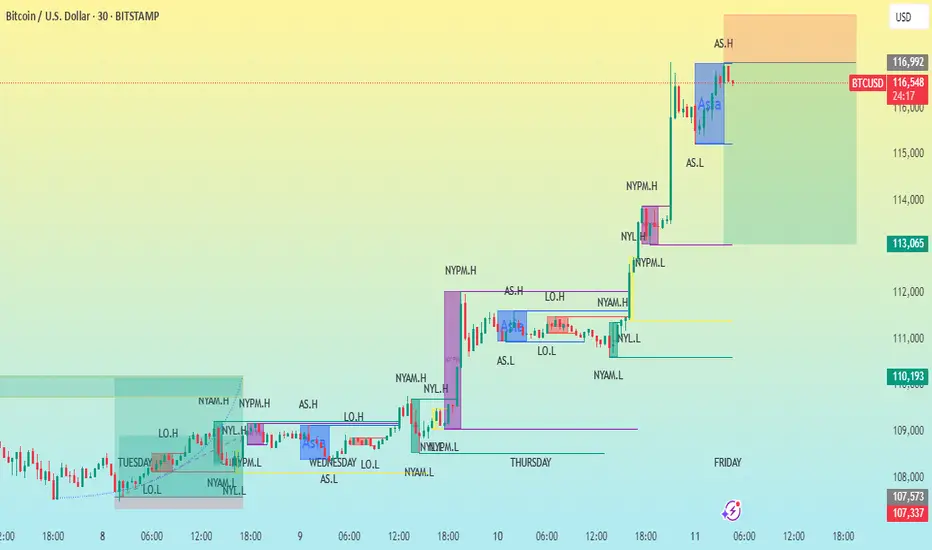
BTC/USD 30MCHART PATTERNThis chart shows the price action of Bitcoin (BTC/USD) on a 30-minute timeframe, with a variety of session-specific high and low labels and possible trade setup zones. Here's a breakdown of the key components and what they indicate:
---
1. Timeframe & Instrument
Instrument: Bitcoin vs. U.S. Dollar (BTC/USD)
Timeframe: 30-minute candles
Exchange: Bitstamp
Date Range: July 8–11, 2025
---
2. Session Labels
The chart includes key session high/low markers which are common in institutional trading analysis:
NYAM.H / NYAM.L: New York AM session High/Low
NYPM.H / NYPM.L: New York PM session High/Low
AS.H / AS.L: Asia session High/Low
LO.H / LO.L: London Open High/Low
NYL.H / NYL.L: New York Lunch High/Low
These session levels are often used to identify liquidity pools or areas where price might react due to prior institutional activity.
---
3. Trade Setup Zones
Orange box (top): Likely a sell-side liquidity or resistance zone, possibly a target for a long trade.
Green box (bottom): Likely a buy-side liquidity or support zone, possibly a stop loss or retracement target.
These zones often represent risk-reward blocks based on prior session data or imbalance fill areas.
---
4. Price
Current Price: ~$116,586
Recent High (AS.H): $116,992
Key Support Levels: $113,065 and $110,193 (from prior session lows)
---
5. Price Structure
The chart shows a clear uptrend, with higher highs and higher lows.
Breakouts followed by consolidations near session highs suggest bullish momentum.
Potential continuation of the uptrend unless the price breaks below the previous session low (marked NYPM.L or NYL.L).
---
Conclusion
This is a well-marked institutional-style price action chart, likely using ICT (Inner Circle Trader) or SMC (Smart Money Concepts) principles. It’s showing bullish strength with multiple liquidity grabs followed by expansions to the upside. Key levels for future movement include:
Break and close above AS.H → Potential continuation toward next liquidity zone.
Drop below NYPM.L or NYL.L → Potential reversal or retracement.
Let me know if you'd like help planning a trade based on this chart!
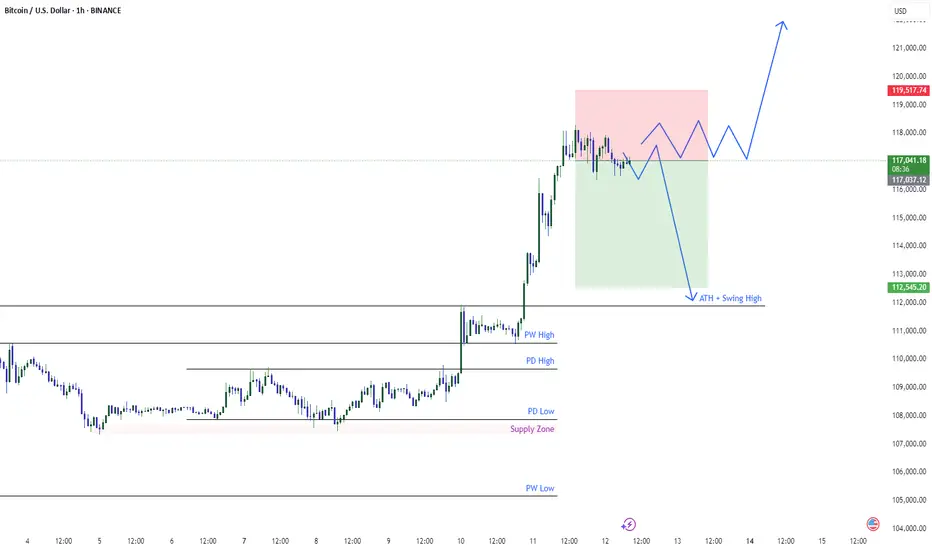
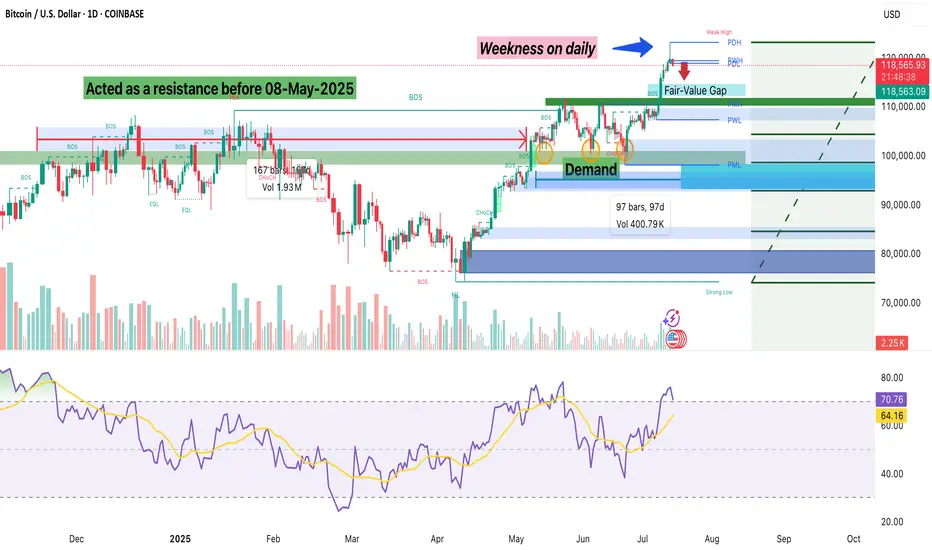
Signs of Weekness: Is Bitcoin Losing Momentum?Last week, Bitcoin made a new all-time high and gave bulls some serious profits. Price action has been looking solid and strong ever since it broke above the psychological and technical level of $110,000. But now, we’re starting to see signs that the market might need a healthy retracement.
On the daily chart, there’s a clear long wick at the top, which is a sign that buyers may be losing momentum up here. There’s also a Fair Value Gap (FVG) between roughly $115,200 and $112,200. In most cases, price tends to revisit these imbalances, so I wouldn’t be surprised if we dip back into that zone. I’m watching the midpoint around $113,700 because that could be a key level for a bounce if the bulls want to keep control.
If that zone fails to hold or we see a clean breakdown without much of a reaction, there’s a chance we revisit the $110,000 breakout level. From a Fibonacci standpoint, the 0.382 retracement of the recent move from around $98K to $120K also lands near $111.6K, which adds some confluence to that area.
Overall, I still think the trend is strong, but after this daily candle, I think that a 5–7% pullback wouldn’t be unusual or unhealthy. What are your thoughts? Are we just cooling off before another breakout, or is a deeper retracement on the table? Comments and suggestions?
BUYTrend Line Break
Previous Day Volume
Rejection Point
Untapped Order Point
London - US Session
High Structure Swing
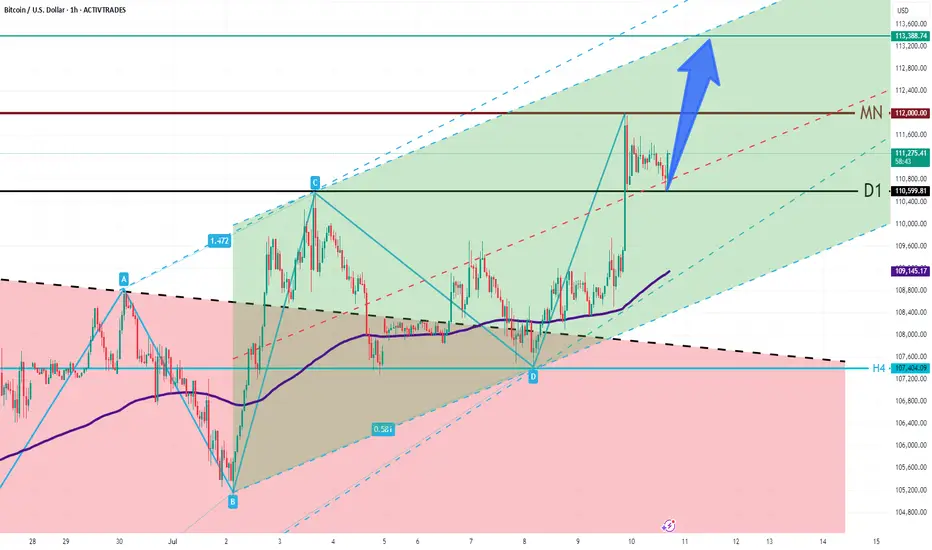
BTC/USD: Bitcoin Holds Above Key Support — Target at 113,388Market Overview:
Bitcoin is trading near 111,250 after breaking out of a descending structure and forming a bullish channel. The price has firmly established itself above the daily level of 110,600, signaling continued bullish momentum. The market is now aiming toward the channel’s upper boundary.
Technical Signals & Formations:
— Completed ABCD pattern
— EMA supports the bullish bias
— 110,600 now acts as key support
— Upside potential toward 113,388
Key Levels:
Support: 110,600, 109,115
Resistance: 112,000, 113,388
Scenario:
Primary: As long as BTC holds above 110,600, a move toward 112,000 and 113,388 remains likely.
Alternative: A drop below 110,600 may trigger a pullback toward 109,115.
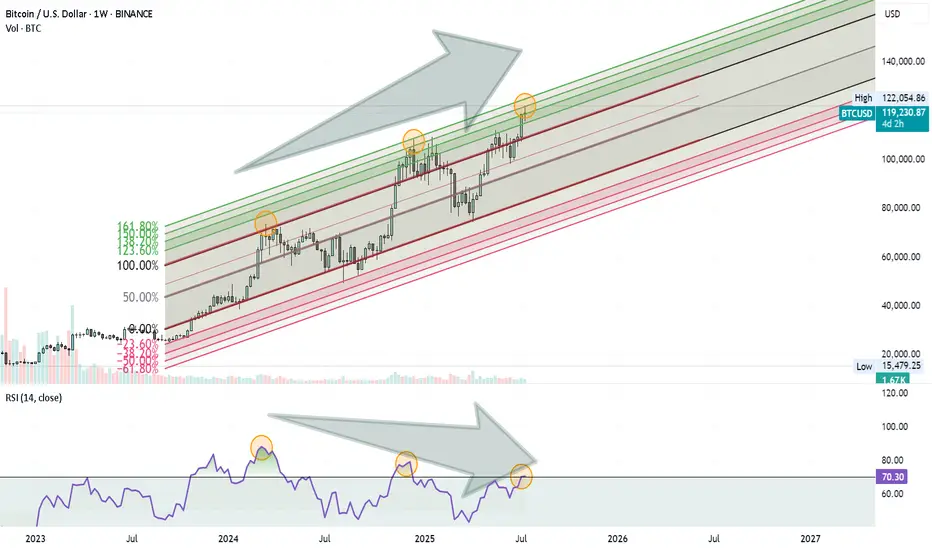
Bitcoin Rally Losing Steam?Bitcoin might be approaching a Turning Point . Here’s what I’m seeing on the weekly chart:
Price is moving inside an ascending Fibonacci channel.
It’s getting close to the 1.60 (160%) extension level, which has acted as a reversal zone before.
At the same time, the RSI is showing a clear negative divergence, suggesting that momentum is weakening.
These signs combined could mean we’re not far from a significant correction.
Nothing is confirmed yet, but it’s a setup worth keeping an eye on.
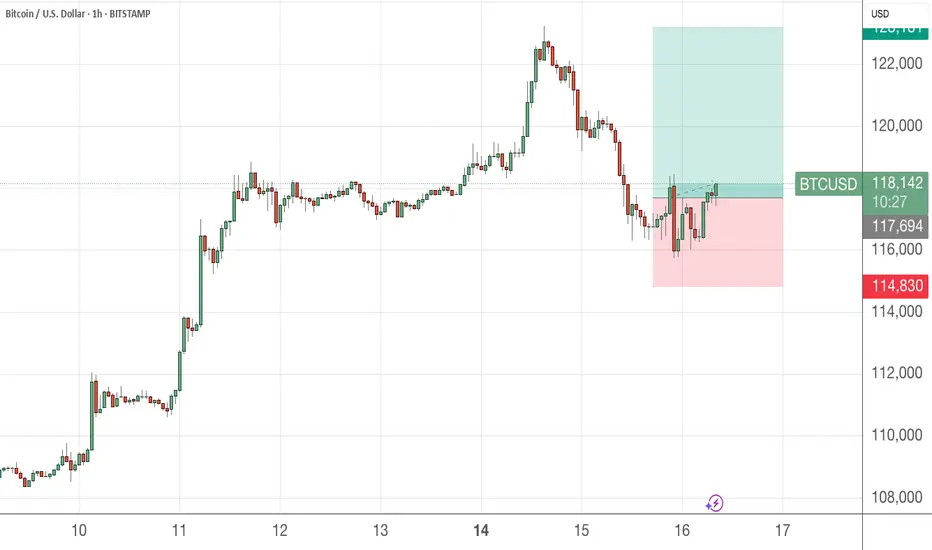
Adding a bit more to BTCUSDPlease see day and 1H chart , all bullish
This digital asset whether you believe it is productive and generates cash flow or not, please put 1-3% of your capital to it. Buy and keep long term , avoid trading unless you like volatility.
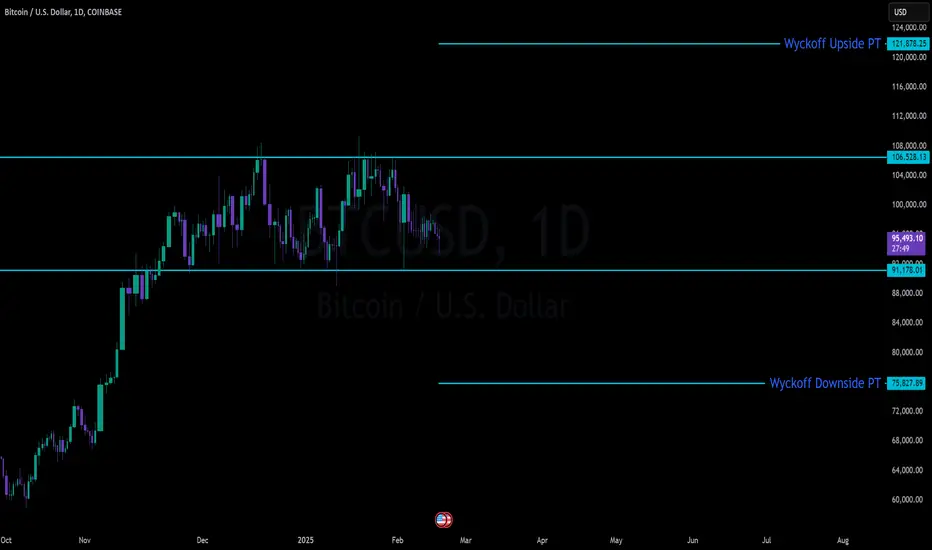
BTC Massive SetupConsolidation for months between 91k and 106k
- Classic Wyckoff setup as an accumulation/distribution
- Price targets of: 121.878 (122k is the popular target) to the upside with 75,827 on the down
- Saylor today put out news to be raising another $2 billion to buy BTC. Either he is going to be able to hold the floor or get washed out
- Trade can be taken with confirmation of breakout on either side pretty easily as momentum will be so strong that being on the wrong side will most likely be an immediate stop out
Bitcoin’s Incoming Bear Market!🚀 Bitcoin’s Bullish Phase: The Final Push Before the Fall?
Bitcoin is currently in the parabolic uptrend phase of its halving cycle, with price action closely following historical patterns. Since the last halving on April 15, 2024, Bitcoin has mined approximately 42,480 blocks, pushing the market closer to the 70,000-block threshold where the trend historically reverses into a deep bear market.
Based on historical patterns, Bitcoin’s next major bull market peak is expected around 150,000 USD, approximately 70,000 blocks post-halving (projected for August 2025). However, investors must prepare for what follows—a severe bear market fuelled by miner capitulation.
🔥The 70,000-Block Bearish Reversal: Why It Happens Every Cycle
1. The Mining Difficulty Trap & Rising Costs
Bitcoin’s mining difficulty adjusts every 2,016 blocks (~2 weeks) to maintain the 10-minute block interval.
As BTC price surges in the bull market, more miners join the network, driving competition and difficulty higher.
This raises mining costs and squeezes profit margins, making it harder for smaller miners to stay afloat.
✅ Bull Market (~0-70,000 Blocks Post-Halving)
High BTC prices offset increased difficulty, allowing miners to hold rather than sell.
Low sell pressure from miners keeps Bitcoin in an uptrend.
❌ Bear Market (~70,000 Blocks Post-Halving)
After BTC peaks, prices decline but difficulty remains high.
Mining costs remain constant, while block rewards drop.
Weaker miners can’t afford to mine at a loss and are forced to sell their BTC holdings to cover operational expenses.
2. The Snowball Effect: How Miner Capitulation Triggers a Crash
Once inefficient miners begin selling, a chain reaction unfolds:
1️⃣ Bitcoin price starts declining after the cycle peak (~12-18 months post-halving).
2️⃣ Miners struggle to remain profitable due to high difficulty and lower block rewards.
3️⃣ Miners begin offloading BTC to cover expenses, increasing supply in the market.
4️⃣ More BTC supply leads to further price drops, triggering panic selling.
5️⃣ Additional miners shut down operations, selling off reserves, further flooding the market.
6️⃣ Capitulation accelerates, causing a cascading effect similar to leveraged liquidations seen in past bear markets.
🔄 This cycle repeats until enough miners exit, difficulty adjusts downward, and BTC stabilizes.
3. Historical Proof: How Miner Capitulation Has Marked Every Bear Market
Each Bitcoin bear market aligns with major miner capitulation events. Here’s how past cycles have played out:
📌 2012 Halving: Bull top in late 2013, miner capitulation in 2014, BTC fell -80%.
📌 2016 Halving: Bull top in late 2017, miner capitulation in 2018, BTC fell -84%.
📌 2020 Halving: Bull top in late 2021, miner capitulation in 2022, BTC fell -78%.
📌 2024 Halving: Expected bull top in late 2025, miner capitulation likely in 2026?, BTC decline TBD but estimated to be around -60%.
🔹 In all cases, BTC topped ~70,000 blocks after the halving, followed by a deep drawdown driven by miner capitulation.
🔹 The selling pressure from miners perfectly aligns with the start of major market crashes.
4. The Accumulation Phase: What Follows the Crash?
After miners capitulate and difficulty adjusts downward, Bitcoin enters a sideways accumulation phase (~140,000-210,000 blocks post-halving).
Weaker miners have already exited, reducing sell pressure.
Surviving miners adjust to lower rewards and stop mass selling BTC.
Smart money (whales & institutions) begin accumulating at undervalued prices.
The MVRV ratio drops below 1, signalling a market bottom.
Bitcoin stabilizes, setting the stage for the next bull cycle.
This predictable recovery cycle lays the groundwork for Bitcoin’s next exponential rally into the next halving period.
The Bitcoin Bear Market Prediction for 2025-2026
✅ Bitcoin is currently on track to peak near ~$150,000 around 70,000 blocks post-halving (August 2025).
✅ Following this, BTC is expected to enter its bear market, with prices potentially falling to ~$60,000 (by December 2026).
✅ The primary catalyst for this crash will be miner capitulation, just as it has been in every prior cycle.
Final Thoughts
If history repeats, the Bitcoin market is set to follow a sharp parabolic rise to ~$150,000 before undergoing a 70,000-block miner-driven selloff into a multi-month bear market. Investors should be aware of this pattern and plan accordingly.
Sources & Data Validation
The insights presented in this article are based on historical Bitcoin price cycles, on-chain analytics, and mining difficulty trends from various sources, including:
Blockchain Data (Glassnode, CoinMetrics)
Historical BTC Halving Data (Bitcoin Whitepaper, Blockchain Explorers)
Market Analysis Reports (Messari, Arcane Research)
Macroeconomic Influences (Federal Reserve Reports, Global Liquidity Cycles)
Disclaimer: Not an Investment Recommendation
This article is for informational purposes only and should not be considered financial or investment advice. Bitcoin and cryptocurrency markets are highly volatile, and past performance is not indicative of future results. Conduct your own research and consult with a financial professional before making any investment decisions.
