Wyckoff Re-Accumulation (Phase 2) – BTC Market Structure AnalysiThis is an updated outlook on BTC’s current price structure based on Wyckoff methodology.
🔹 Structure Overview:
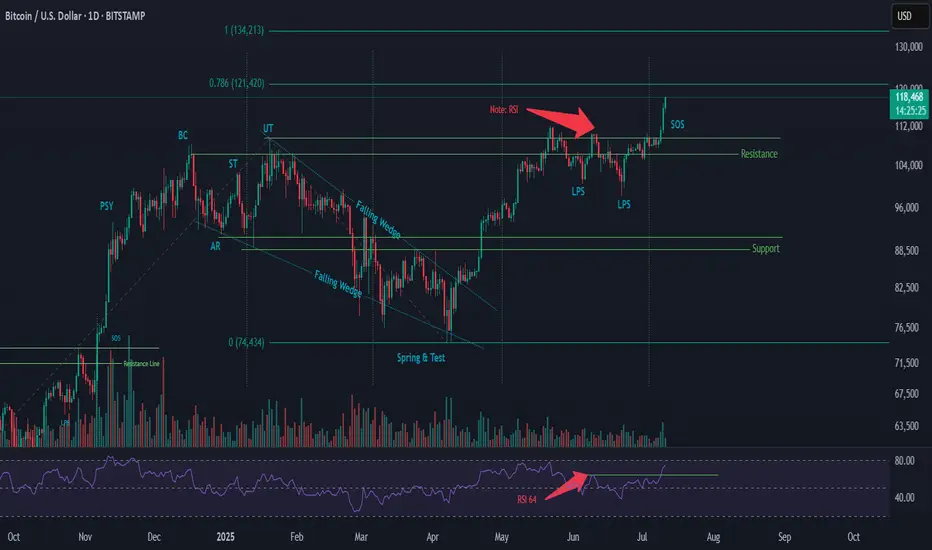
BTC has broken out above its previous resistance and reached a new ATH. Based on current price action and volume behavior, I believe we are at the Sign of Strength (SOS) phase in a Wyckoff Re-Accumulation Phase 2.
Key Wyckoff Labels in this structure:
PSY – Preliminary Supply
BC – Buying Climax
AR – Automatic Rally
ST – Secondary Test
UT – Upthrust
LPS – Last Point of Support
SOS – Sign of Strength
(For those unfamiliar with the terms, I suggest looking up the Wyckoff Method for detailed definitions.)
The breakout is happening with volume support, and we’ll need to observe how sustained the demand is.
🔹 RSI Observation:
In June, RSI pivoted at 64, and has now reached 73
Both price and RSI are printing higher highs
Daily RSI has not yet reached overbought territory (80+)
If RSI crosses above 80 and then rolls over, it could signal a bearish divergence → followed by a retracement
🔹 Possible Scenarios (3 Outcomes I’m Watching):
📈 Another Re-Accumulation Phase forms after this move
🧊 Market tops out at ATH and enters a Distribution Phase
🚀 A parabolic move (Blow-off Top) happens, followed by a sharp crash and Distribution
🔹 My Personal Trading Plan:
As price enters the next phase, I’ll be watching closely for signs of PSY and BC (Preliminary Supply & Buying Climax). If bearish divergence aligns with these, it may indicate an upcoming retracement.
Once BC forms, I expect an AR (Automatic Reaction) to follow
I’ll look for short entries during the retracement
A Trading Range could form between the BC (resistance) and AR (support)
⚠️ Be cautious of fakeouts, especially during breakout attempts at the range boundaries.
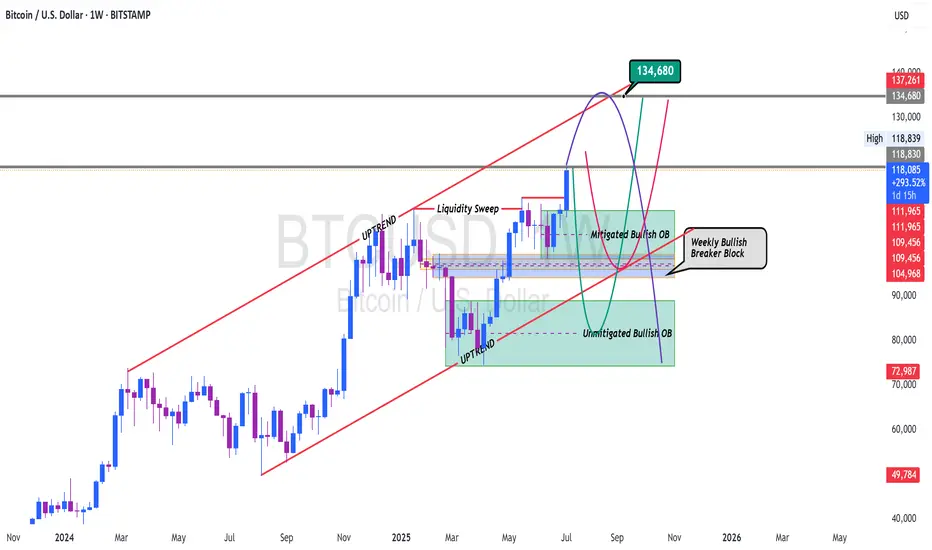
🔹 Price Projection (Fibonacci Extension – For Reference Only):
Using Fibonacci Extension based on the following price coordinates:
Point A: 49,577
Point B: 109,356
Point C: 74,434
🎯 Target Zones:
0.786 extension → 121,420
1.000 extension → 134,213
Again, these are not predictions — just reference points based on market structure.
🔹 Final Note:
This analysis reflects my personal interpretation of the current market structure. Price action can change rapidly based on macro and technical factors. Patterns and phase transitions may take days or even weeks to fully develop.
Feel free to share your thoughts, criticisms, or alternate views — I’m open to feedback from fellow traders.
#Wyckoff #BTC #Bitcoin #CryptoTA #Reaccumulation #TradingPlan #TechnicalAnalysis #RSI #FibExtension #MarketStructure
BITCOIN trade ideas
BTCUSD At Crucial Pivot Point. Is This The Ceiling? - PhoenixFX BTCUSD Price-Action Analysis & Scenarios
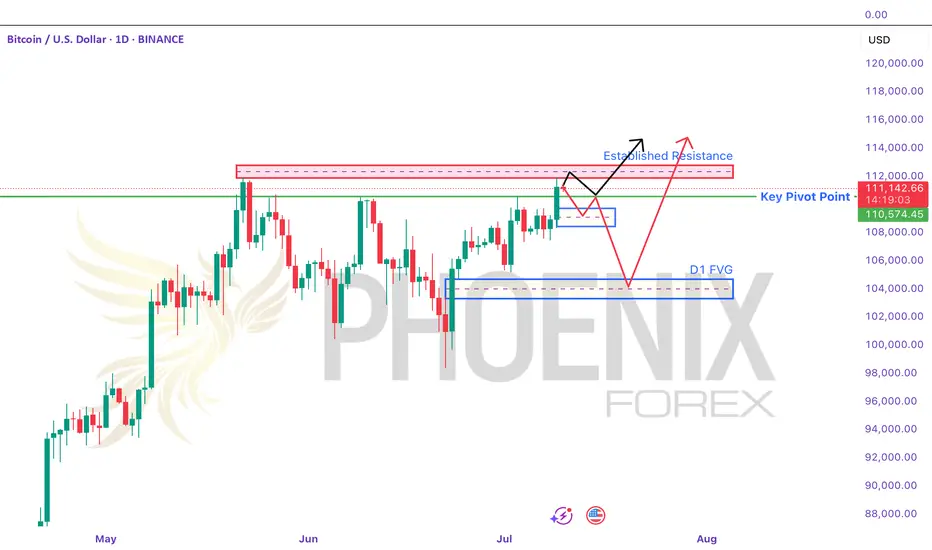
Below is an overview of the two possible paths for Bitcoin over the coming days, as sketched out by the black and red arrows on your chart. We’ll also highlight the key pivot level and resistance zone that will decide which scenario plays out.
🔵 Key Levels to Watch
Established Resistance (~$111,800–$112,500)
This zone marks multiple failed attempts to break higher in recent weeks. It’s where large stop-runs and sell-side limit orders tend to cluster. A decisive daily close above $112K is required to signal genuine bullish continuation.
Daily Pivot Point (~$110,600)
Acting as the “battle line” between bulls and bears, this pivot is the first level to confirm market bias.
Above $110.6K: Tends to favor buyers, suggesting strength and higher-high attempts.
Below $110.6K: Gives the bears the edge, increasing the odds of deeper retracements.
📈 Black-Arrow (“Bullish Continuation”) Scenario
Break & Hold Above Resistance
Price thrusts cleanly above $112K on strong volume.
Retest the H4 Order Block (~$111,000–$111,200)
A shallow pullback into the highlighted H4 demand zone (blue box) offers a lower-risk long entry.
New Highs
From there, Bitcoin resumes its uptrend, closing the week with fresh highs above the prior $113K peak.
Key Trigger: Sustained daily close above $112K, followed by a successful retest of that level.
📉 Red-Arrow (“Bearish Rejection & Dip”) Scenario
Rejection at Resistance
Price stalls and reverses somewhere between $111,800–$112,500, forming a bearish reversal candle.
Drop to Daily FVG Zone (~$104,000–$105,000)
This larger Daily Fair-Value Gap (blue box lower on the chart) coincides with strong weekly support—an ideal zone for dip buyers.
Recovery Rally
After absorbing selling pressure in the FVG, BTC bounces back toward the established resistance, setting up a second test of $112K.
Key Trigger: Clear bearish price action (e.g., engulfing or pin-bar) in the $111.8K–$112.5K zone, followed by a daily close below the pivot at $110.6K.
🎯 How to Trade These Setups
Bullish Entry:
Wait for daily close > $112K
Enter on pullback into $111K–$111.2K (H4 order block)
Stop below $110.6K pivot; target new highs above $113K+
Bearish Entry:
Look for bearish reversal signals in $111.8K–$112.5K
Enter on break & close below $110.6K pivot
Target $104K–$105K (Daily FVG); stop above $112.5K
Note: The pivot at $110.6K is your first “line in the sand” for bias—trade in the direction of the break, and use the major resistance zone to confirm strength or failure. Always manage your risk and adjust to how price actually unfolds!
Just a Heads-Up:
This is my take on the charts—not gospel, not financial advice, and definitely not a crystal ball 🔮. Trading is part skill, part patience, and part “what just happened?” 😅
We all see things a little differently, and that’s the beauty of it. So if you’ve got a hot take, wild theory, or just want to drop some chart wisdom—hit the comments!
Let’s grow, learn, and laugh through the madness together. 🚀📈
Each one, teach one.
— Phoenix FX Team 🔥🦅
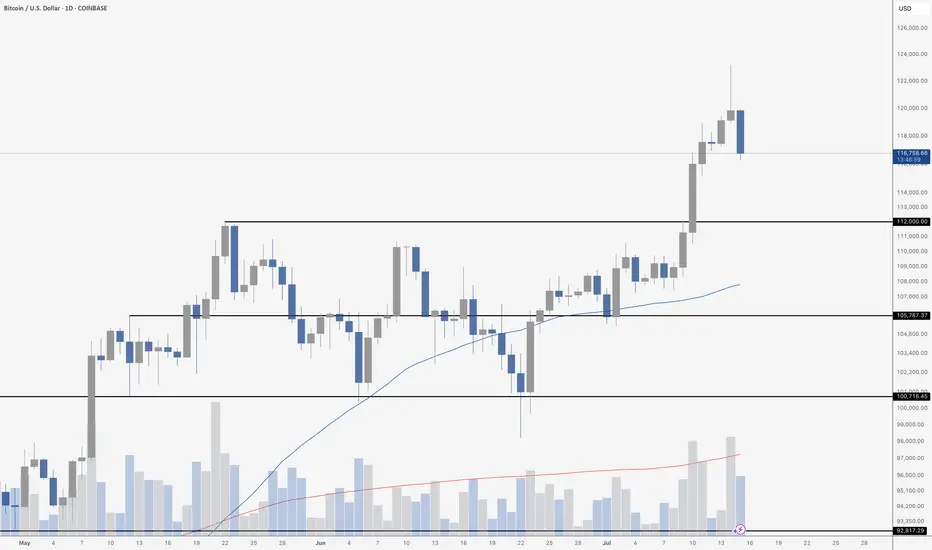
Bitcoin Breakout Watch – BTC/USD UpdateBTCUSD is currently consolidating above the $112,000 level — a critical price zone that could mark the beginning of a new leg higher.
If this consolidation holds, it signals strong buyer interest and sets the stage for a potential breakout. The next major target lies at $120,000, aligning with the 161.8% Fibonacci extension, a key level often associated with explosive momentum moves.
💡 This setup reflects growing confidence in the crypto space and may attract institutional inflows if confirmed.
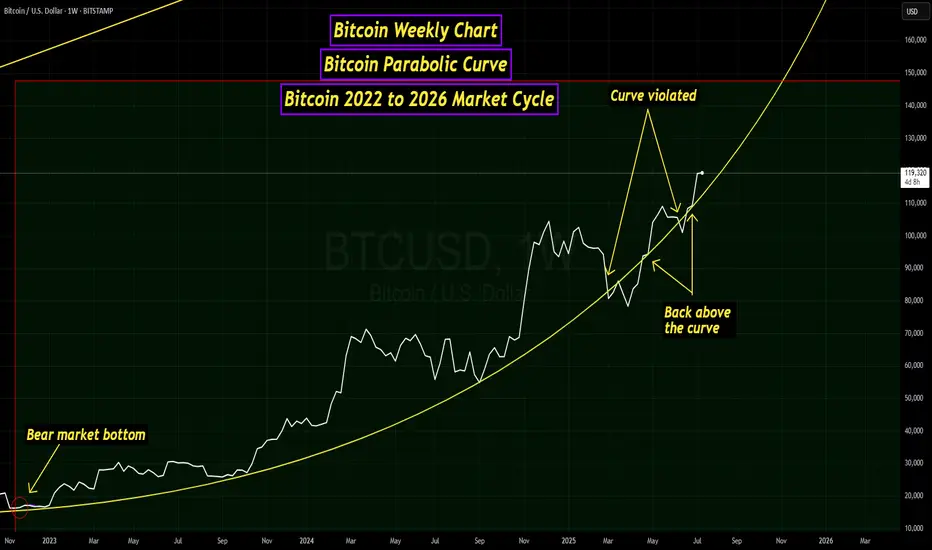
Bitcoin Parabolic Curve - 2022 to 2026 Market CycleThis line chart visualizes the current Bitcoin market cycle from the bear market bottom in November 2022. As you can see, the price has formed a parabolic curve, which was violated around the beginning of March. A couple of weeks later, a retest of the curve occurred, which was rejected. Later in April, the price of BTC was able to push back above the curve. There was another small dip below in June, but BTC was back above the curve by the end of June.
I am also watching the Bitcoin monthly chart and, more specifically, the monthly Stochastic RSI indicator. As you can see in the chart below, between the second and third months after the market cycle peak, the Stochastic RSI indicator has always dropped below the "20" level, and was near zero at the close of the third month.
Back in March and April, there was some speculation that the new all-time high set on January 20th at just over $109k was the peak for this market cycle. At the beginning of April, the Stochastic RSI dropped well below the 20 level but rebounded and was at 16.81 when the April candle closed. The May monthly candle closed with the Stochastic RSI at 31.45, and June closed at 50.17. This indicated to me that this market cycle was far from over.
On July 14th, BTC set a new all-time high at just over $123,000, ending the speculation that this current market cycle had peaked. My assumption for now is that Bitcoin is still following a 4-year market cycle. If this is true, I would expect a market cycle peak sometime in the final months of this year. Either way, it has been a very interesting market cycle with huge changes for the crypto asset class.
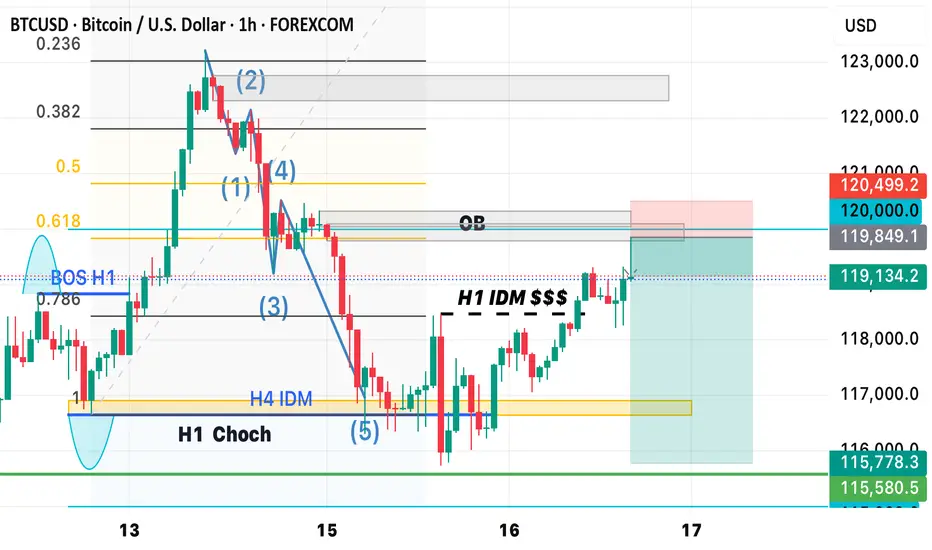
Btcusd sellSmc trading strategy, we are entering with h1 OB after confirming inducement and liquidity.
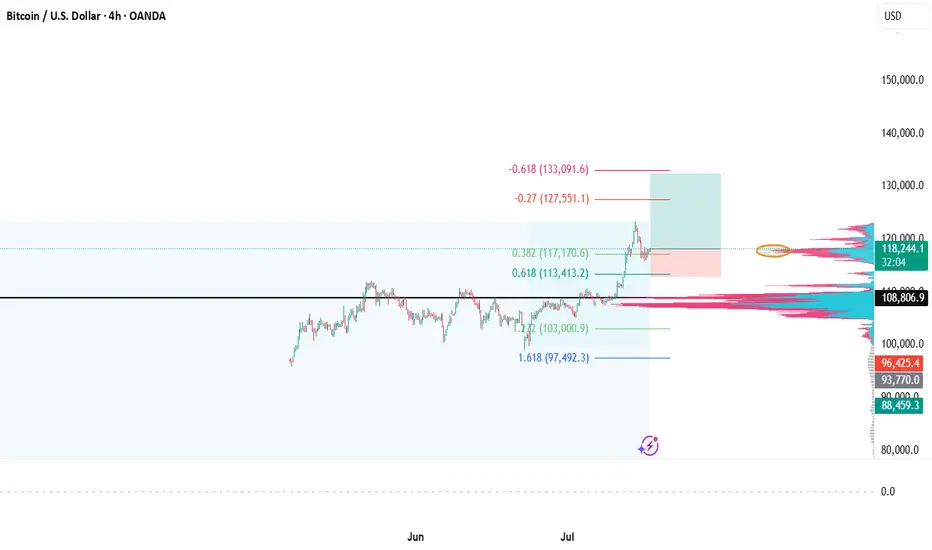
BTC Hits Predicted 1.618 Fibonacci Target at $122K — What’s Next🎯 BTC Hits Predicted 1.618 Fibonacci Target at $122K — What’s Next?
📅 Posted on: July 16, 2025
📍 Ticker: BTCUSD (BINANCE)
✍️ Author: @darwas121
⸻
🔹 Summary
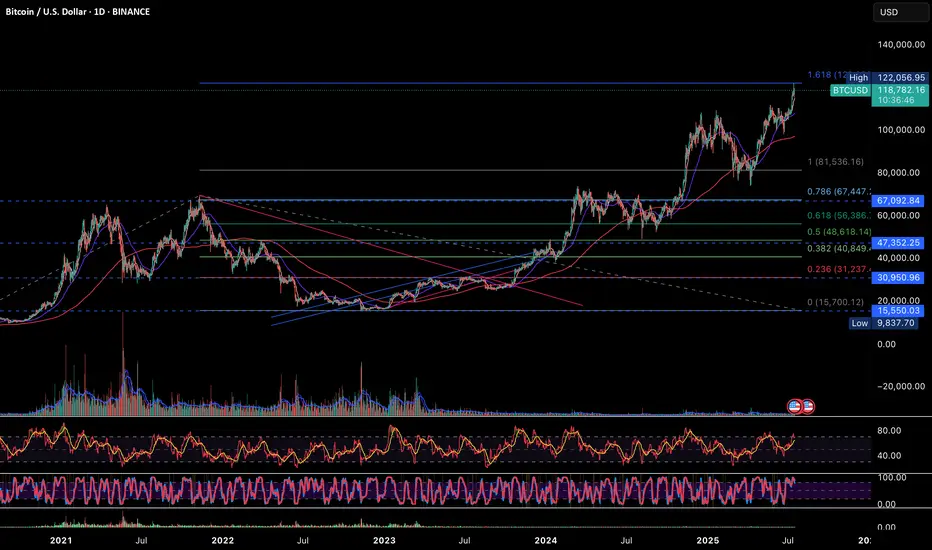
In October 2023, I shared a long-term bullish projection for Bitcoin (BTC/USD) targeting the 1.618 Fibonacci extension level — projected around $122,000. As of today, BTC has successfully hit this target, validating the Fibonacci-based wave structure and bull market thesis. Now the key question is — what’s next?
⸻
🧠 Prediction Recap (Oct 2023)
• ✅ Projected rally continuation based on wave structure + Fibonacci expansion
• ✅ Long-term target: $122,056 (1.618 Fib level)
• ✅ Based on swing low near $15,550 and prior ATH structure
• ✅ Conditions: Confirmed breakout above $81,500
⸻
🔍 Current Technical Analysis (1D Chart)
💰 Price Action
• Current Price: $118,701
• Recent High: $122,056 (exact 1.618 Fib hit)
• Structure: Parabolic breakout from previous consolidation range
🔺 Fibonacci Levels
Level Price (USD)
0.236 31,237
0.382 40,849
0.5 48,618
0.618 56,386
0.786 67,092
1.0 (ATH Zone) 81,536
1.618 ✅ 122,056 (Hit)
📉 RSI & Momentum
• RSI is hovering in the overbought zone (>70), signaling potential cooling-off
• Stochastic RSI also indicates overextension — a pause or retracement could follow
• No bearish divergence yet, but watch closely
📊 Volume Trends
• Volume has tapered during this leg up — possible early sign of buyer exhaustion
• Previous volume clusters between $56k–$67k now act as strong support
⸻
⚠️ What to Watch Next
Risk Factors Notes
Overbought RSI Suggests short-term pullback risk
Weakening Volume Caution: Less conviction in highs
Parabolic Structure Vulnerability Break could mean fast correction
⸻
🧭 My View & Strategy
🔹 Short-Term: ⚠️ Cautious
• Book partial profits if holding from lower levels
• Watch for reversal candles near $122k zone
• RSI divergence or low-volume rally = yellow flag
🔹 Mid-Term: 🔼 Bullish
• Buy-the-dip zones: $67k (0.786) and $56k (0.618)
• Any correction into these zones may offer re-entry
🔹 Long-Term: 🔼 Strong Bullish
• BTC is in confirmed macro uptrend
• Sustained close above $122k opens price discovery zone
• Next logical Fib projection zones: $135k–$150k
⸻
📌 Key Levels
• Support: $81,536 / $67,092 / $56,386
• Resistance: $122,056 → Break = price discovery
• Invalidation Zone: Breakdown below $81,000 on volume
⸻
📣 Conclusion
The technical roadmap laid out in 2023 has now played out — Bitcoin has achieved its 1.618 Fibonacci extension target. We are now at a critical inflection point. If BTC consolidates well here and maintains volume, the next leg could launch us into new all-time highs beyond $135,000.
🛑 But caution is warranted — overbought signals + weak volume could bring a healthy correction first. Stick to your risk plan. Let the market come to you.
⸻
💬 Feel free to share your views or ask for updates in the comments.
🔔 Follow me for more swing-to-position analysis using volume, fibs & structure.
📊 Chart shared below for reference.
#Bitcoin #BTCUSD #Crypto #TechnicalAnalysis #Fibonacci #PriceTargets #CryptoForecast #ParabolicMove #BTC
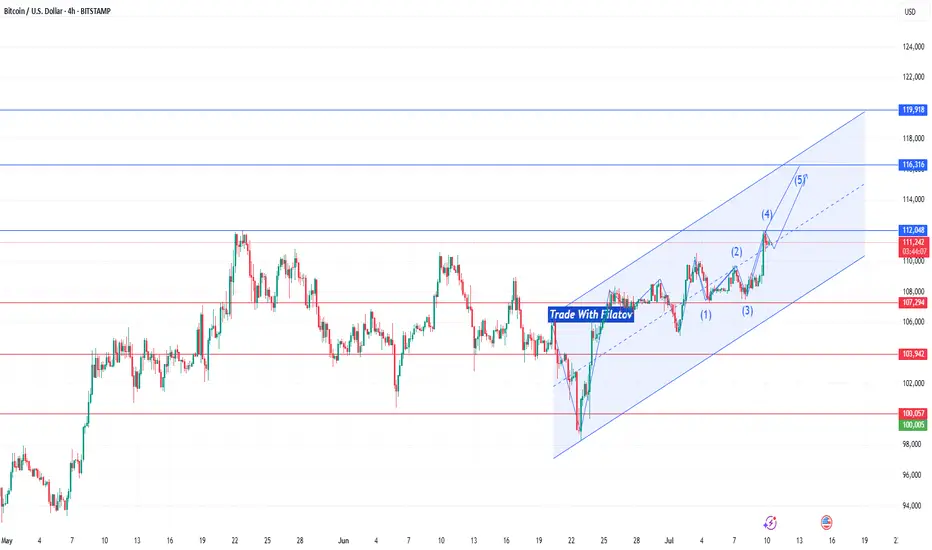
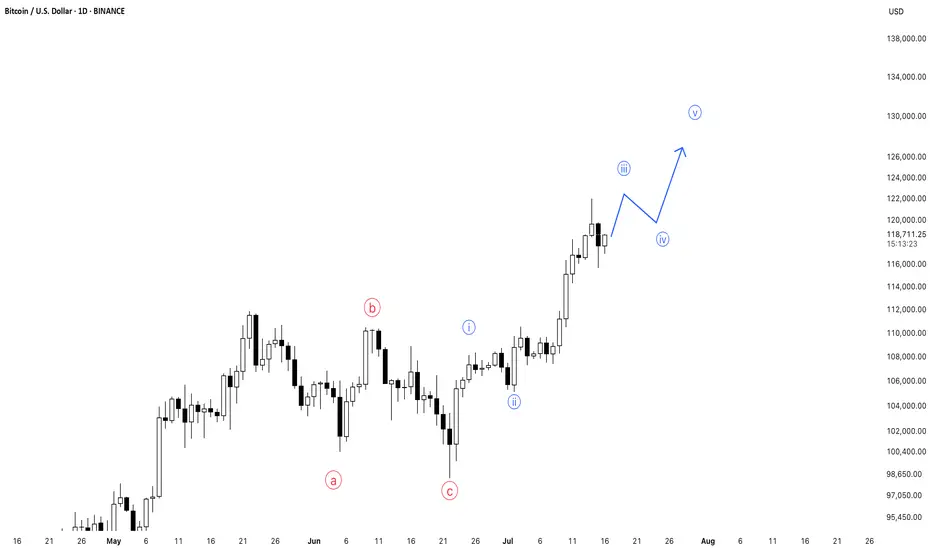
BTC Nearing Completion of Wave 3 – Correction Ahead?Bitcoin is approaching the end of its Wave 3 movement, which suggests a possible correction phase in the near future.
However, this is likely just a temporary pause before the next bullish wave continues the uptrend.
Stay patient and watch for key support levels to prepare for the next buying opportunity.
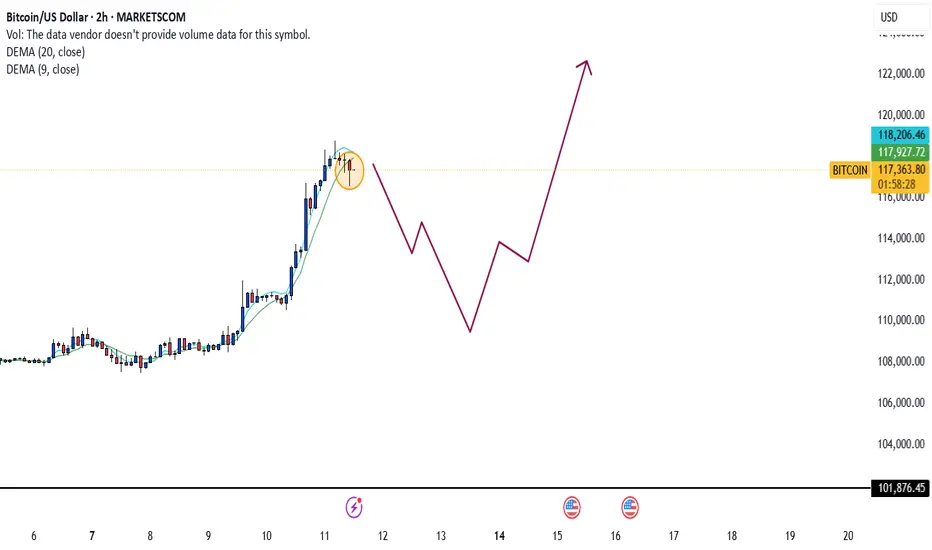
Potential 4hr SwingCurrently looking for clear confluence this week before BTC returns to 120k. Projected Consolidation and Accumulation for 7/16 and 7/17 and looking for a break above around 118k-119k. To load up before the next project hi (key lvl)
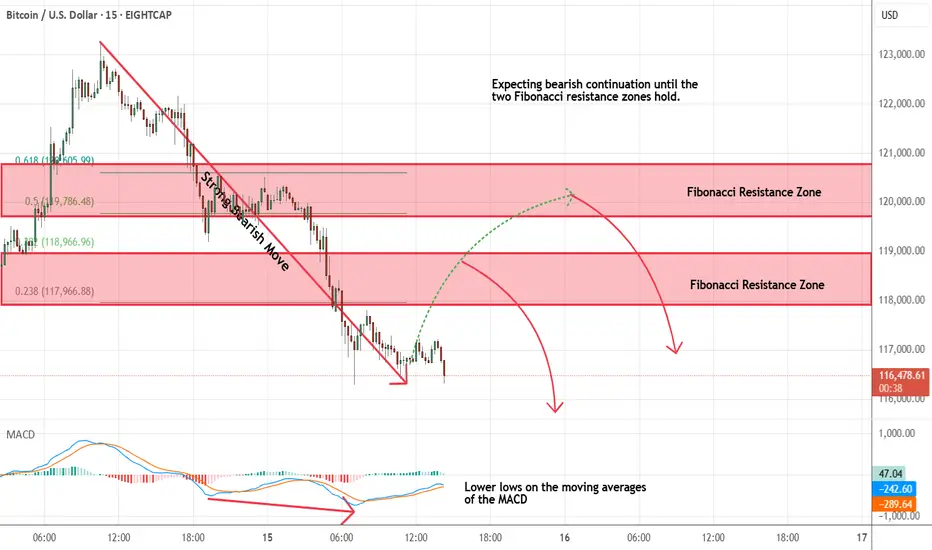
Bitcoin - Looking To Sell Pullbacks In The Short TermM15 - Strong bearish move.
Lower lows on the moving averages of the MACD.
No opposite signs.
Currently it looks like a pullback is happening.
Expecting bearish continuation until the two Fibonacci resistance zones hold.
If you enjoy this idea, don’t forget to LIKE 👍, FOLLOW ✅, SHARE 🙌, and COMMENT ✍! Drop your thoughts and charts below to keep the discussion going. Your support helps keep this content free and reach more people! 🚀
--------------------------------------------------------------------------------------------------------------------
Bitcoin Blow-Off Top?Bitcoin’s daily chart is flashing caution after a sharp reversal candle on Monday was followed by downside continuation today. Yesterday’s session printed an unmistakably ugly candle – a long upper wick signaling rejection at the highs near $120K, with a close well off the top of the range. Crucially, that candle came on elevated volume, adding weight to the move and suggesting a possible blow-off top in the short term.
Today’s follow-through confirms that sellers are taking the reins, at least for now. Price is currently sitting around $116,800 after dropping over 2.5%, with the next major support zone near $112,000 – a level that previously capped price throughout early June before the breakout. If that fails, the 50-day MA and horizontal support around $105,800 should act as the next line of defense.
Volume has remained elevated, showing that this pullback has real participation – not just apathy or a lack of buyers. Bulls need to see price stabilize above $112K and reclaim lost ground quickly, or risk a deeper retrace after such an aggressive upside move.
For now, momentum has clearly stalled, and the risk of a more meaningful correction is on the table.
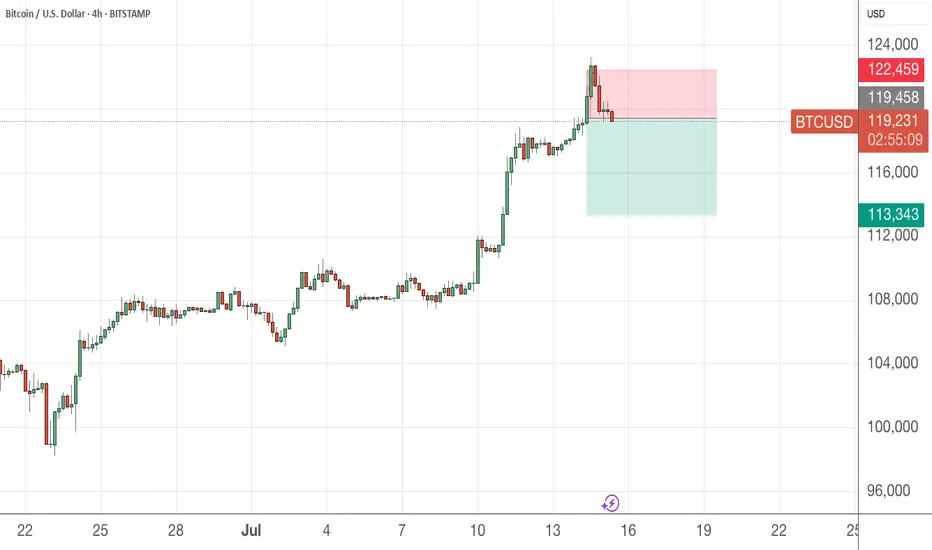
Shorting the Bitcoin now !Please refer to the 4H chart as shown. Good risk reward ratio.
Always have a SL in place.
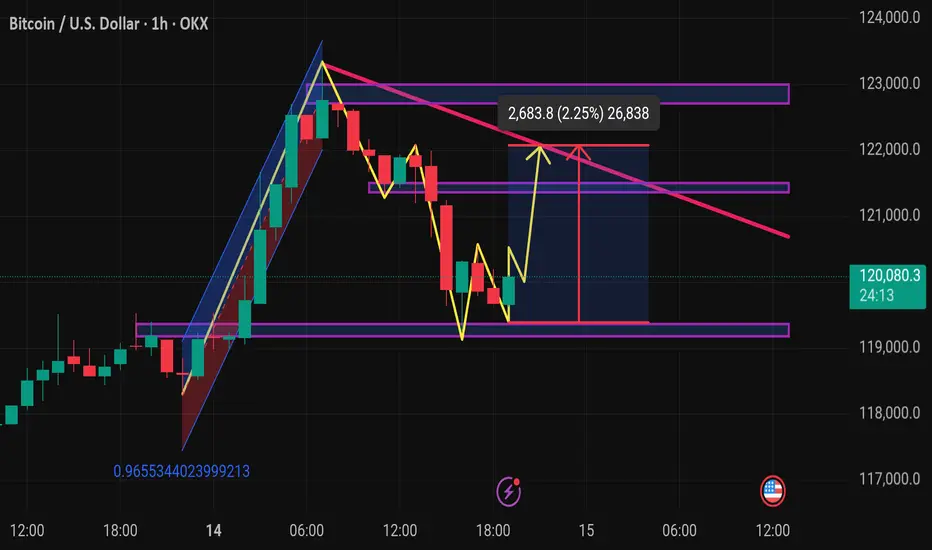
Btcusd techinical analysis.This chart is a 1-hour candlestick chart for Bitcoin/US Dollar (BTC/USD) from OKX, analyzed using TradingView. Here's a breakdown of the technical elements:
---
🔍 Key Observations:
1. Current Price
$120,054.6 with a +0.77% gain.
Price appears to be rebounding from recent support.
2. Chart Patterns & Annotations
Yellow Zigzag Lines: Indicate recent price action and a potential bullish reversal pattern forming.
Purple Zones: Likely represent key support and resistance levels.
Pink Downtrend Line: A descending trendline showing the bearish resistance.
Blue Box Area: Suggests a potential price movement range—either up or down.
---
📈 Technical Analysis Insights
✅ Bullish Case (Upside Scenario)
Break above descending trendline could lead BTC to:
Target: ~122,800 - 123,000
Potential
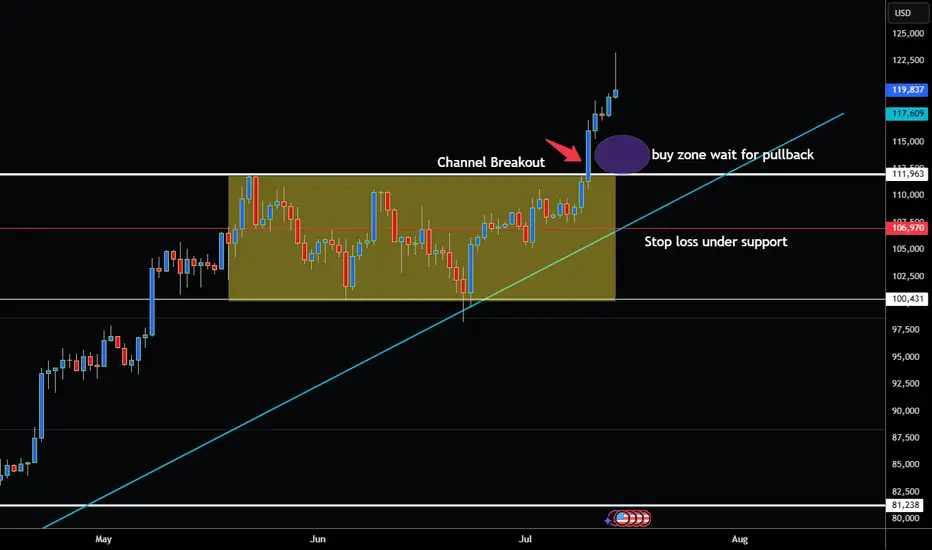
BITCOIN BREAKS OUT OF CHANNEL AND NOW AT ALL TIME HIGHS!Hey Traders wow just a few week ago I was watching to see if it was going to pullback instead smashes above all time high. Thats how quick these markets can change in the blink of an eye!
Lesson here (Always Expect the Unexpected in the Markets!) 😁
Ok so now we have channel breakout above resistance at 112,100. About 70% of the time market will retest this level before continuing the trend.
This could be a great place to buy on the pullback!
So if your bullish buy around $112,100-113,000 I would recommend a wide stop to give the market room to breath around 106,970.
However if bearish I would not consider selling unless market has complete reversal and has daily close below uptrendline at 106,000 .
Bears Be careful because this Bull looks like it has Horns!
Good Luck & Always use Risk Management!
(Just in we are wrong in our analysis most experts recommend never to risk more than 2% of your account equity on any given trade.)
Hope This Helps Your Trading 😃
Clifford
BTC Long and ShortFor chart pattern, TP1 Reahced , mostly will go TP 2.Target swing high (TP 2) and Counter for swing low,after reaching TP2. What do you think guys
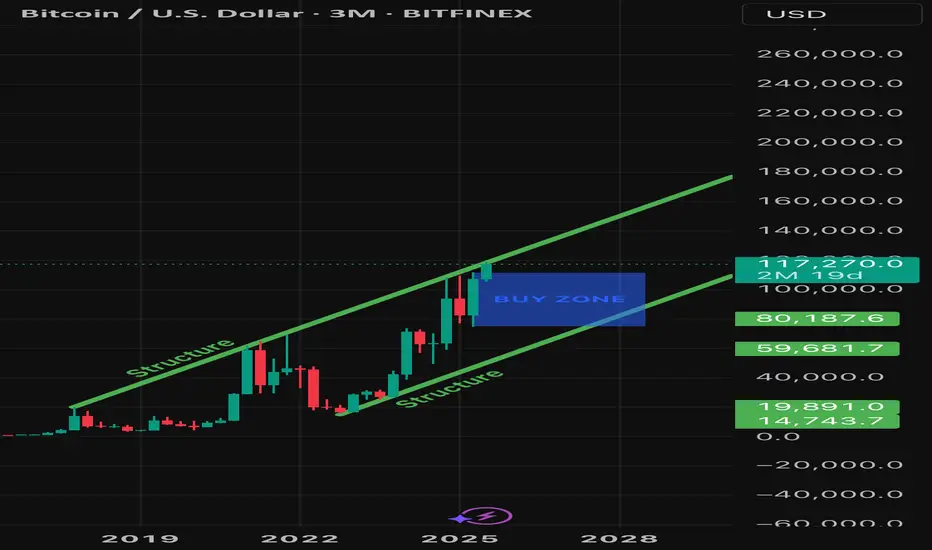
Bitcoin’s ForecastWho knows how high Bitcoin will go but my guess is between 300/350k. What I may know ahead of time is where price may fall, for the buy. I labeled the buy zone which I believe will trigger in January 2027 based off of the pattern Bitcoin has created. I’ve noticed a couple years ago that the best time to buy Bitcoin is in January, the year after being bearish. This is the pattern and you can check for yourselves: 3 years bullish, approximately 1 year bearish. January of 2027 may begin the next bull cycle that could last for 3 years. Stay tuned!
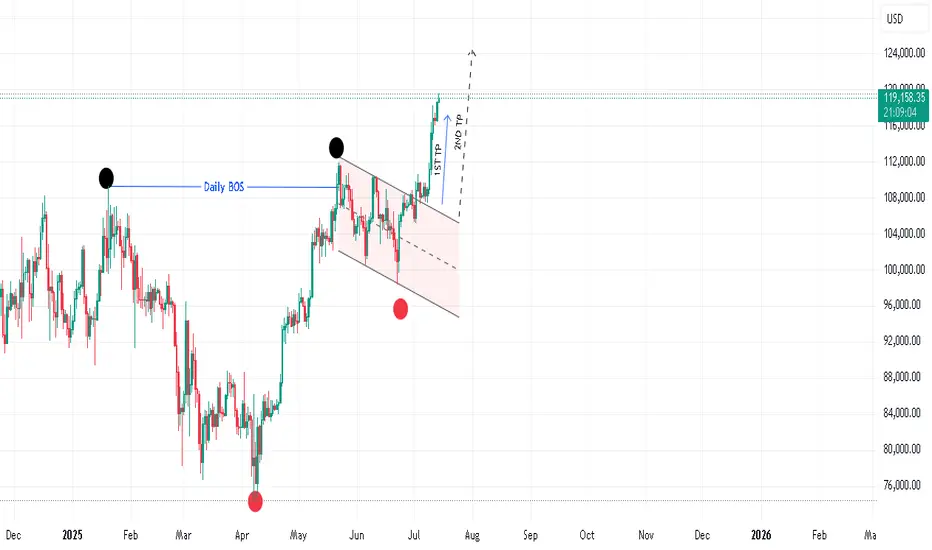
BTC BREAKOUT VERY INSTRUCTIVE Weekly simply shows there are more rooms for BTC to continue the uptrend but lower time frame will let us know better as there may be pullbacks however, we need the weekly candle close above the most recent high of $118,900 to give us that immediate confirmation.
So as not to get trapped by the bears, the best way to trade the buy for BTC is to have a buy-stop Order at $118,900 with SL below $112,000 with very low Lot size depending on your account balance.
Proper risk management is strongly advised
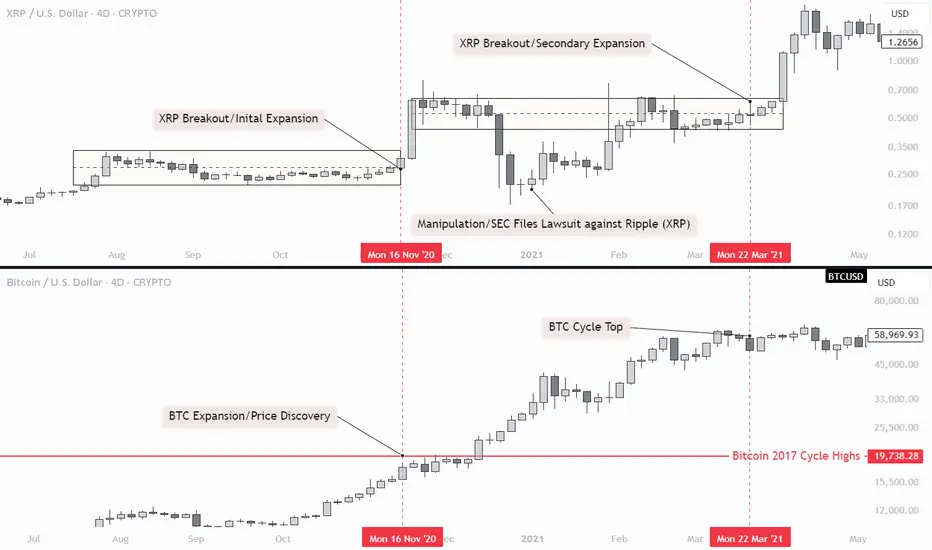
2021 - XRP Two MovesXRP typically moves twice during the cycle: once when BTC breaks its previous cycle highs, and again when BTC tops out at the end of the cycle. These moves often occur in waves of equal length within a 365-day window.
Bitcoin Money machinebeautiful bearish candlstick has been created a the top of the wave , thechnicaly the price might go for a retracement to fuel back up again , place a short position while maintaining a good money management its tricky some time with what's going on
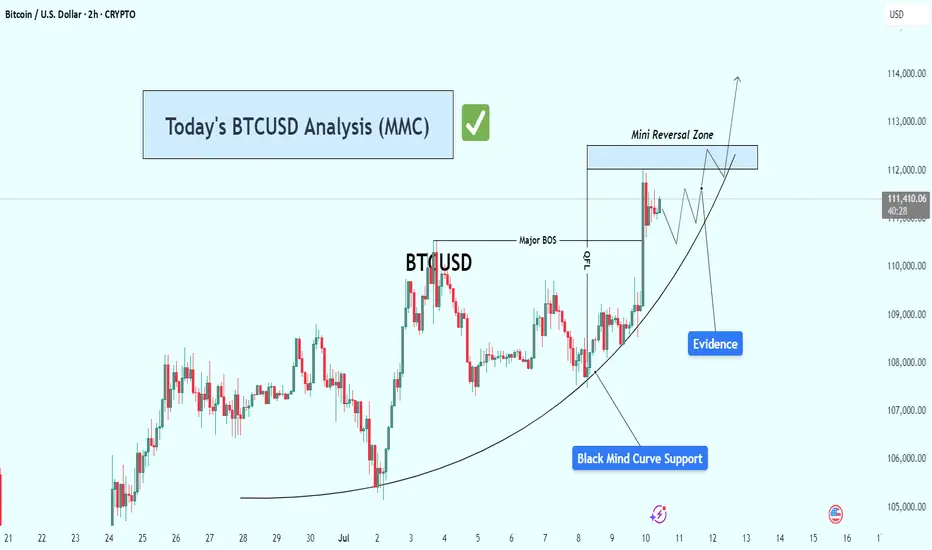
BTCUSD Analysis – Riding the Mind Curve & Bullish Setup Target🔎 Technical Narrative & Market Structure Analysis
Bitcoin is currently respecting a textbook parabolic support structure represented by the Black Mind Curve—a dynamic visual model reflecting the psychology of crowd behavior transitioning from uncertainty to confidence. This curved structure often precedes strong bullish continuation patterns, especially when paired with evidence of smart money involvement.
The current price action shows sequential higher lows, each of which is supported directly by the Mind Curve. These bounces confirm demand stepping in consistently at higher levels, a strong sign of controlled accumulation and momentum building.
🧠 Key Chart Components Explained
✅ 1. Mind Curve (Dynamic Support)
A custom-drawn parabolic curve reflects the ongoing upward force from buyers.
Bitcoin has tested and bounced from this curve multiple times, showing it is respected by market participants.
As price hugs the curve more tightly, the compression could lead to a volatility breakout.
✅ 2. Major BOS (Break of Structure)
A significant market structure break occurred as price took out a previous swing high.
This BOS confirms a shift in market sentiment from ranging/sideways to uptrend formation.
The BOS now acts as a reference point for bullish momentum and could serve as support on a potential retest.
✅ 3. QFL Zone (Quantity following line )
Located just below the BOS, this zone marks the last area where aggressive buyers stepped in before the breakout.
These levels are often defended on a retest and are used by institutional traders to re-enter positions.
✅ 4. Evidence Candle
This sharp bullish impulse candle is what we call an "evidence candle"—it pierces minor resistances with strength and volume.
It represents institutional-level interest and confirms smart money accumulation.
Such candles typically precede either continuation or minor pullback for re-accumulation.
✅ 5. Reversal Zone (Target Zone)
This zone lies ahead at approximately 112,500 to 113,000, a confluence of previous supply, key psychological level, and potential liquidity pool.
It's the next logical area where price may pause, react, or break through if momentum sustains.
⚔️ Scenarios to Watch
🟩 Bullish Scenario:
Price continues riding the curve support upward.
Breaks and closes above the Reversal Zone, ideally with volume and continuation candle.
Potential upside extension toward 114,000–115,000.
🟨 Neutral/Consolidation Scenario:
Price consolidates just below the Reversal Zone.
May form a flag/pennant or triangle structure.
Bullish continuation likely if the curve holds beneath.
🟥 Bearish/Invalidation Scenario:
Price breaks below the Mind Curve and BOS, closing below with momentum.
This would signal a potential breakdown of the bullish structure.
Invalidation zone likely sits below 110,000, and a breakdown could open room to revisit the 108,500–109,000 area.
📌 Confluence Factors Supporting the Bullish Bias:
Respect of Mind Curve over time = hidden institutional support
Presence of BOS and QFL = structure and order block confluence
Evidence candle = high-volume trigger point
Reversal Zone = logical magnet for price, supported by liquidity and previous reactions
📈 Summary & Trading Thesis
Bitcoin is currently in a bullish microstructure within a larger range. The parabola-style Mind Curve suggests that this structure is maturing toward an inflection point. The break above BOS, evidence of strength, and alignment with demand zones all support a move toward the 112,500–113,000 Reversal Zone. If momentum sustains, this could become the start of a broader bullish leg.
📢 Final Thought:
While the setup is bullish, discipline and patience are key. Watching how price behaves around the Reversal Zone will be critical. A clean breakout or solid rejection will provide the next high-probability signal.
Bitcoin Buy Bias – On-Chain Confidence Still Has Room to RunThe On-chain Confidence indicator is showing signs of increasing sell pressure and profit-taking, but it still remains well below the historical peaks seen in previous bull market tops (2017 & 2021).
👉 This is a composite indicator combining several key on-chain metrics like RHODL Ratio, Puell Multiple, and MVRV, among others.
📊 The current level resembles early 2024 and early 2025, suggesting we are not yet at extreme sentiment levels.
If this indicator continues to climb toward its previous cycle highs, it may signal that we’re entering the final leg of this bull run. For now, there’s still room for upside momentum.
Bitcoin long from 114kWaiting for cme gap to close at that region.
We also have a fvg . Looking for longs.
Continuation higher is a must.
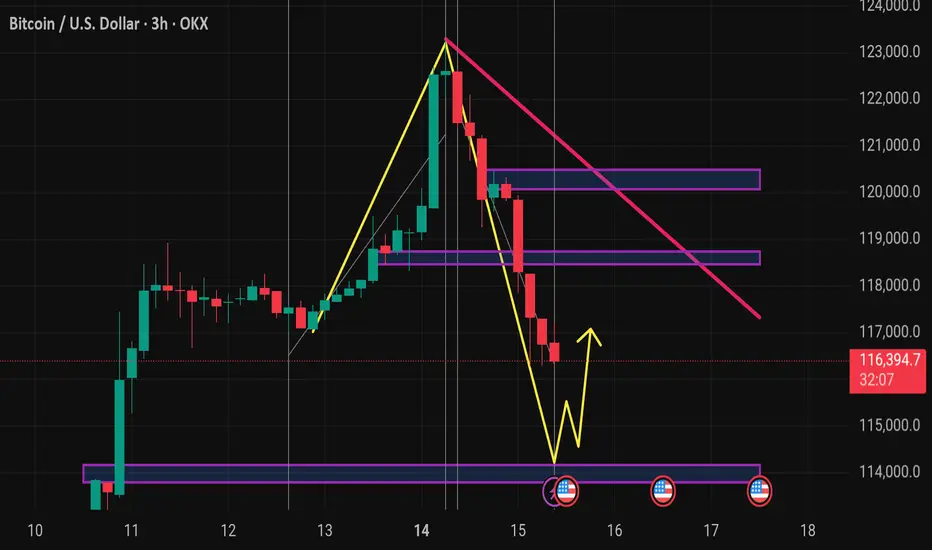
Btcusd techinical analysis.This chart displays the Bitcoin (BTC/USD) 3-hour price action with several technical indicators and patterns annotated. Here's a breakdown of what it shows:
Key Observations:
1. Price Action:
BTC is currently priced around $116,386, showing a -2.93% drop.
A strong downtrend has formed after a significant upward move, possibly forming a bearish ABCD pattern.
2. Harmonic Pattern:
The chart appears to reflect a completed harmonic retracement, with a deep retracement (near 0.88 Fibonacci level).
This suggests a potential reversal or bounce zone.
3. Support & Resistance Zones:
Several purple horizontal boxes indicate key support and resistance zones.
The current price is approaching a major support zone near $114,000–$115,000, which has been tested previously (visible on the left side).
4. Trend Lines:
A pink downward trend line suggests ongoing bearish momentum.
Price may need to break above this line to confirm a reversal.
5. Yellow Zig-Zag Path:
Indicates a possible bullish reversal scenario, predicting a bounce off the lower support zone followed by a move upward.
6. Event Markers:
Red circular icons (with flags) near the support zone hint at upcoming fundamental news/events that may influence price action.
---
Interpretation:
Short-term bias: Bearish until strong support holds (~$114,000–$115,000).
Possible trade setup: Watch for bullish reversal signals at support (candlestick patterns, RSI divergence, etc.) before entering long.
**Risk
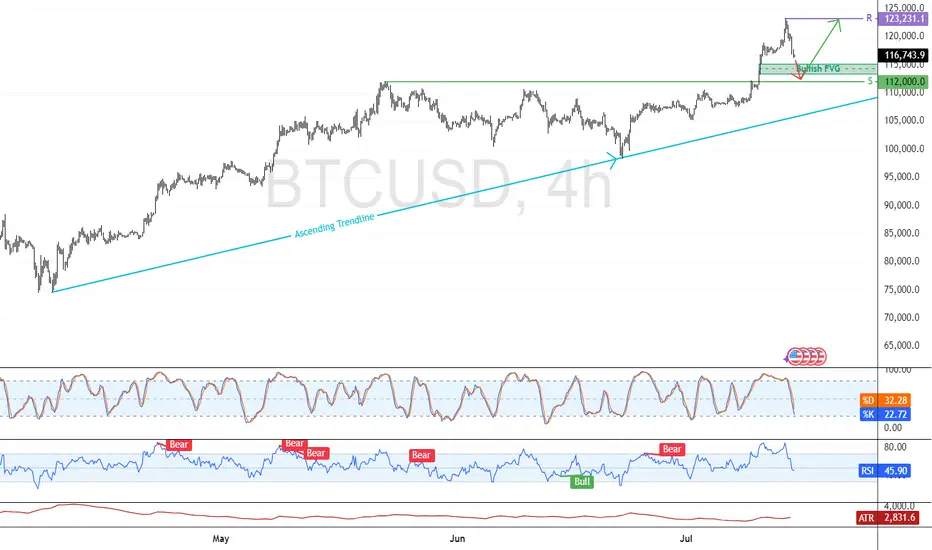
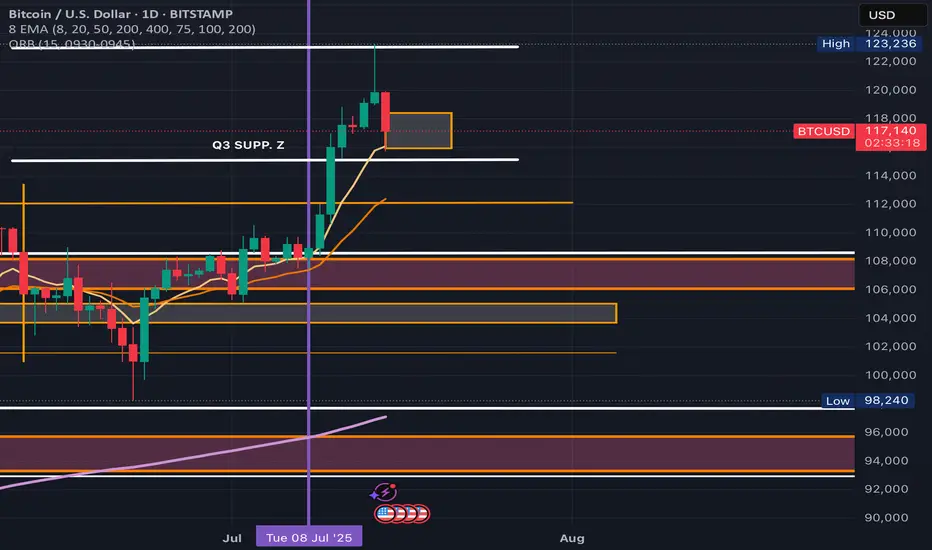
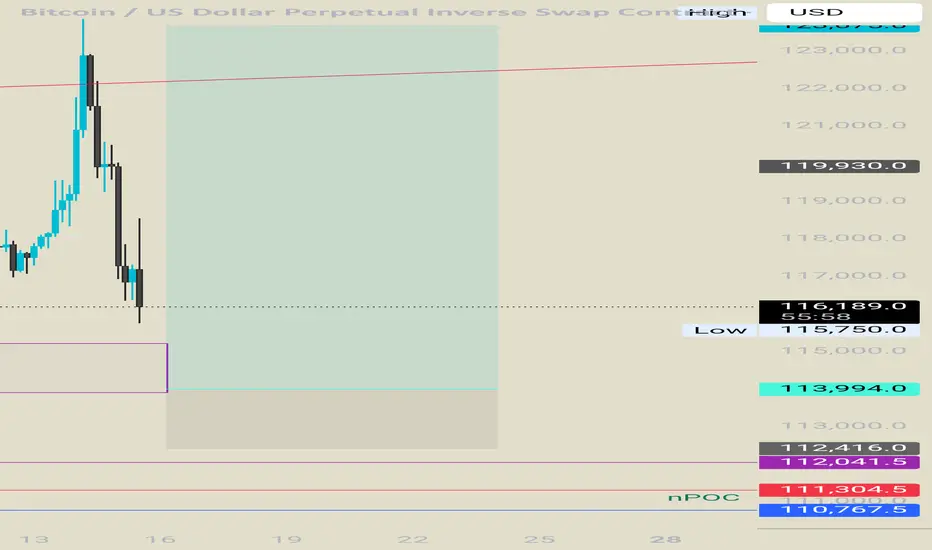
Bitcoin: Support at $112K Holds Key to Bullish ContinuationFenzoFx—Bitcoin is bullish, trading above $112,000.0 after forming a new all-time high at $123,231.0. The current dip may offer a strong reentry if $112,000.0 holds as support, aligning with a bullish fair value gap.
Price remains above the ascending trendline, reinforcing the bullish outlook. If momentum continues and BTC breaks past $123,231.0, the next target could be $130,000.0.
A fall below the trendline would invalidate the bullish setup.