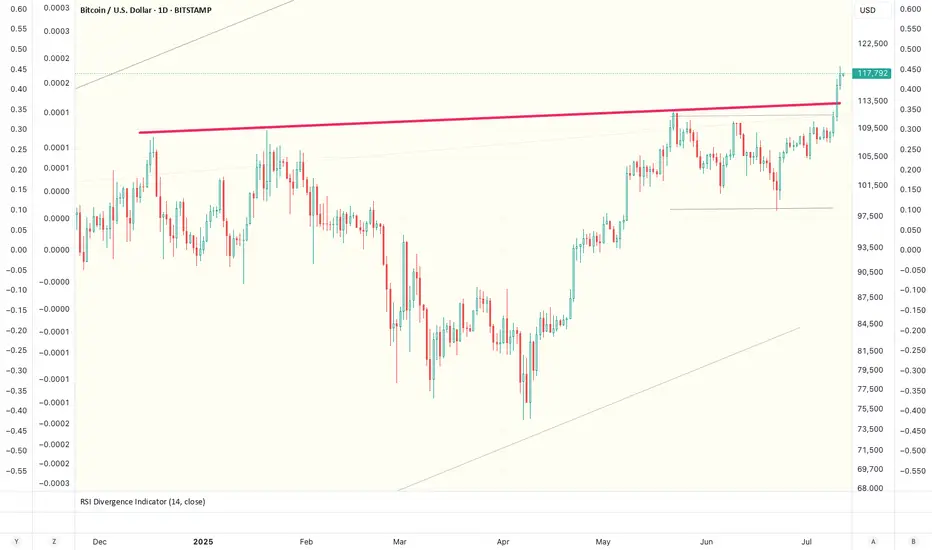
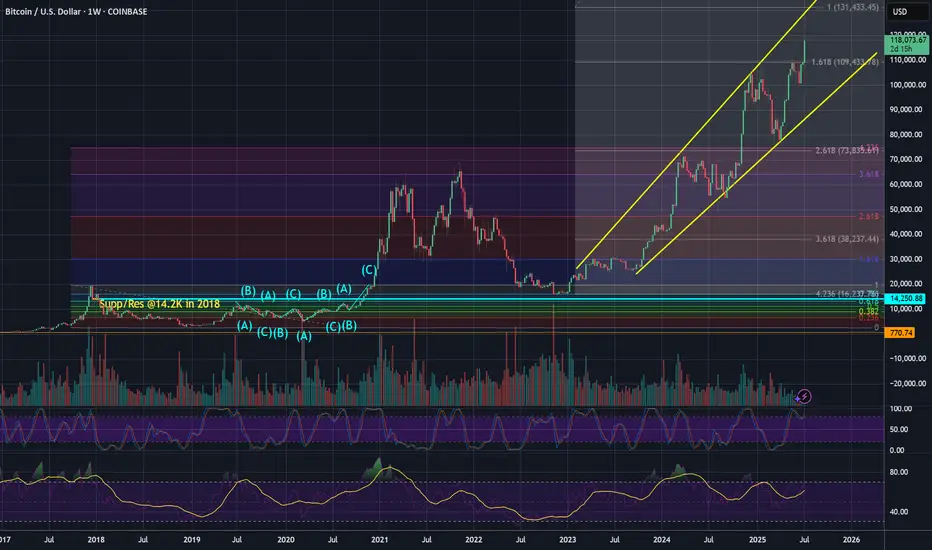
Retail in?After almost 3 decades as a trader, if there is one thing I have learned over the years, significant highs are made when sentiment is at extremes. Whether it is "mom and pop" or the "shoeshine guy" calling the top, it's when the buying (or selling) by retail is at a fever pitch. These days, you can't find a bear in Bitcoin, and the days on end of reports preaching "record inflows" is almost deafening.
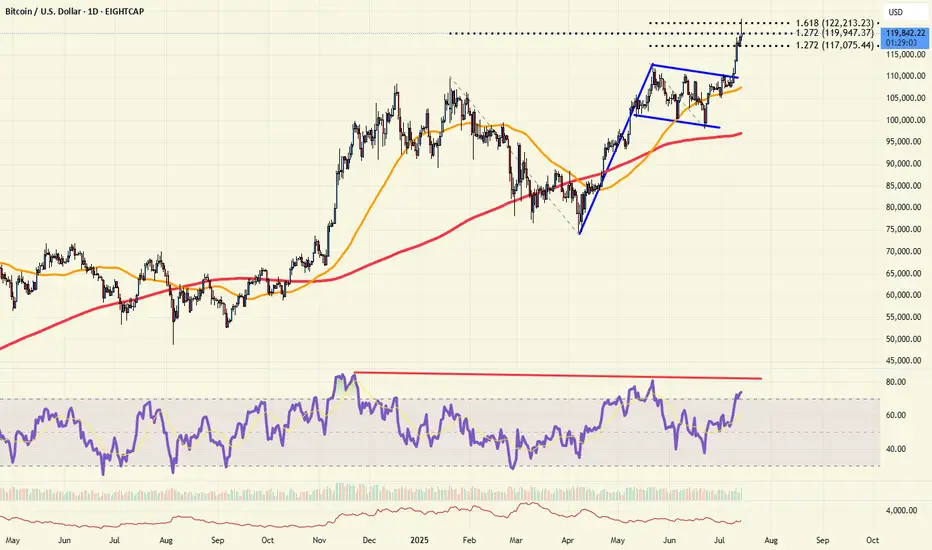
Technically, Bitcoin is probing some key resistance today. It's stalled by the 161% Fibonacci extension of the recent early May highs to June lows. More importantly is the 127% extension of the January highs to April lows. RSI is very divergent as price hits new highs. And with sentiment at near extremes, bulls should be careful now. And a break back below the 112k level would be a very bearish "topping pattern" event.
BITCOIN trade ideas
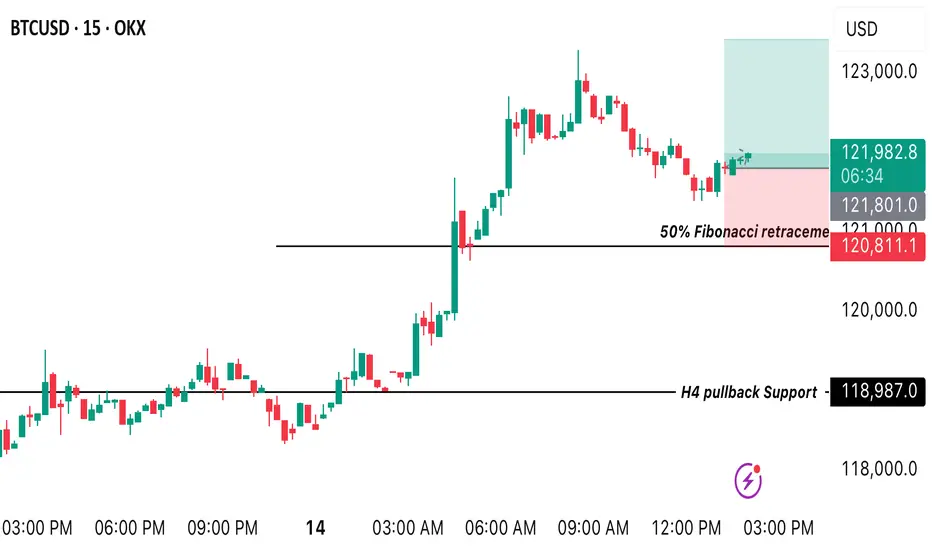
BTC/USD BUY OPPORTUNITY We’re looking at the market structures BTC is making from the M15 timeframe and we can spot a nice buy opportunity around the 38.2% fibo retracement of the recent impulse like pattern created in H4 I still believe price is going to trade bullish up onto $123419 A buy opportunity is envisaged from the current market price.
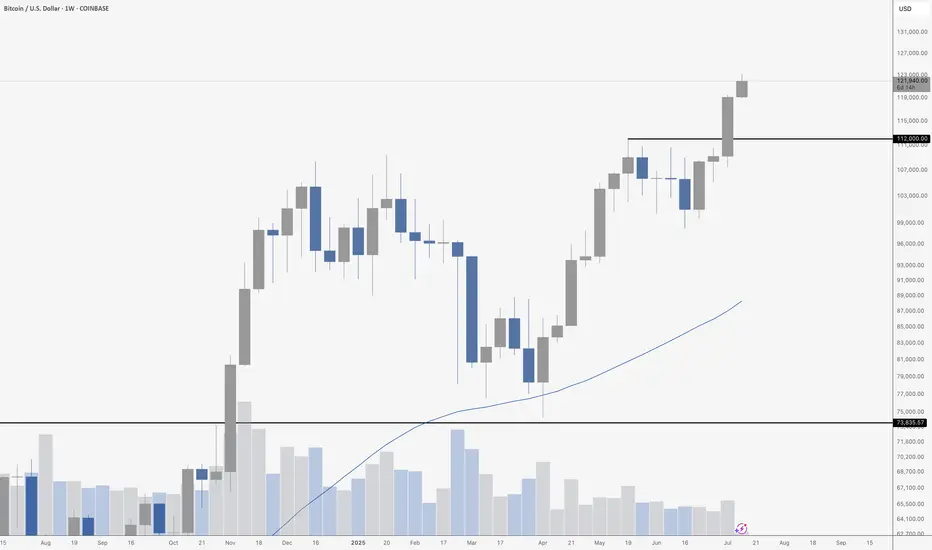
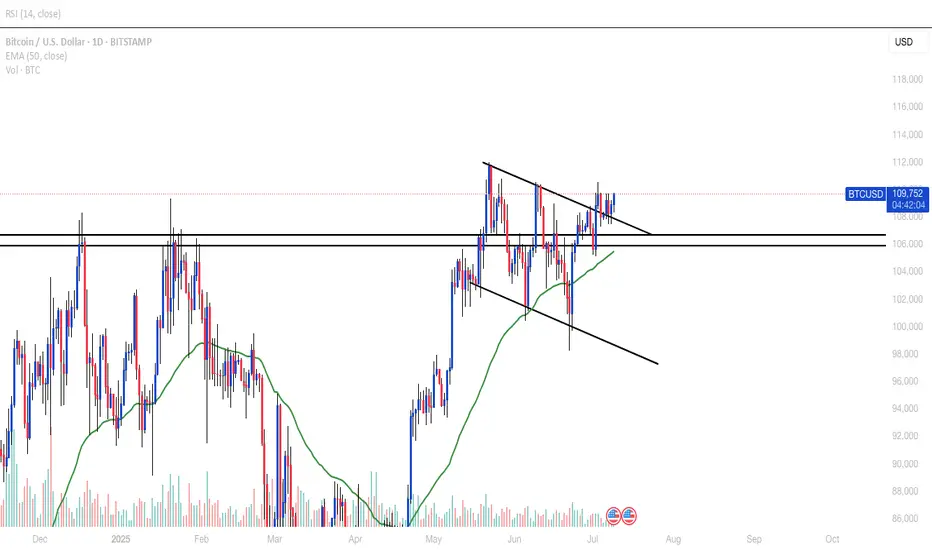
Bitcoin's Blue SkyBitcoin just closed another weekly candle near its highs – and this one confirmed what the last few were hinting at: the bulls are fully in charge. Price exploded through the \$112,000 resistance level, turned it into support, and barely looked back. The move wasn’t subtle either – it was loud, confident, and backed by a strong candle with virtually no upper wick. That tells you all you need to know: there’s no hesitation here, just buyers pushing price higher. If this were a poker game, Bitcoin just went all-in on momentum, and no one at the table seems brave enough to call its bluff.
Even more impressive is how clean the breakout structure looks. After consolidating under \$112K for weeks, BTC finally made its move, leaving behind a textbook support/resistance flip. As long as that zone holds, the path of least resistance is clearly up. There’s no major historical resistance overhead, which means we’re officially in price discovery – that magical place where technicals matter less and raw sentiment takes the wheel. The music is playing, and Bitcoin’s dancing like no one’s watching.
Volume has been quietly rising, even if it’s not screaming just yet. That’s a sign of real interest – not a frenzy, but sustained institutional nibbling and long-term conviction. The 50-week moving average is lagging far behind (hovering somewhere in the \$80K range), which tells you how strong this trend really is. That line’s not catching up anytime soon – it’s gasping for air while price is sprinting ahead.
Could we get a pullback? Sure. That’s always on the table. But unless BTC fumbles back below \$112K, the bulls aren’t just in control – they’re rewriting the rules. Next major psychological zones are \$125K, \$130K, and \$135K, and with each passing week, they’re looking less like distant targets and more like stepping stones. Buckle up.
BtcBtc always up..if are break down this red arrow it will be retracement movement..important just buy for long and sell for short term
BTC 150,000H&S
Money Flow in full force
BTC supported by CBs
YTD 26%
1 Year 70%
Now Target 150,000 by Dcc 25
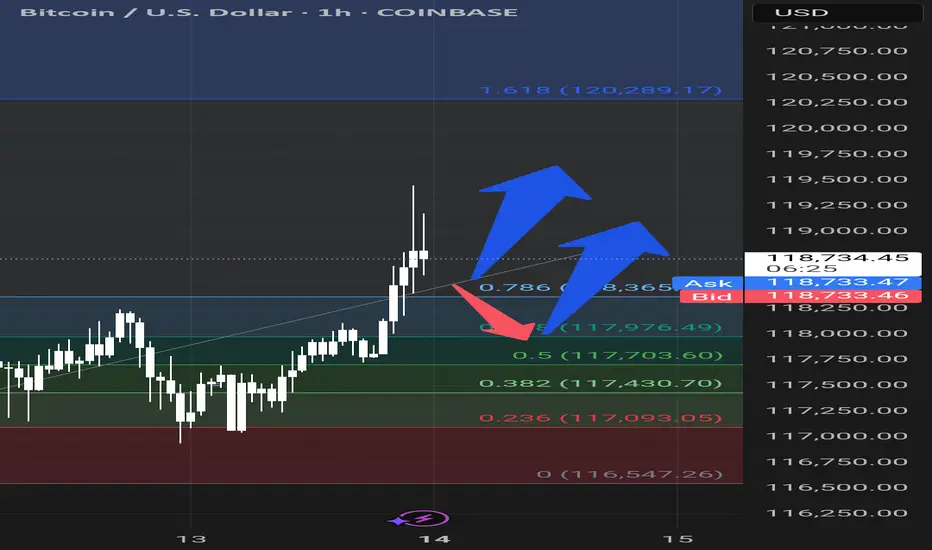
Keep an eye on 117k as the level to stay above.This is the first time in 7 years that Bitcoin has been able to push up through a long trendline originating in 2018. And this is the longest time we have been above this level, with April 2021 spending one day above it.
Yes, all those shorts calling for a deep retracement got rekt, but a clock is right once a day - so there is always that possibility that we will see some profit taking and consolidation here.
We want to stay above the low in this latest move at 117,250 USD. And we are trying to close the day above the 50% of this latest move, which comes in at 117k USD. Anything less increases the risk of a pullback to digest these latest gains.
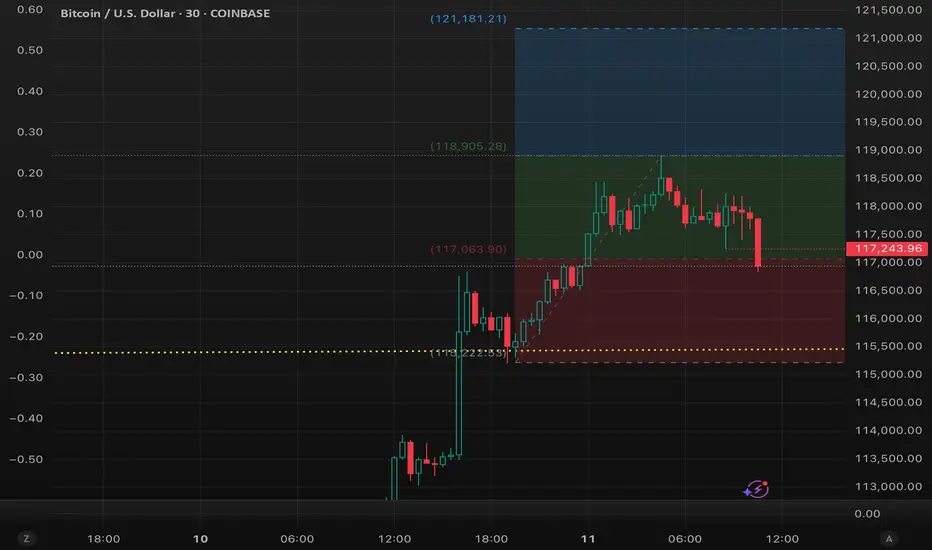
BTC BULLS IS IN CONTROL Bitcoin holds strong in its bullish sentiment, securing a fresh high at 111K.
With momentum on its side, a new projection toward 120K is now firmly in play — the bullish trajectory stays intact. 📈
Momentum traders, stay alert. This leg might just be getting started. follow for more insights , comment and boost idea .
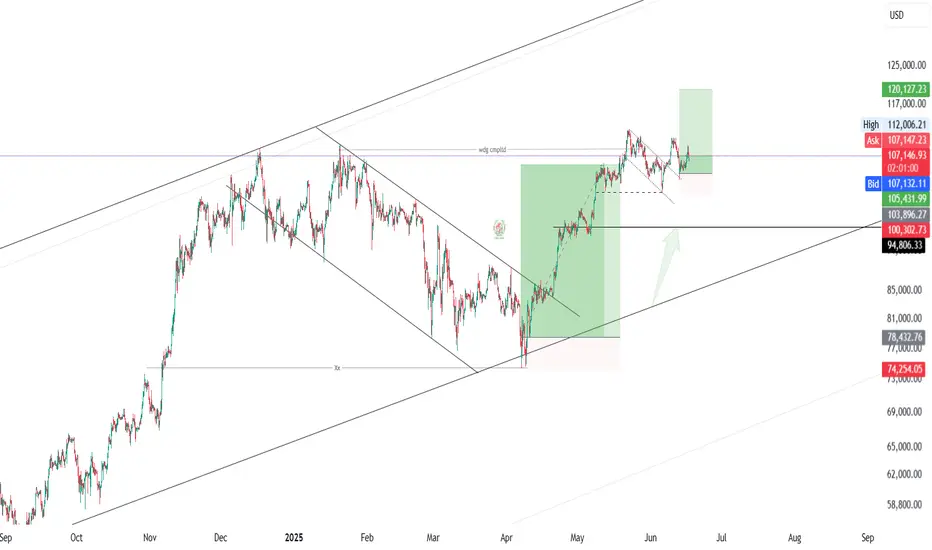
BTC - I made this chart in early 2021Shocking to login in to Trading View after 4 years to see this chart saved and how well the fib targets and channel is playing out.
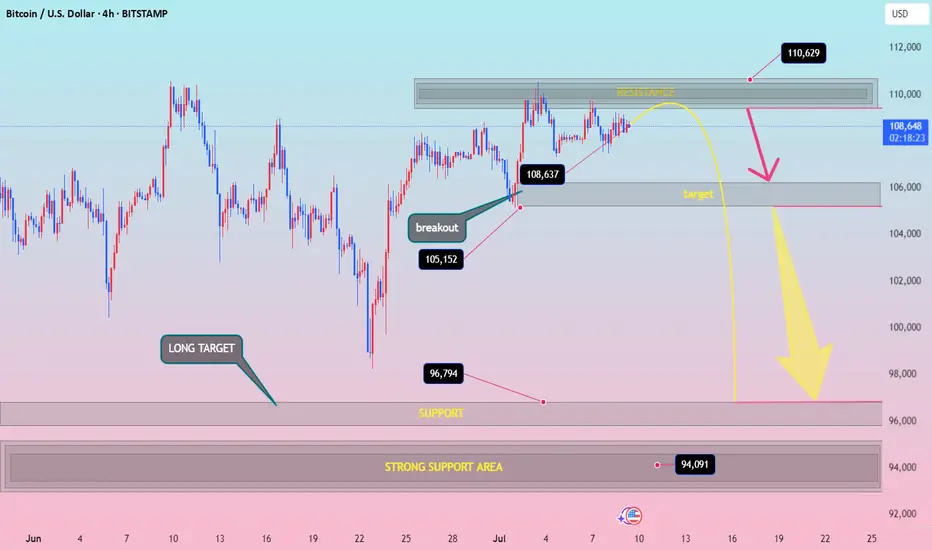
BTCUSD h4 down surelybtcusd down idia Resistance Zone: Around 110,000–111,000
Price Action Expectation:
→ Short-term push to 110,629
→ Then rejection toward 105,000, and potentially all the way down to 96,794 or even 94,091
Bearish bias after resistance is hit
⚡ Disruption Analysis (Contrarian View)
✅ 1. Resistance Flip Possibility
What if the 110,000 resistance breaks cleanly with strong volume?
Invalidates the bearish rejection arrow
Could trigger FOMO buying → Acceleration toward 112,500+
Bullish scenario: formation of a bull flag above resistance = continuation setup
✅ 2. Bear Trap Theory at 105,000 Zone
That “target” zone near 105k could be a fake breakdown zone
Market might dip there briefly, lure shorts, then reverse violently
This creates liquidity for a rapid long squeeze breakout
✅ 3. Market Structure Still Bullish on HTF
Higher lows from June 24 to July 6
Clean breakout at 105,152
Still respecting ascending structure — which is not bearish yet
🚨 Disruption Summary Chart Moves
🔼 Alternate Path 1 (Bullish Disruption):
Price consolidates under resistance → breaks above 110,629 → targets 112,500–115,000
🔄 Alternate Path 2 (Fake Breakdown Disruption):
Drops to 105,000, triggers sell-off → sharp reversal → back above 108,637
🔽 Original Path (Rejection-Based Bearish):
Still possible — but not the only high-probability path anymore
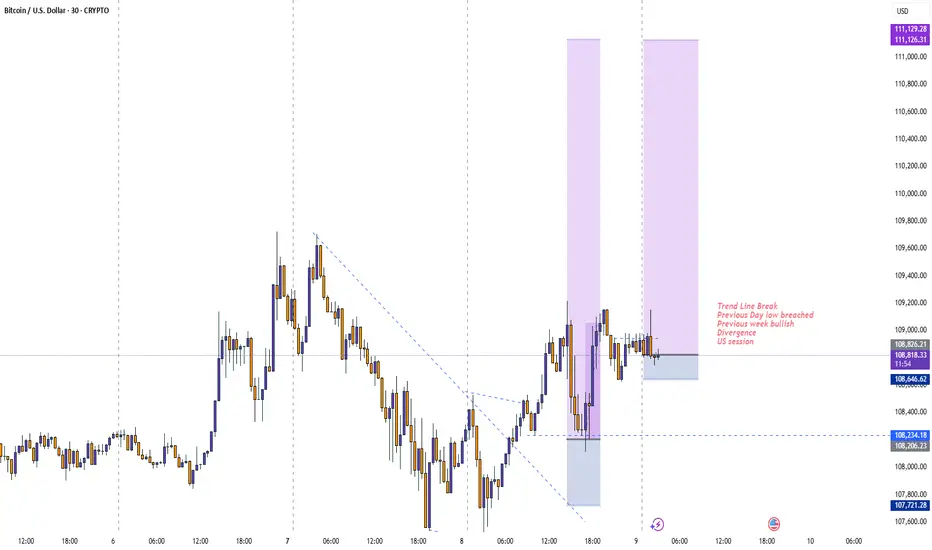
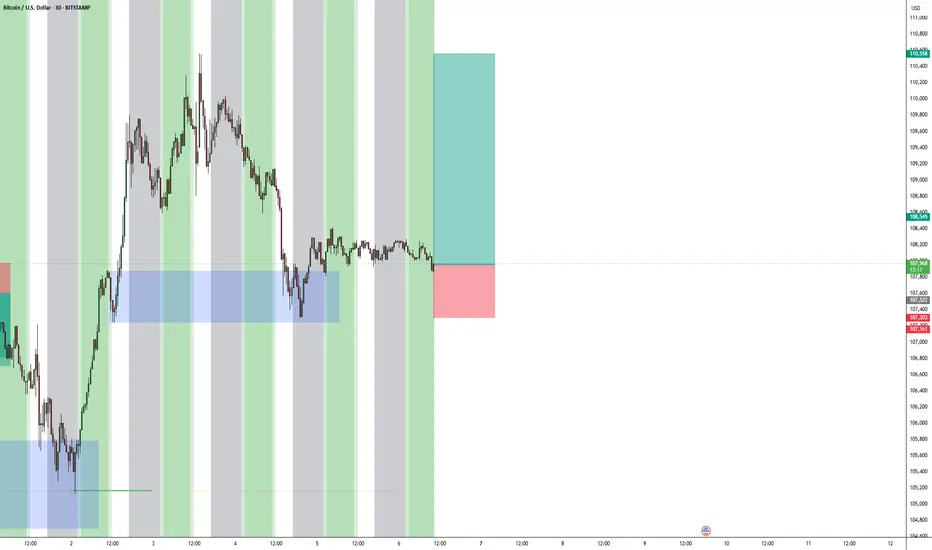
BuyAdditional Entry
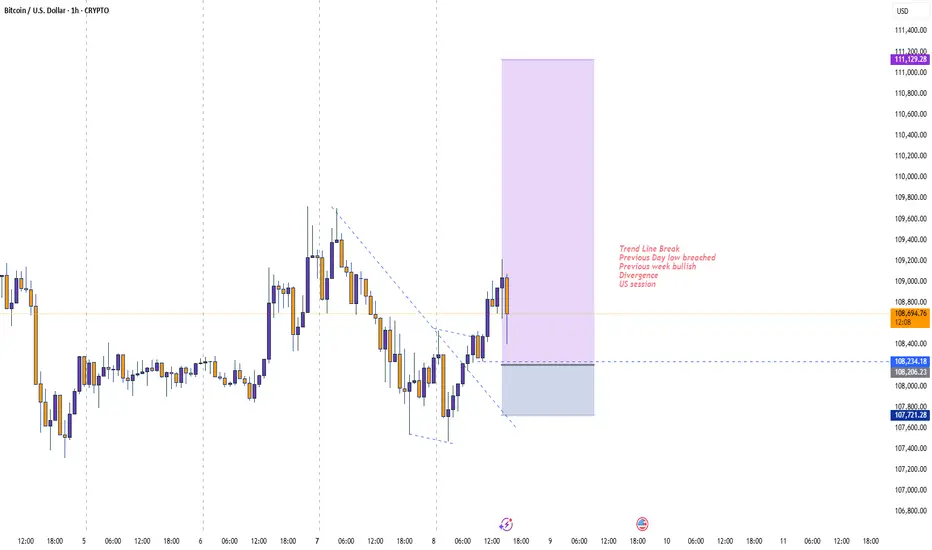
Trend Line Break
Previous Day low breached
Previous week bullish
Divergence
US session
Trade
Manage
Smile
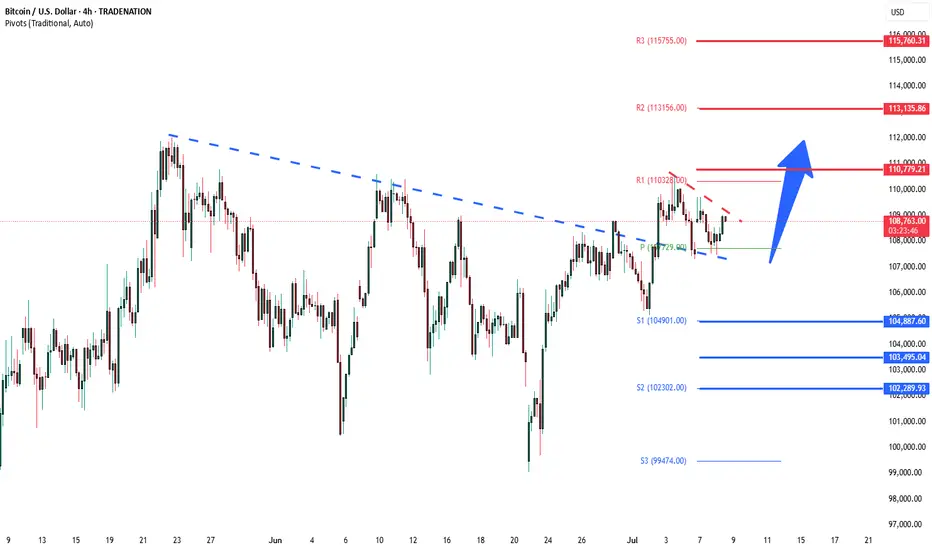
BTCUSD Bullish resistance breakoutThe BTCUSD remains in a bullish trend, with recent price action showing signs of a resistance breakout within the broader uptrend.
Support Zone: 104,890 – a key level from previous consolidation. Price is currently testing or approaching this level.
A bullish rebound from 104,890 would confirm ongoing upside momentum, with potential targets at:
110.780 – initial resistance
113.140 – psychological and structural level
115,760 – extended resistance on the longer-term chart
Bearish Scenario:
A confirmed break and daily close below 104,890 would weaken the bullish outlook and suggest deeper downside risk toward:
103,500 – minor support
102,290 – stronger support and potential demand zone
Outlook:
Bullish bias remains intact while the BTCUSD holds above 104,890. A sustained break below this level could shift momentum to the downside in the short term.
This communication is for informational purposes only and should not be viewed as any form of recommendation as to a particular course of action or as investment advice. It is not intended as an offer or solicitation for the purchase or sale of any financial instrument or as an official confirmation of any transaction. Opinions, estimates and assumptions expressed herein are made as of the date of this communication and are subject to change without notice. This communication has been prepared based upon information, including market prices, data and other information, believed to be reliable; however, Trade Nation does not warrant its completeness or accuracy. All market prices and market data contained in or attached to this communication are indicative and subject to change without notice.
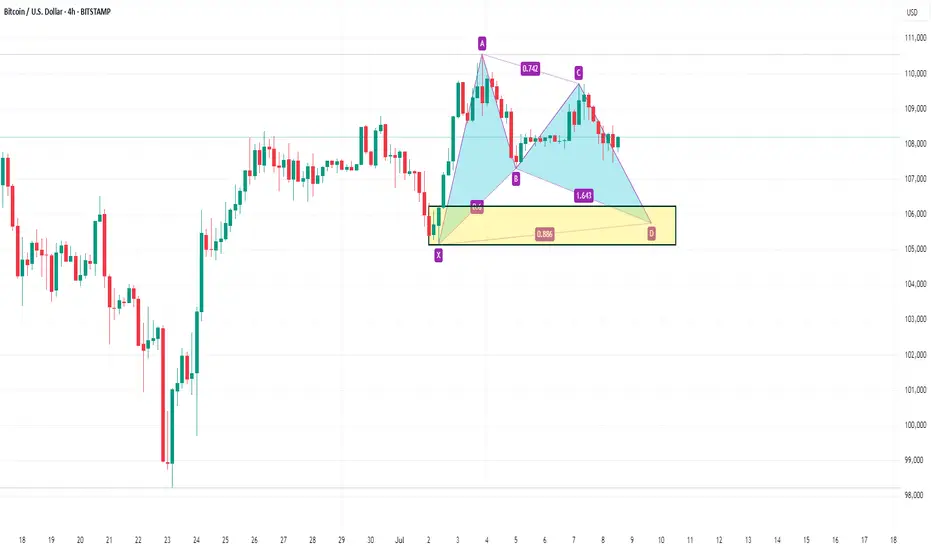
BTCUSD BUY 105750On the 4-hour chart, BTCUSD is currently oscillating at a high level. Currently, we can pay attention to the support near 105750, which is a potential buying position for the bullish bat pattern. At the same time, this position is in the demand area.
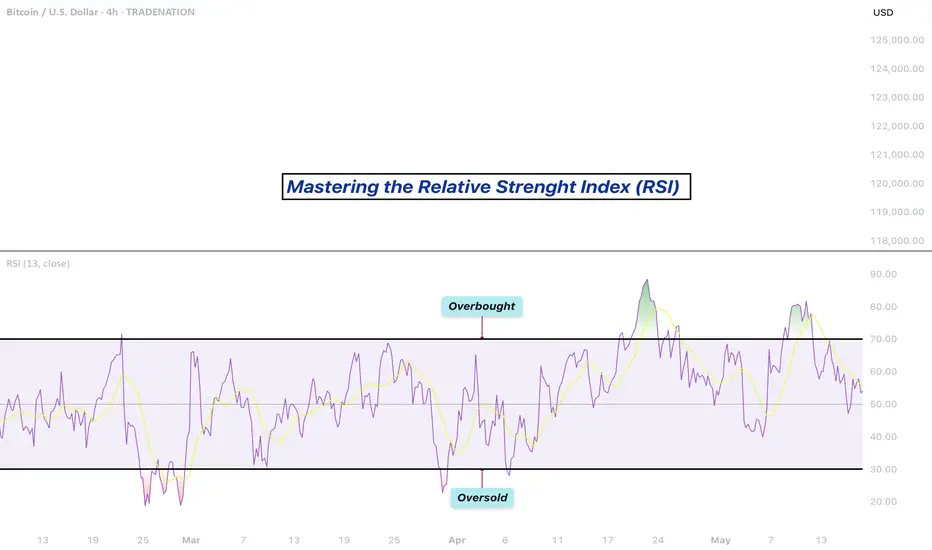
Mastering the RSI - How to use it in trading?What will be discussed?
- What is the RSI?
- RSI overbought
- RSI oversold
- RSI divergences
- How to use the RSI
- How to trade with the RSI
What is the RSI?
The Relative Strength Index (RSI) is a popular momentum oscillator used in technical analysis to measure the speed and change of price movements. Developed by J. Welles Wilder Jr., it ranges from 0 to 100 and helps traders evaluate whether a security is overbought or oversold. The RSI typically uses a 14-period timeframe and is calculated based on the average gains and losses over that period. A rising RSI suggests increasing buying momentum, while a falling RSI indicates growing selling pressure.
RSI overbought
When the RSI rises above 70, the asset is generally considered overbought. This condition indicates that the price may have risen too quickly and could be due for a correction or pullback. However, being overbought doesn't automatically mean a reversal will occur, it signals that bullish momentum is strong, and traders should be cautious of potential trend exhaustion.
RSI oversold
Conversely, an RSI reading below 30 is typically seen as a sign that the asset is oversold. This condition suggests the price may have fallen too sharply and could be primed for a rebound. Just like with the overbought condition, an oversold RSI doesn’t guarantee an immediate reversal but serves as a warning that bearish momentum may be overextended.
RSI divergences
Divergences occur when the RSI and the price of the asset move in opposite directions. A bullish divergence happens when the price makes a lower low, but the RSI forms a higher low, potentially signaling a reversal to the upside. A bearish divergence occurs when the price makes a higher high, but the RSI creates a lower high, possibly indicating a downward reversal. Divergences are often used to spot early signs of trend changes.
How to use the RSI?
To use the RSI effectively, traders typically look for overbought and oversold conditions to time entries and exits, combine it with other technical indicators for confirmation, and watch for divergences as a sign of potential reversals. RSI can also be adapted for different timeframes or strategies, depending on whether the trader is looking for short-term swings or long-term trend analysis. While it’s a powerful tool, RSI should not be used in isolation, it works best as part of a broader trading plan that considers market context and risk management.
How to trade with the RSI?
The RSI can be a powerful tool for identifying potential trade setups. When the price approaches a key support zone while the RSI remains in overbought territory, this may signal an early warning of a possible market reversal. However, rather than acting immediately, it's wise to wait for confirmation. A clear candlestick reversal pattern, such as a bullish engulfing candle or a pin bar, a provide stronger evidence that momentum is shifting. By combining RSI readings with price action and support levels, traders can improve the accuracy and timing of their entries.
Disclosure: I am part of Trade Nation's Influencer program and receive a monthly fee for using their TradingView charts in my analysis.
Thanks for your support.
- Make sure to follow me so you don't miss out on the next analysis!
- Drop a like and leave a comment!
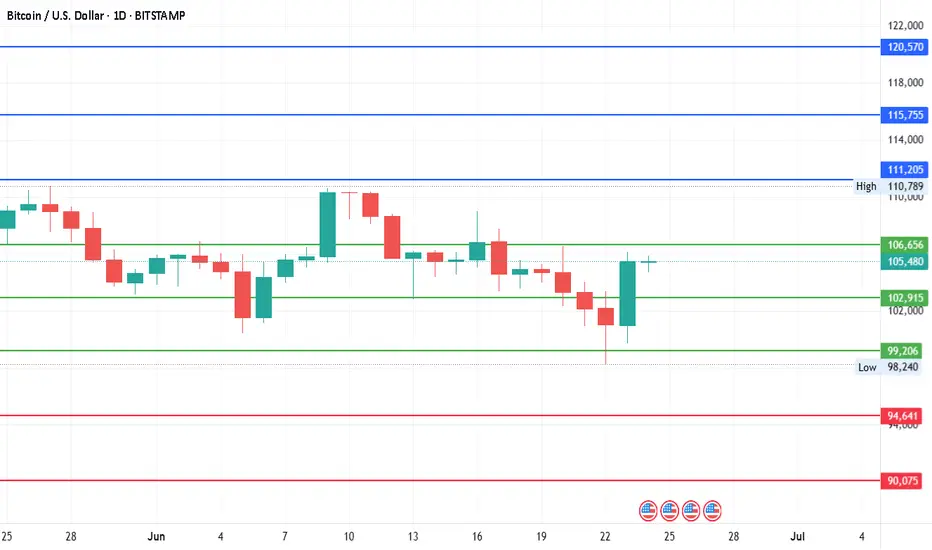
#Bitcoin - Pivot is $102915 | Target $125385 or $80445 ?Date: 24-06-2025
#Bitcoin
Current Price: 105375
Pivot Point: 102915.00 Support: 99206.48 Resistance: 106655.63
#Bitcoin Upside Targets:
Target 1: 111205.31
Target 2: 115755.00
Target 3: 120570.00
Target 4: 125385.00
#Bitcoin Downside Targets:
Target 1: 94640.74
Target 2: 90075
Target 3: 85260
Target 4: 80445.00
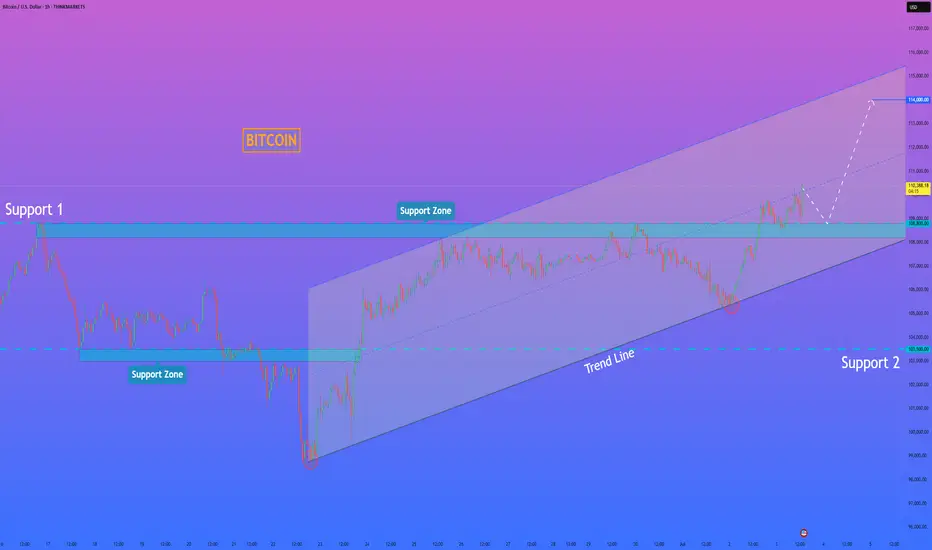
HelenP. I Bitcoin may correct to support level and continue growHi folks today I'm prepared for you Bitcoin analytics. If we look at the chart, the price has formed a clean upward channel after bouncing from the strong support zone at 103500 - 103000 points. This movement marked the beginning of a new bullish phase. Price continued to rise step by step, confirming the structure with higher highs and higher lows. After reaching above 110000 points, it made a minor pullback but still trades above Support 1 - 108800 points. This zone, 108800 - 108200 points, aligns well with the midline of the channel and may serve as a strong area for buyers to re-enter. The price is currently trading around 110382 points and is still respecting the channel structure. As long as BTCUSD stays above the support zone and inside the ascending channel, I expect a potential continuation toward the upper boundary. My current goal is 114000 points - near the resistance line of this bullish channel. Given the strong trendline support, clean reaction at each correction, and buyer activity on lows, I remain bullish and anticipate further growth. If you like my analytics you may support me with your like/comment ❤️
Disclaimer: As part of ThinkMarkets’ Influencer Program, I am sponsored to share and publish their charts in my analysis.
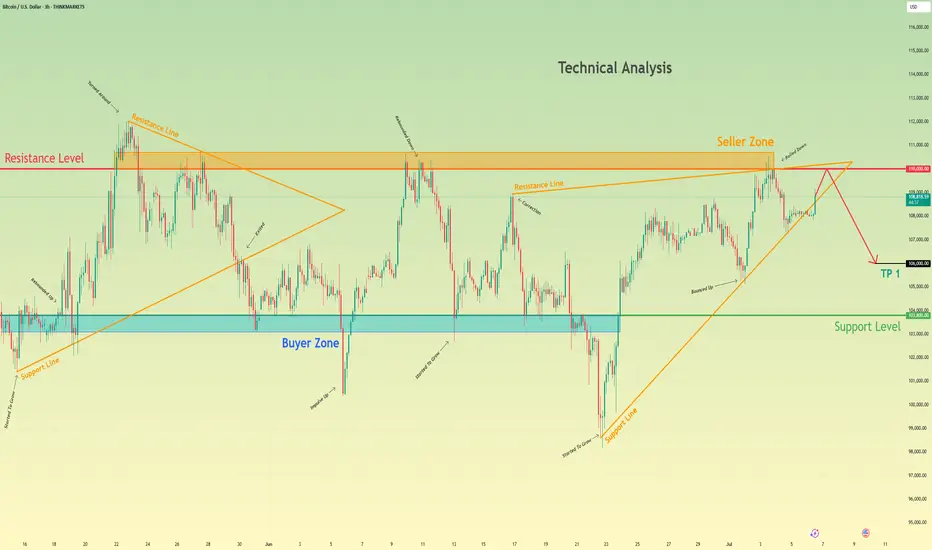
Bitcoin can rebound from resistance level and start to declineHello traders, I want share with you my opinion about Bitcoin. Recently, the price broke above a local resistance and quickly approached the key resistance level at 110000, which also aligns with the upper boundary of the seller zone (110000 - 110700 points). This area has already proven its strength multiple times, causing sharp rejections in the past. Moreover, the price has tested it again recently and failed to break through. In addition, we can see a triangle structure, which fits the logic of a pennant pattern after a bullish wave. However, the latest move upward has already lost momentum near the apex, and the price is now trading just under the upper edge of this formation. That makes this zone technically overloaded and vulnerable to a downside reversal. Based on this, I expect Bitcoin to test the resistance level one more time and then roll back down toward TP 1 at 106000 points, a zone near previous liquidity accumulation and a local consolidation range. If selling pressure increases, the price might aim for the buyer zone (103800 - 103100). Given the current rejection at resistance, the structure of the triangle, and the reaction inside the seller zone, I remain bearish and expect further decline toward the support. Please share this idea with your friends and click Boost 🚀
Disclaimer: As part of ThinkMarkets’ Influencer Program, I am sponsored to share and publish their charts in my analysis.
BUYTrend Line Break
Previous Day low breached
Previous week bullish
Divergence
US session
@ Trade Manage Smile
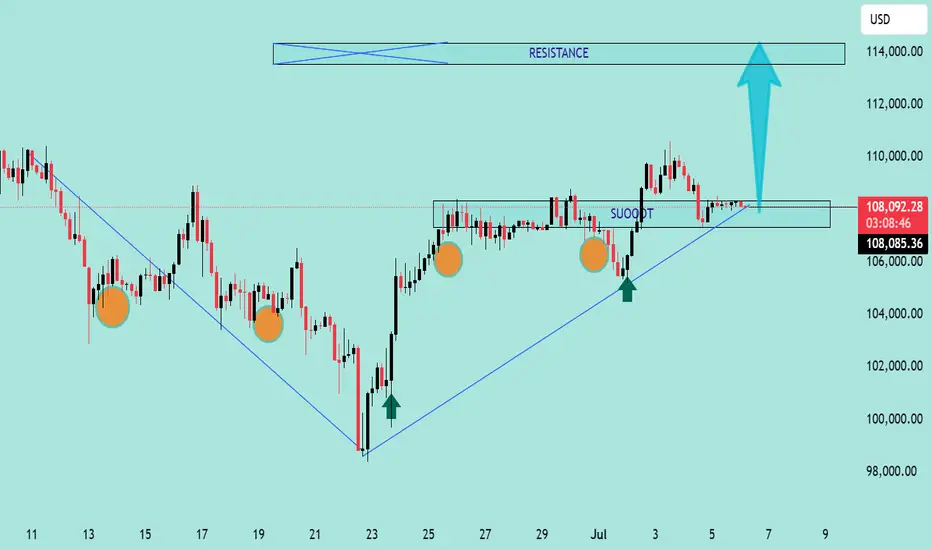
BTC/USD Bullish Reversal Breakout Pattern BTC/USD Bullish Reversal Breakout Pattern 🚀
Technical Analysis:
🔹 Trend Reversal: The chart shows a clear inverse head and shoulders pattern highlighted with orange circles — a strong bullish reversal signal after a downtrend.
🔹 Breakout Zone: The neckline resistance around 108,000 USD has turned into support (marked as “SU00QT” due to a typo, assumed to be “SUPPORT”). Price action is consolidating just above this zone.
🔹 Trendline Support: The upward blue trendline confirms bullish structure, with price forming higher lows. Recent price action is bouncing off this trendline, showing strength.
🔹 Bullish Confirmation: Green arrows indicate strong bullish rejections from key levels, aligning with breakout retests.
🔹 Target Projection: The measured move from the inverse head and shoulders pattern projects a target towards the 114,000 USD resistance zone 📦 highlighted above, suggesting a potential 5-6% upside move 📊.
Conclusion: As long as price holds above the 108,000 support zone and the ascending trendline, BTC/USD remains bullish with potential continuation towards 114,000 USD. A breakout above minor consolidation could trigger a strong bullish rally 💥.
🛑 Invalidation: A sustained break below 106,000 USD would invalidate the bullish structure and may lead to further downside.
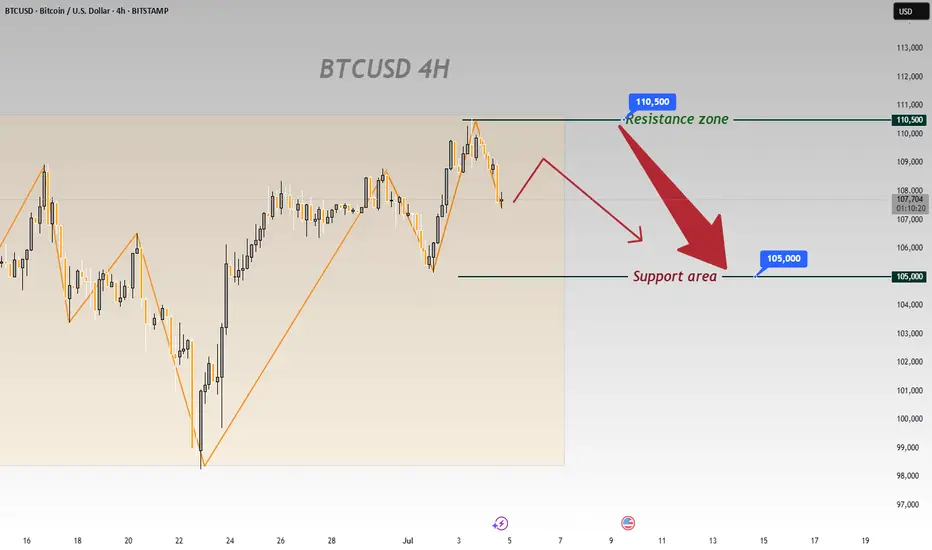
On BTCUSD’s 4 - hour chart, downside risks prevailOn BTCUSD’s 4 - hour chart, downside risks prevail:
Resistance Holds
Price failed to break 110,500, showing strong selling pressure that caps bulls 🚫. A pullback is likely.
Downtrend Signals
Post - resistance, price is retracing. Candlesticks and chart arrows point to a drop toward 105,000 support, fueled by building bearish momentum ⬇️.
Support Test Looms
105,000 is the next key level 🔑. Even if support slows the fall, the setup favors downside—bullish reversals seem unlikely after resistance failure.
Trend Weakness
Orange trendlines show the prior uptrend is fragile 🧊. Failing at 110,500 signals fading bullish force, setting up for a bearish correction.
In short, the 4 - hour chart is bearish. Watch for drops to 105,000; 110,500 will likely block bulls 🛑. Trade cautiously with this bias.
🚀 Sell@108500 - 107500
🚀 TP 106500 - 105500
Accurate signals are updated every day 📈 If you encounter any problems during trading, these signals can serve as your reliable guide 🧭 Feel free to refer to them! I sincerely hope they'll be of great help to you 🌟 👇
BTCUSD| Bitcoin’s Historic Parabolic Pattern🔥 Parabolic Pattern | Institutional COINBASE:BTCUSD Demand Mirrors Gold ETF Era 🔥
COINBASE:BTCUSD vs SP:SPX vs TVC:GOLD
The market is whispering something big — and it's not retail noise this time. For the third straight quarter, listed corporations have outpaced ETFs in Bitcoin purchases, a seismic shift that echoes one key moment in history: the launch of the Gold ETF. Companies like NASDAQ:MSTR contiune to buy and others are following. Will NASDAQ:AAPL NASDAQ:META and NASDAQ:GOOG be next ? Let me know in the comments who you think will be next to buy?
Back then, companies rushed to gold as a hedge against inflation and a store of value as fiat cracks widened. Fast forward to now — we're seeing the same institutional footprints in Bitcoin. The buy-the-dip narrative isn't just alive — it's being driven by corporate balance sheets.
Rumors are circulating that the U.S. government plans to buy 1 million BTC — a move that would shake the global financial system to its core. If true, this isn’t just bullish — it’s historic. The last time governments got this aggressive with a hard asset was during the Gold Reserve buildup. Bitcoin isn’t just digital gold anymore — it’s becoming sovereign-level collateral. 📈💥
💬 Drop your thoughts below. Is this the beginning of the next parabolic era?
In this episode, we break down the parabolic pattern forming on the chart, why it may signal the next explosive leg up, and how history is repeating with BTC playing the role of digital gold.
📊 Technical breakdown. On-chain behavior. Smart money moves.
Don’t blink. Parabolas end in fireworks.
I've been trading for 17 years
👍 If you found this useful, drop a like.
💬 Got questions or thoughts? Leave a comment below — I always respond and happy to help.
👍
Best Regards
MartyBoots
