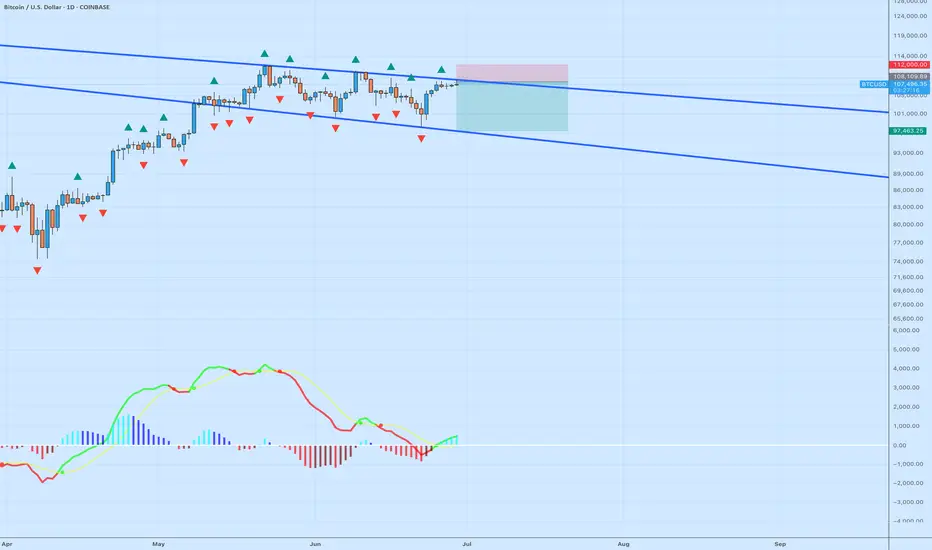
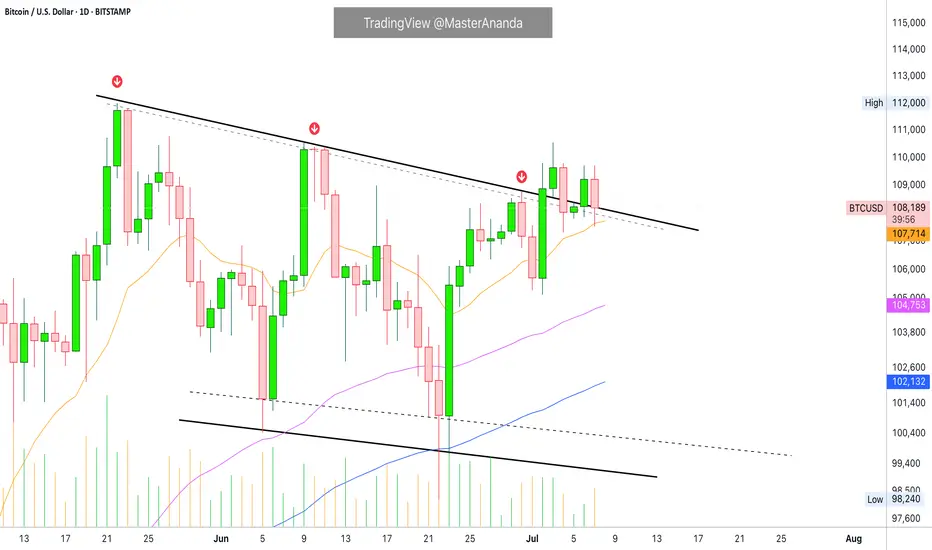
$BTCUSD Trade Setup – Rejection at Channel Highs or BreakoutBitcoin is approaching a key decision point at the top of its descending channel. After bouncing off $100K support and reclaiming the midline, price is now pressing against the upper trendline near $112K. The MACD has just flipped bullish, and momentum is turning upward. However, BTC has repeatedly failed at this level over the last two months, forming a clear resistance zone.
This trade is structured as a short from resistance with tight invalidation above $112K. The setup offers a favorable risk/reward if this rejection holds and BTC pulls back to the $97K–$98K zone.
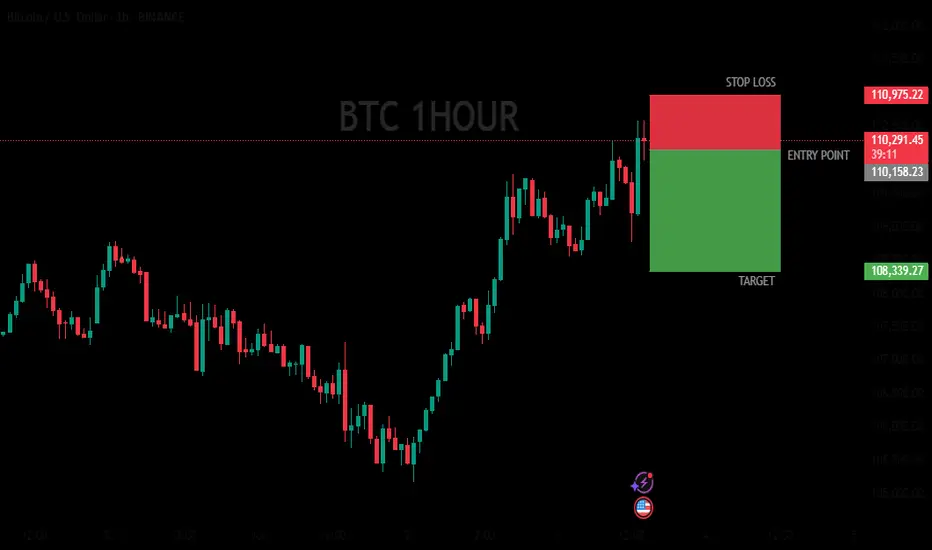
Entry: ~$108K
Stop: ~$112K (channel breakout)
Target: ~$97.5K (lower channel support)
If BTC breaks and holds above $112K, that would invalidate the short thesis and likely flip the structure toward a full breakout scenario.
BITCOIN trade ideas
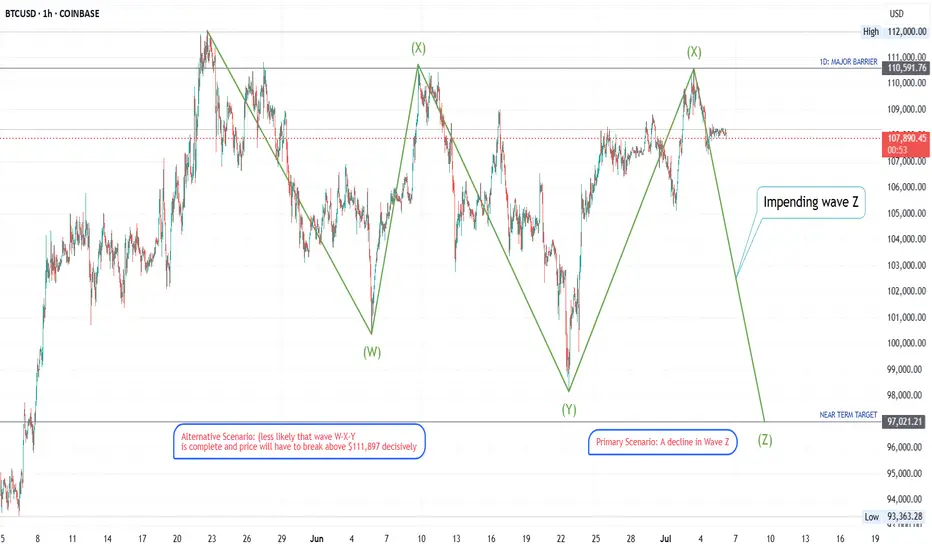
Wave Pattern: Complex Correction (Triple Three) on BITCOINThe price action on this BTC chart displays the characteristics of an overlapping, sideways, and downward-drifting nature of the price swings strongly indicates a complex corrective pattern. The most fitting pattern is a Triple Three, denoted as W-X-Y-X-Z. This is an extended consolidation pattern composed of three simpler corrections (W, Y, and Z) linked by two intervening waves (X).
Most Probable Next Moves
Based on the identification of the market being at the end of a second Wave X, the following are the most probable scenarios:
Primary Scenario: A Decline in Wave Z
The highest probability path is a decline in Wave Z.
Immediate Move: The price is expected to turn down from the current resistance area (the peak of the second Wave X, roughly $110,600).
Structure of the Move: Wave Z will itself be a corrective pattern, most likely another zig-zag (structured as A-B-C down).
Price Target: A common characteristic of a Triple Three is that Wave Z will often push to a new low for the entire structure. The chart's pre-marked "NEAR TERM TARGET" at $97,021 is a logical objective. This would involve breaking below the previous Wave Y low of $98,225.
Alternative Scenario (Less Likely)
A less probable scenario is that the entire W-X-Y correction completed at the June 23rd low. In this case, the rally since then would be the beginning of a new impulsive uptrend (Wave 1). This is considered less likely because the rally from late June to early July appears corrective and lacks the powerful, non-overlapping structure typical of a new impulse wave. For this scenario to gain credibility, the price would need to decisively break above the major barrier at $111,897.
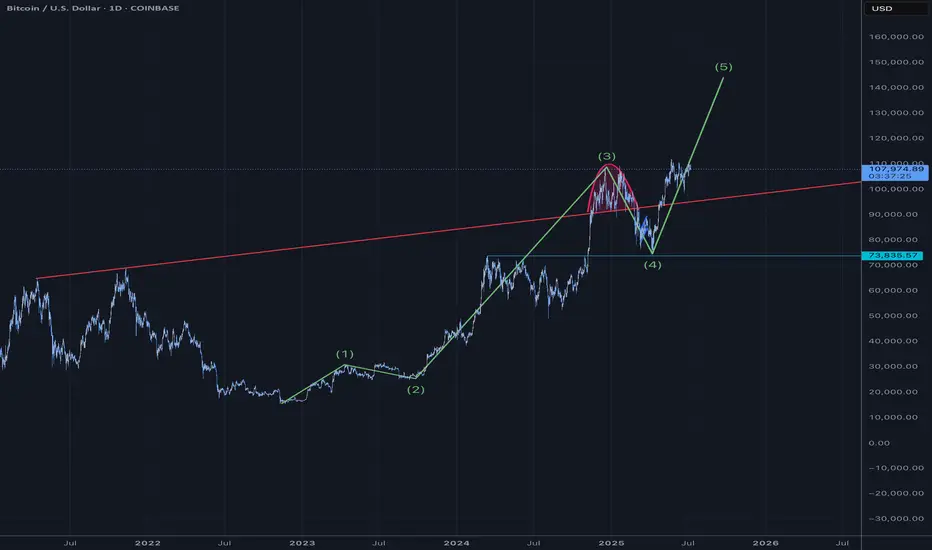
Bitcoin Elliot Wave CountBullish for the next 90 days
Blow off top thesis
Pump into rate cuts and Big Beautiful Bill.
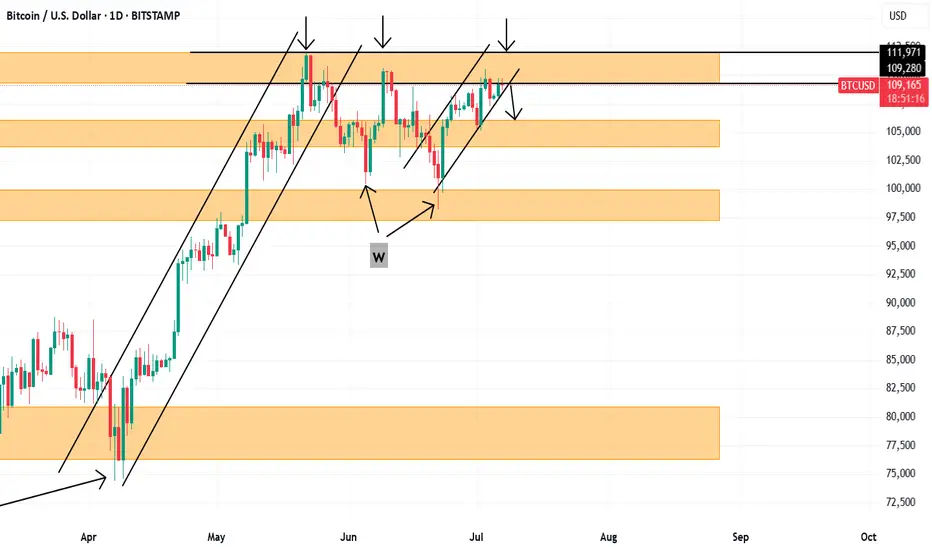
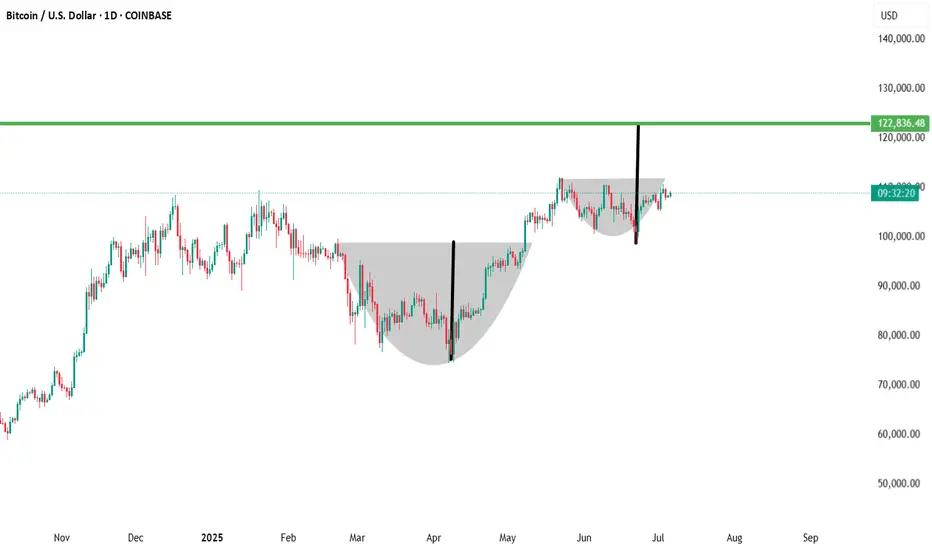
Bitcoin Movement UncertaintyThere have been powerful formations/patterns that one can always depend on when it comes to bitcoin. W formations,M formations and even triple top formations.
Current price has a W formation that is coming to a conclusion and has printed a triple top.
If you zoom in at 109160 you will see a small M formation more visible in smaller time frames and gives the hint of a short term SELL to 105446.
Alternatively, it can trade people into taking a sell and push upwards to 111971
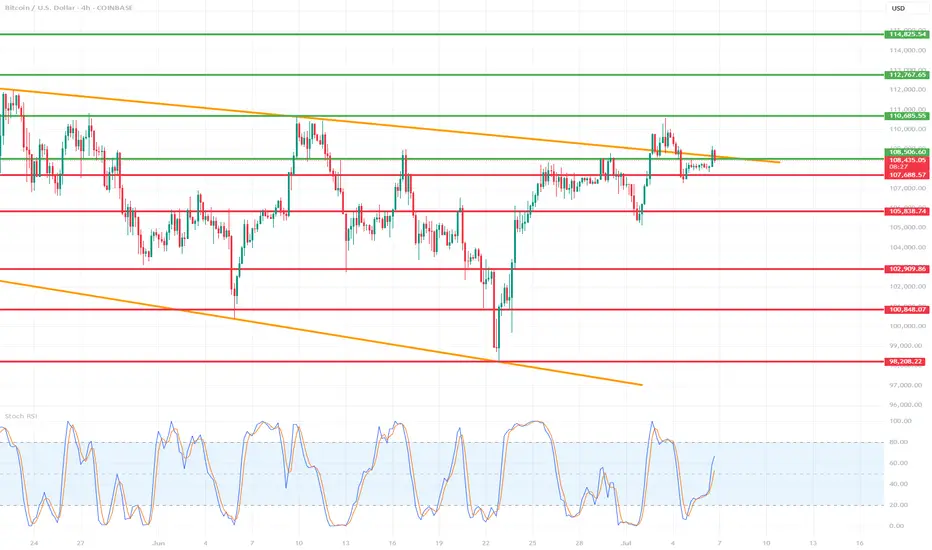
Is BTC getting ready for a new ATH?🔍 1. Key Support and Resistance Levels (Horizontal Lines):
🟢 Resistances (Green Lines):
114,295.54 — strong resistance resulting from previous highs.
112,767.65
111,009.00
110,685.35 — current key level that price may try to retest after a potential breakout.
🔴 Supports (Red Lines):
108,496.55 — current level being tested, also coinciding with local resistance from the past.
107,687.57
105,888.74
102,909.85
100,848.07
98,208.22 — strong long-term support; in the past, this level was reacted with a strong bounce.
🔶 2. Downtrend channel marked with orange lines:
The upper downtrend line acted as resistance.
The lower uptrend line acted as support.
The price recently broke above the upper line, but is now testing it again - this could be a retrospective retest.
➡️ If the close of the H4 candle is above this line - a possible confirmation of the breakout.
📊 3. Stochastic RSI indicator (at the bottom of the chart):
Currently in the uptrend phase after a bounce from the oversold level (<20).
The %K line (blue) is crossed upwards by the %D line (orange) - a bullish signal.
Still below the overbought zone, which suggests that the potential uptrend still has room to develop.
🧠 4. Market structure and price action:
Price broke above the 108.496 level, but is currently struggling to stay above this zone.
A retest of the broken triangle could be a healthy move, provided that support is maintained in the 108k–107.6k area.
A break below and a close below 107.6k could mean a false breakout and a possible decline towards 105.8k or even 102.9k.
🧭 5. Possible scenarios:
✅ Bullish scenario:
Maintaining the 108.496 level and closing the candle above the upper orange line → continued growth.
The nearest targets are:
110.685 (first resistance),
111.009 and 112.767 next.
❌ Bearish scenario:
The price will not stay above 108k and will fall below 107.687.
Possible return to the previous consolidation range with the target:
105.888,
and then 102.909 or 100.848.
🧮 Summary:
Currently, the decisive moment is underway: a test of support after breaking out of the convergent triangle.
The Stoch RSI indicator gives a bullish signal, but the price must confirm the movement by behaving above 108k.
Retest and bounce - this is a bullish scenario.
A breakdown and return under the trend line - means that the breakout was false.
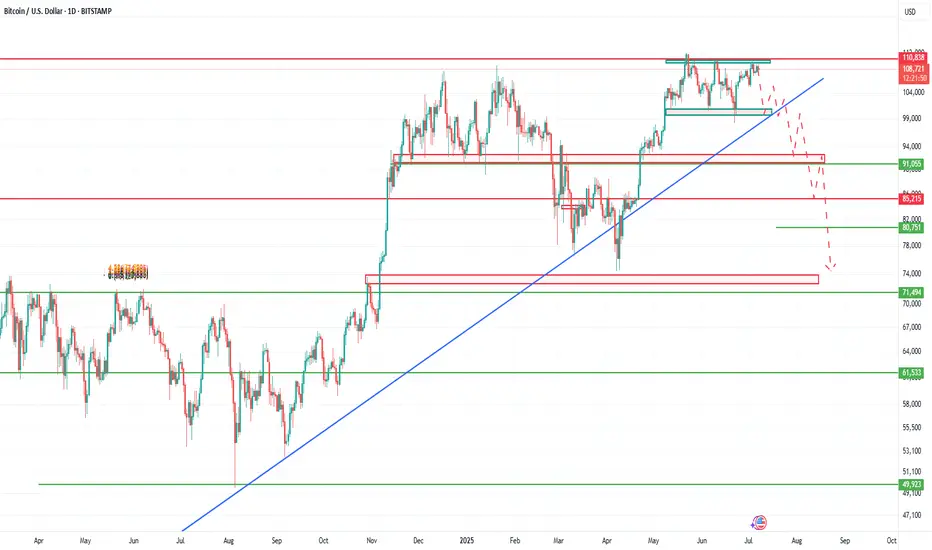
Interesting to see if this channel holds?CRYPTOCAP:BTC channel established from 2018 has held. If this channel holds, we are near if not at tops already and will be moving back down sooner than later.
Has #BTC really decoupled? COINBASE:BTCUSD
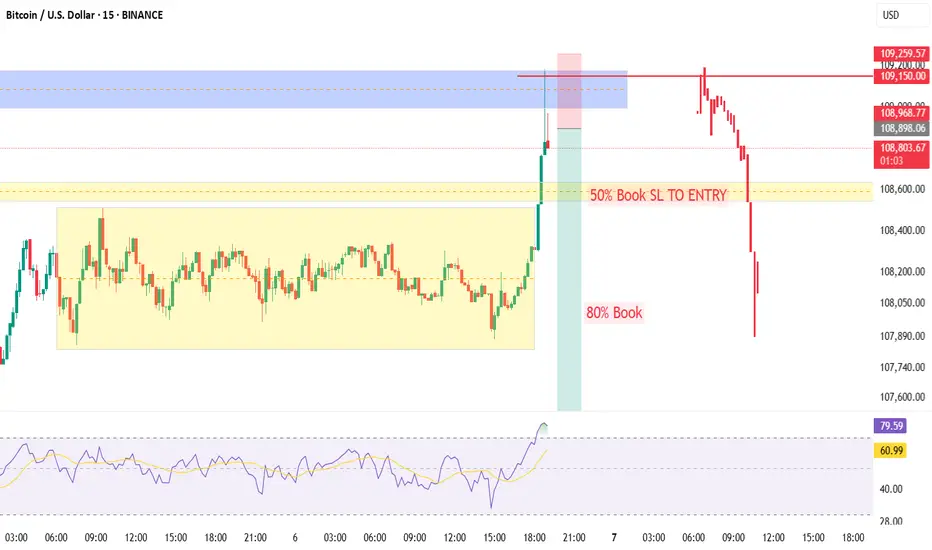
BTCUSD TRADES SIDEWAYS DUE TO A LACK OF DRIVING FACTORS
BTCUSD has been moving within sideways since the end of last week. This week there will be lack of news. The first significant will be FOMC minutes tomorrow, which will definitely affect the DXY index and bitcoin. So before that time I expect that the sideways dynamic of the asset will remain.
So, nothing to trade? Not really
We may consider entering long positions at a current price with a take profit nearby 0.786 Fibo and a stop loss just below the previous low:
🔼 a market buy order at 108078.50 with
❌a stop loss at 107389.50 and
🤑a take profit at 109176.65
After that I expect the price to rebound from the upper border of the triangle. Maybe will consider another long entry.
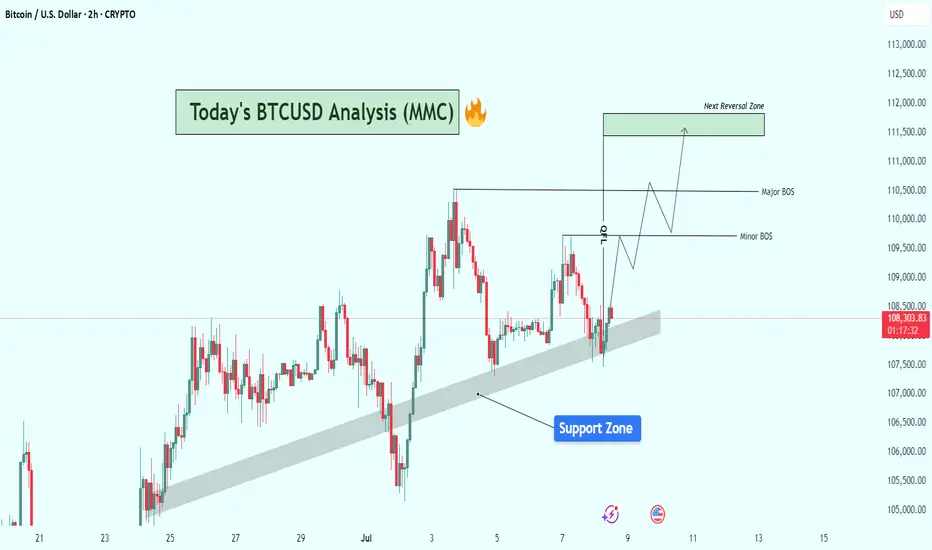
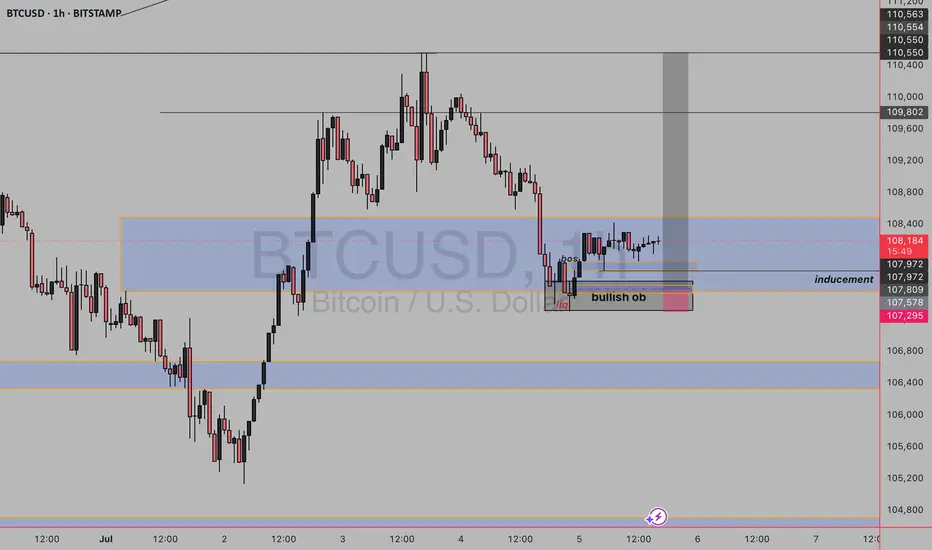
BTCUSD Structure Analysis : Bullish Zone From Support + Target🔍 Current Market Structure Overview:
Bitcoin is currently trading around $108,375, hovering just above a clearly respected rising support zone (shaded area). This dynamic support has held price multiple times and continues to act as a springboard for short-term bullish moves.
The chart illustrates a classic bullish continuation setup forming, with key structural levels marked as Minor BOS (Break of Structure) and Major BOS, indicating potential areas of trend validation and momentum acceleration.
🔹 Key Technical Elements:
✅ Support Zone:
The shaded diagonal support zone has acted as a bullish trendline base, holding up since late June.
BTC recently dipped into this area, found buyers, and is now attempting a reversal from this level.
This reinforces market interest and confirms the accumulation behavior in this zone.
⚠️ Break of Structure (BOS) Levels:
Minor BOS is marked near $109,800, signaling the first key intraday resistance.
A break above this level would signal bullish intent and open the way for price expansion.
Major BOS around $110,600–$110,800 is critical. A clean break here will likely validate a trend continuation toward the next objective.
🟩 Next Reversal Zone (Target Area):
Highlighted around $111,500–$112,000, this green zone represents a potential liquidity grab/reversal area where sellers could re-enter.
This zone aligns with previous price exhaustion levels and may trigger consolidation or a short-term pullback.
📈 Projected Price Path (Wave Schematic):
The chart outlines a wave structure projection, suggesting:
A possible retest of the minor BOS.
Follow-through into the major BOS area.
Final push into the reversal zone before potential rejection or sideways action.
🔧 Bias & Strategy:
Bias: Moderately Bullish as long as BTC respects the support zone.
Invalidation: A decisive breakdown below the trendline support and close under $107,500 would invalidate this bullish setup and shift bias to neutral/bearish short-term.
Trading Plan Ideas:
📥 Buy Opportunity: On minor dips within the support zone, targeting BOS levels.
📤 Sell Watch: Near reversal zone ($111.5K–$112K) if signs of exhaustion or bearish divergence appear.
📌 Final Notes:
BTC appears to be gearing up for a breakout from consolidation, and price action is coiling with higher lows. Market participants should watch closely how BTC reacts at the minor and major BOS zones, as they could define the next leg for either bullish continuation or rejection.
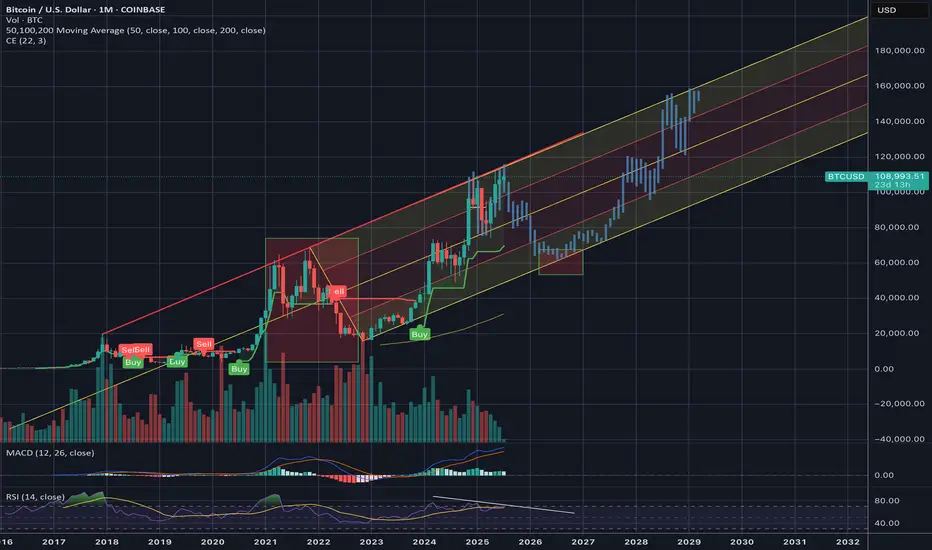
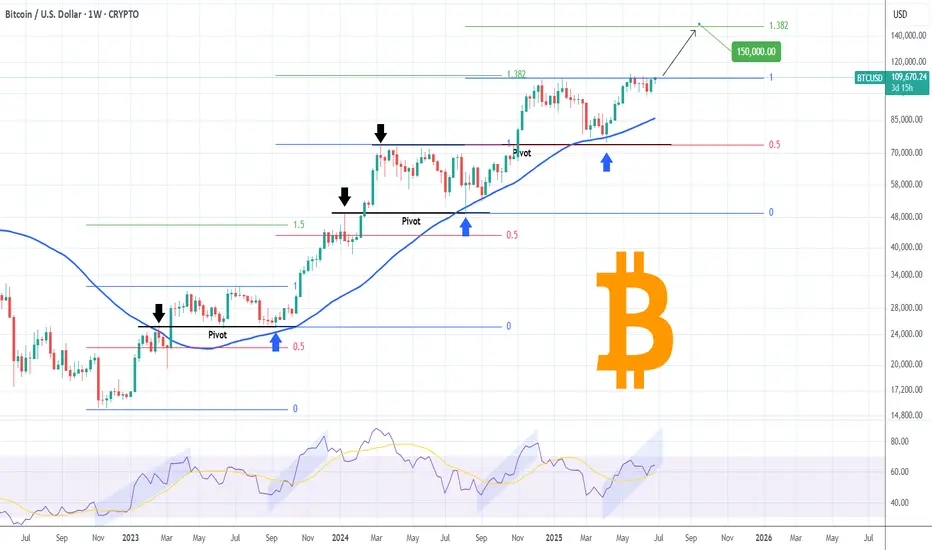
BITCOIN now starts ascent to $150k.Bitcoin (BTCUSD) closed last week with a strong green 1W candle, recovering all loses and has started the current one with a stable rise. As stable as the whole Bull Cycle has been so far since the November 2022 market bottom.
The current uptrend is the technical Bullish Leg that has always emerged the Triple Support Combo of the 1W MA50 (blue trend-line), 0.5 Fibonacci retracement level and former Resistance, turned Support (Pivot).
As you can see, this has happened 2 times already and this is the 3rd. The previous one peaked a little above the 1.382 Fibonacci extension, which gives us an immediate Target on a 2-month horizon at $150000. This confirms a number of previous studies we conducted, all leading towards this price or around it.
So do you think all roads lead to $150k? Feel free to let us know in the comments section below!
-------------------------------------------------------------------------------
** Please LIKE 👍, FOLLOW ✅, SHARE 🙌 and COMMENT ✍ if you enjoy this idea! Also share your ideas and charts in the comments section below! This is best way to keep it relevant, support us, keep the content here free and allow the idea to reach as many people as possible. **
-------------------------------------------------------------------------------
💸💸💸💸💸💸
👇 👇 👇 👇 👇 👇
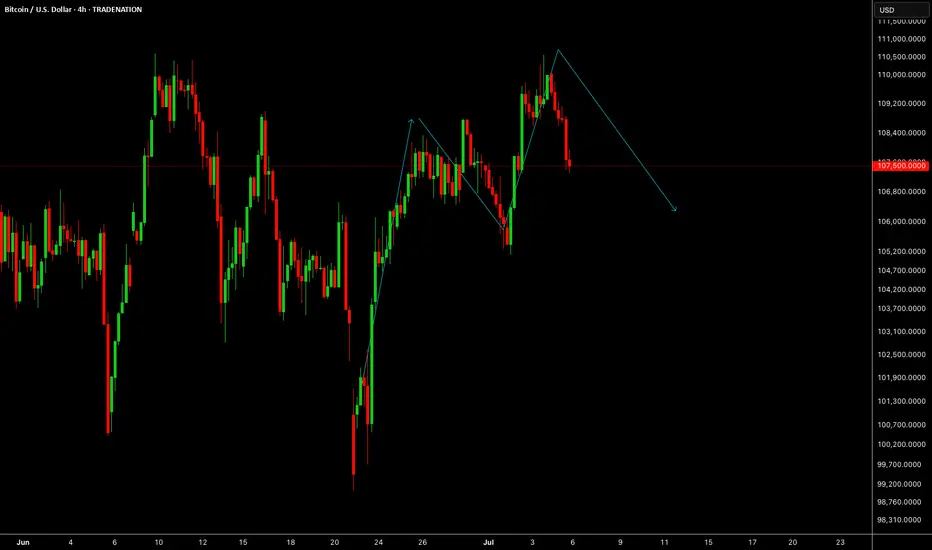
BTCBTC has done exactly what we expected, wait for the drop now before you look for further buys.
Disclosure: We are part of Trade Nation's Influencer program and receive a monthly fee for using their TradingView charts in our analysis.
Bitcoin Daily, Mixed Situation · Bitcoin vs Altcoins · Not MixedI came with the intention of doing an update on the weekly timeframe, the chart doesn't look great.
Here we are looking at Bitcoin daily and once more the situation is mixed to say the least. It is hard to predict with exactitude with such a chart. In this case, we have to look for clues in other places. The altcoins.
But before we go there let's consider a few of the actualities that are present on the Bitcoin chart.
Bitcoin price action
Mixed or not mixed, the action continues to happen at resistance against all odds; this is bullish.
Bitcoin is trading safely above $106-$107,000 daily, and this is also bullish.
Bitcoin is trading above all moving averages we track and nothing is more bullish than that. MA200 sits around $96,000. EMA55 at $104,700 and EMA13 at $107,700.
Bitcoin will be bullish regardless as long as it trades above these levels and at a such strong price. So the mixed part is only psychological. It is mixed because people are afraid of a drop or want to see it drop. It is bullish based on the actual numbers and the chart.
The altcoins market vs Bitcoin
Some altcoins are breaking up today two to three digits green. Those good old reputable projects. This wouldn't be happening preceding a major bearish wave. Such strong action on the altcoins tends to precede a major bull market. Last week there were other pairs breaking really strong, the previous week another group, this week a new group and so on. Slowly but surely the low prices are disappearing but this isn't still a marketwide occurrence, we can see/say that the market is in no hurry.
Another relationship between Bitcoin and the altcoins relates to how many are behaving; when Bitcoin is about to crash, the altcoins tend to crash really strong and fast. The altcoins don't wait and just go down and continue diving deep if Bitcoin is about to produce a major crash. But this isn't the case, many altcoins are already at bottom prices but not based on a crash but a very slow and drawn out retrace. From these lows they are recovering strong.
When Bitcoin is bullish, sideways with a strong price within a bull market, the altcoins tend to grow. It is the same signal looked at from a different perspective. These altcoins are telling us that behind the scenes Bitcoin is bullish and we know Bitcoin is bullish because it is trading above $107,000. A bullish continuation is the next logical step.
Thank you for reading.
Boost if you agree.
Namaste.
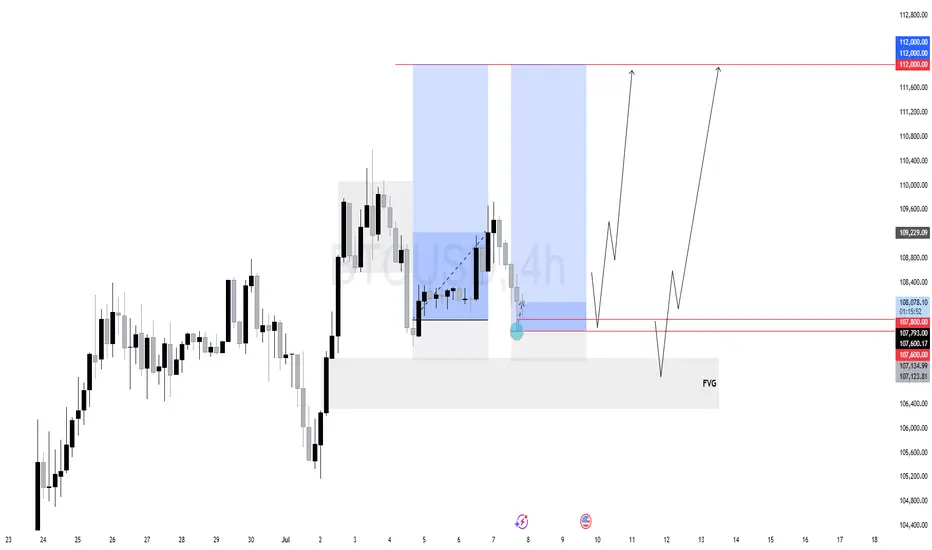
$BTC (BITCOIN) 4HPrice previously rallied strongly from a Fair Value Gap (FVG) at the bottom of the chart, forming a bullish market structure.
After a bullish displacement, BTC consolidated in a tight range (reaccumulation) and swept internal liquidity before breaking down.
Now, price has returned to a critical discount zone around 107800–107600
First Target: 109,229 — internal range high.
Main Objective: 112,000 — resting external liquidity above a clean high.
As long as BTC holds above 107600, we remain bullish. The current area is perfect for accumulation before a potential expansion phase toward external liquidity.
BITCOIN ANALYSIS - What's Next for for BTC?🎯 KEY LEVELS DECODED
🛡️ FORTRESS SUPPORT: $102,800 - $103,200
_____________________________
NEUTRAL STRATEGY:
Buy Zone: $102,800 - $102,600
Sell Zone: $110,000 - $112,000
Stop Loss: $100,500 (range breakdown)
Target: Opposite end of range
Position Size: 3-5% of portfolio
_____________________________
🎢 SCENARIO : (Probability: 35%)
If BTC consolidates between $102K-$108K :
Range-bound trading for 2-3 weeks
Accumulation phase before next major move
Key levels: Buy $102K, Sell $110K
_________________________
🛡️ RISK MANAGEMENT 🚨 DISCLAIMER 🛡️ DYOR
BULLISH BITCOINAs we can see we are currently on an uptrend on higher timeframe and price is in daily fvg and has mitigated the bullish order block on daily tf on lower timeframe we have seen liquidity sweep and break of structure and clear inducement provided so we wait for price to tap the ltf orderblock and buy
BTC 1 HOUR BEARISH ANALYSISbitcon market may be go for sell side. the also has lines and lable to help traders anderstand the market.
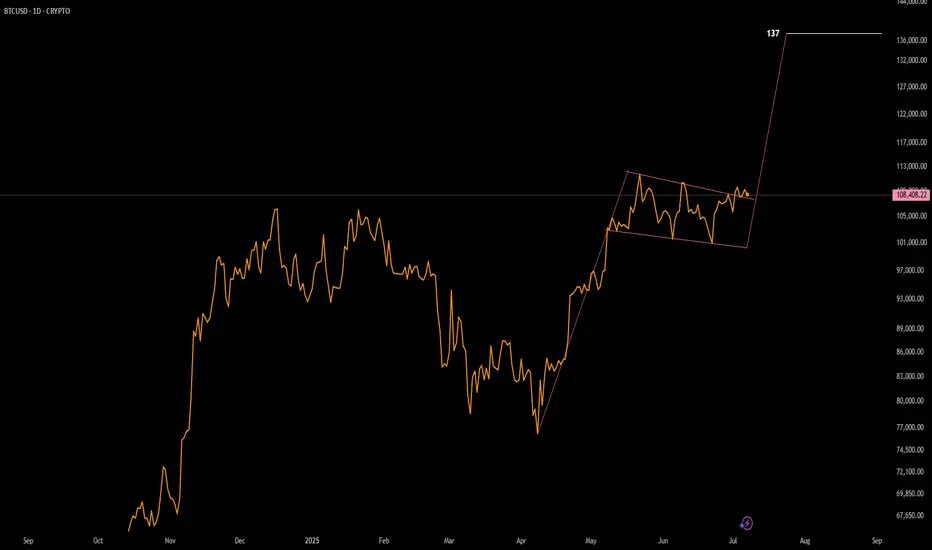
Bull Flag TargetBased on the flag pole height BTC has a current target of 137. This is be so much fun!
BTC is ready to plungebtc has form a compression and its ready for the major correction.
becareful in trading btc.
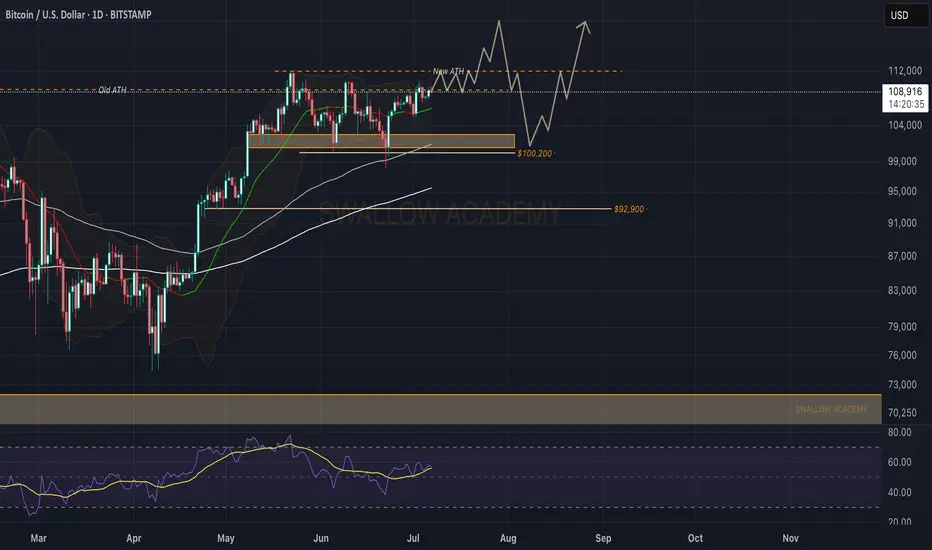
Bitcoin (BTC): Buyers Showing Pressure, Breakout Incoming?Bitcoin is hovering near the local ATH area for the third time already since the first touch, which happened in the middle of May.
As we are approaching this area again, we are looking for a potential breakout to happen from here, which would give us an opportunity for a long position until $120K, so what we are looking for is full dominance from buyers at the current region.
Buyers have to take control and secure that zone!
Swallow Academy
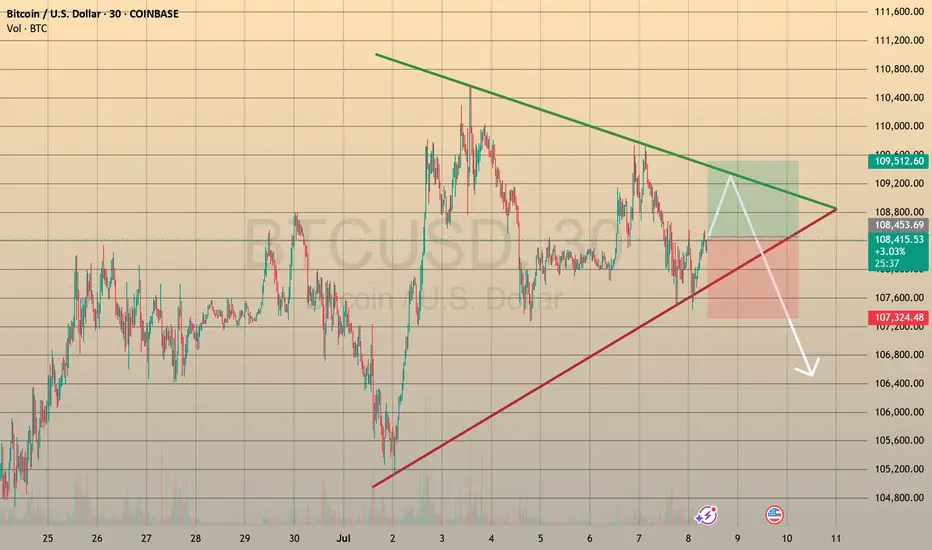
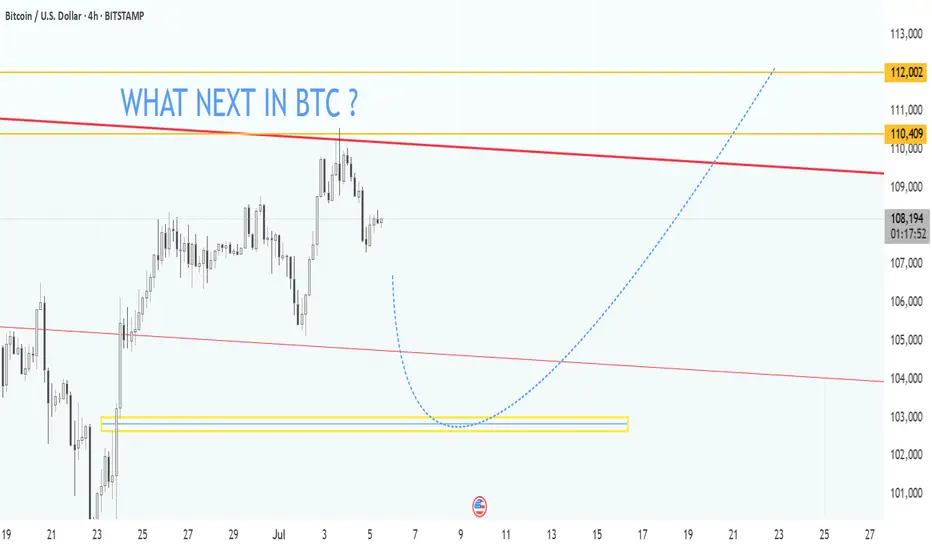
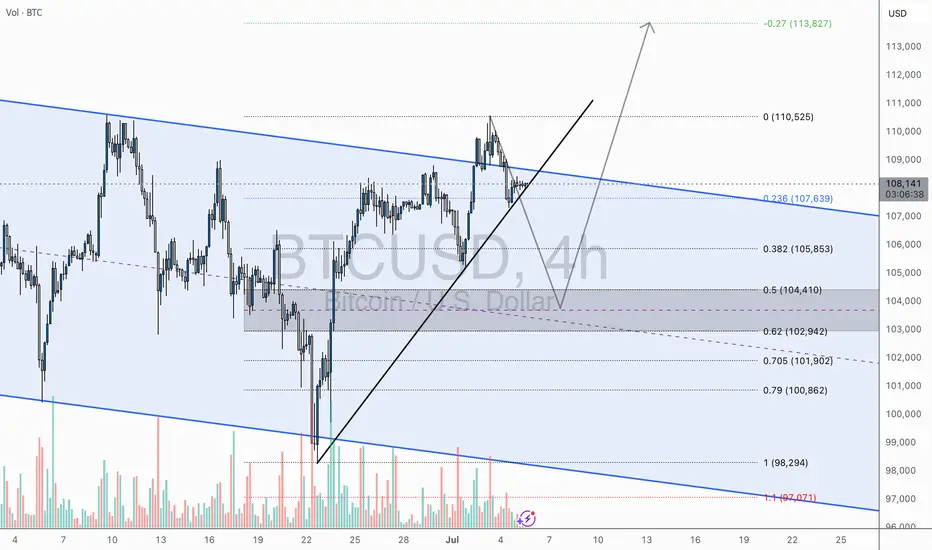
BTC/USD – Pullback Before Moonshot?4H Outlook by WrightWayInvestments
Bitcoin just delivered a textbook breakout from the descending channel and is currently consolidating above the breakout trendline. This is a critical zone where market participants are deciding between continuation or a retest.
🧠 Technical Breakdown:
🔹 Breakout Confirmation – Clean bullish breakout above channel resistance
🔹 Ascending Trendline Support – Currently being tested
🔹 Fibonacci Reload Zone – Between 0.382–0.618 (🟦 $105,853–$102,942)
🔹 Bullish Scenario – Potential higher low before aiming for major fib extension
🔹 Target Zones:
• TP1: $110,525
• TP2: $113,827
🧭 Game Plan:
A retracement into the fib support zone ($104K–$102.9K) offers the highest RR for long entries, ideally on bullish candlestick confirmation + volume spike. A break and close above $108.5K could negate pullback expectations and signal direct continuation.
🔔 Final Note:
Volume expansion on breakout + controlled retrace = power setup.
Let the market come to you — high-probability zones don’t chase.
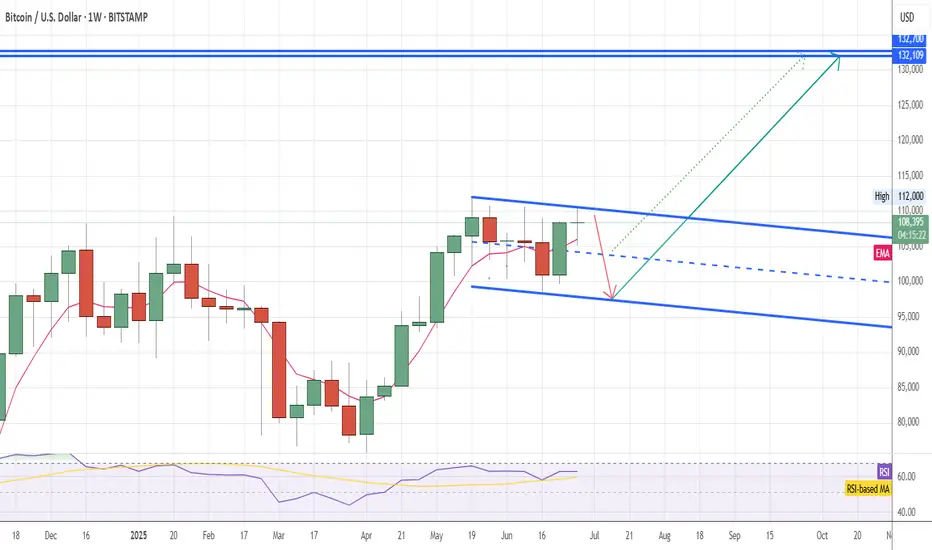
BTC waiting for channel breakBTC is compressing in a falling channel: in my view in the short term it could retrace at least to the channel mid line (around 104k) maybe to the channel lower trendline (around 97,5 - 97,8k).
Once the channel will be broken BTC will reach final bullish cycle target in the range
(132,109k - 132.700k) , then bearish cycle will start in autumn
$BTC Elliot Wave Analysis - Weekend Update 7/9Hello fellow degenerates,
As we get ready for this new trading week, I am presenting to yall the 3 scenarios that I am looking for on Bitcoin.
- For scenario 1, we need a break above 110.4k to target the 126k-122k range.
- For scenario 2, we still need to complete our Wave 2, by retracing towards 103k. After that, we should see a reversal targeting 128k -123k
- The last scenario is based on the idea that we're failing to breakout from the parallel channel we currently have. We could see price traveling towards 98k - 90k range if we have a strong rejection of 110k and a break of our support levels.
- Levels to watch: 110.4k, 106.6k, 103.4k