Is Bitcoin Still a Hedge? What the Iran Israel Conflict RevealsAs geopolitical tension between Iran and Israel escalates, markets are once again gripped by fear. Oil prices have surged, gold has rallied, and investors are rebalancing portfolios in anticipation of further instability. Amidst this backdrop, Bitcoin's behavior is raising fresh questions about its role as a geopolitical hedge.
Bitcoin’s Initial Reaction: A Spike and a Slip
When the first reports of conflict broke, Bitcoin spiked alongside gold. Many hailed this as proof that BTC was becoming a reliable safe haven. However, just days later, prices retraced by roughly 6 to 7 percent as volatility intensified.
As usual, Bitcoin is still highly sentiment driven. While gold held its gains, BTC mirrored risk on assets with intraday volatility, undermining its hedge narrative.
BTC vs. Traditional Safe Havens
Let’s compare Bitcoin’s performance to:
• Gold: Continued upward trend, record ETF inflows
• Oil: Strong rally due to supply shock fears
• USD: Moderate gains as a traditional reserve asset
Bitcoin’s pullback during peak uncertainty suggests that in times of extreme stress, traditional assets still dominate flight to safety behavior.
What the On Chain Data Shows
Interestingly, on chain activity also hints at caution. Exchange inflows increased slightly after the conflict news, suggesting profit taking or reduced conviction among holders.
Moreover, stablecoin volume spiked in Middle Eastern regions — a signal that users may prefer capital preservation over speculation during geopolitical risk.
The Takeaway: Not There Yet
Bitcoin is maturing, and its response to global events is evolving. But this conflict reveals it is not yet a full fledged hedge like gold or the dollar.
For investors, the lesson is clear: BTC can act as a partial hedge in medium term macro trends, but during sharp geopolitical escalations, traditional assets still lead.
What Do You Think?
Is Bitcoin still on track to become a true safe haven asset? Or will it remain a risk sensitive speculative instrument?
BITCOIN trade ideas
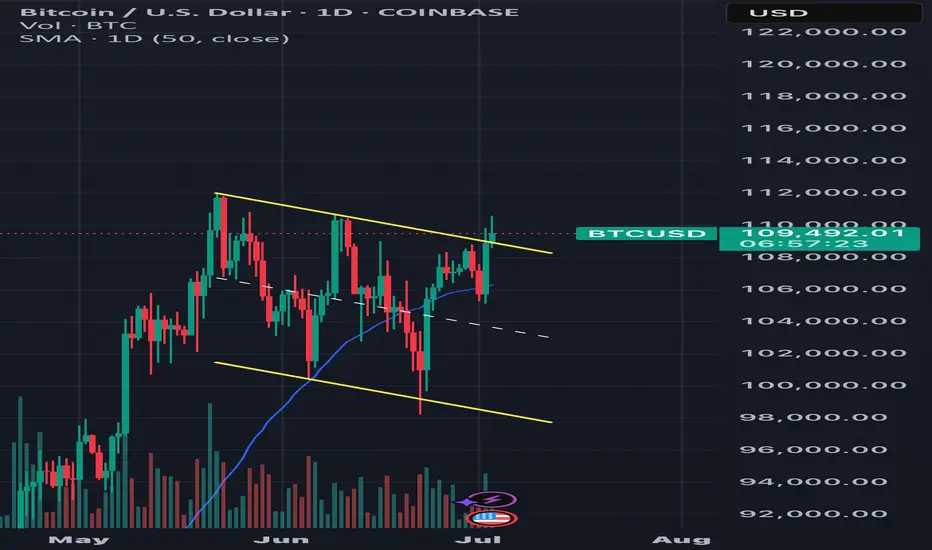
Break-Out Bros vs. Range Followers – will BTC rip?Bitcoin just kissed the channel roof at 109–110 k. Same line has stuffed every rally since April, so 112 k on a daily close is the whole story: print it and we leave the dungeon.
Under the hood the bulls finally have ammo – price back above the 50-day, bands squeezed, volume upticking, RSI mid-50s. Enough spark to torch shorts if resistance snaps.
Range Followers aren’t sweating. Their cash machine is simple: dump 110 k, scoop 100 k. Holiday liquidity = fake-out heaven. Slip under 105 k and gravity drags us straight to that comfy demand couch.
So it’s binary: close over 112 k, momentum fires toward 118 k; fail, and we ping-pong in the box again. Pick a side, slap on a stop, and remember: Bitcoin’s favourite sport is humiliating whichever crowd screams loudest.
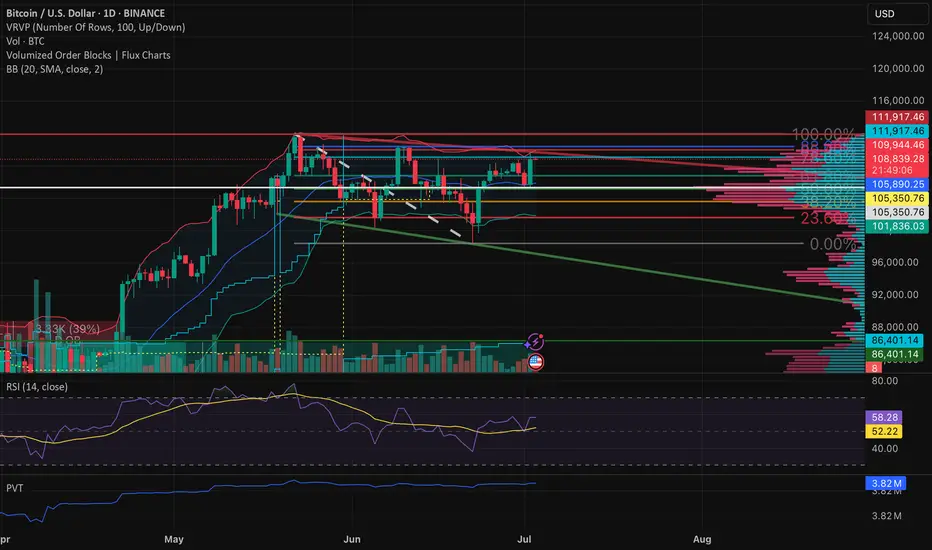
BTC – Holding or Rolling?BTC has pushed up from the late June low and is now testing the 78.6% Fibonacci retracement zone from the prior downswing. Price is currently sitting around 109.5K–110K, directly in a high-confluence rejection area. This level aligns with the top of the recent range, 78.6% retracement, Bollinger Band resistance, and the zone where the last breakdown began.
While the move resembles a double bottom or W-pattern on first glance, structure invalidates the bullish case:
The second low was lower than the first, breaking symmetry.
The second high is still lower than the June high near 111.9K.
RSI made a lower high while price made a higher high — classic momentum divergence.
Volume has not increased meaningfully on the bounce, suggesting a lack of strong buyer commitment.
Until BTC reclaims and holds above 111.9K on strong volume, this looks like a lower high inside a broader downtrend.
Short Setup Thesis
Entry Zone:
109.5K–110.5K (zone of rejection, aligned with 78.6% Fib and prior supply)
Stop Loss Zone:
Above 112K–113K (a full reclaim of prior highs would invalidate the setup)
Target Zones:
TP1: 102K–100K (local support range and prior consolidation area)
TP2: 97K–95K (Fibonacci cluster and volume shelf)
TP3: 91K–88K (structure low and potential sweep zone)
Break Trigger / Confirmation:
A daily close below 106K–105K would confirm bearish continuation. Weak retests into this zone would provide additional short entry opportunities.
BTCUSD RISKY 4H SHORTPrice broke out of bearish trendline but formed resistance at $110600. Price printed a bearish engulfing pattern following Positive US jobs data. A potential two tops or double tops formed. A potential reversal to at least $105000.
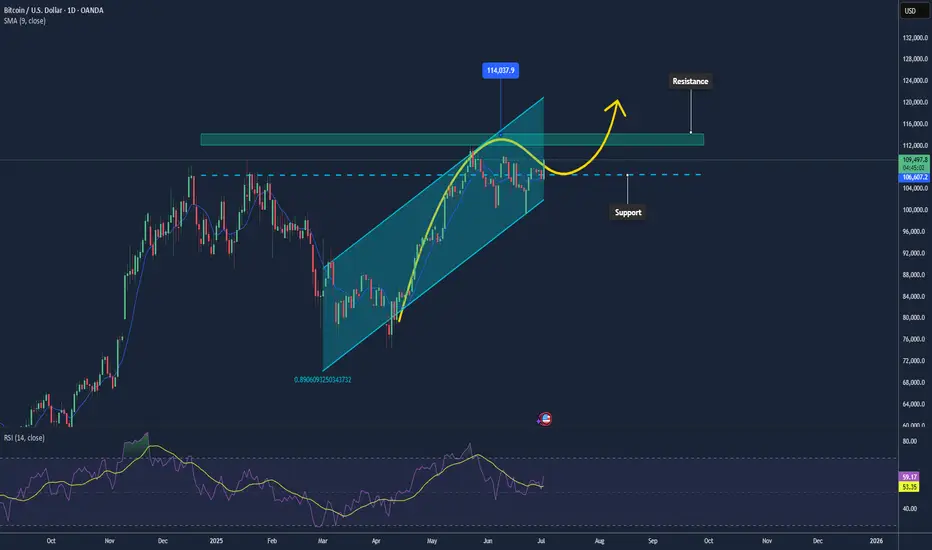
Bitcoin Awaits Breakout Above $114K🪙 Current Price: ~$109,500
📈 Trend: Bullish but facing strong resistance at $114,000
📉 Support: $106,000–$107,000
📌 Outlook: Breakout above $114K could lead to $130K+. Otherwise, possible pullback to $106K.
📊 Key Drivers: ETF inflows, Fed rate cut expectations, weak USD.
💡 Strategy:
🔺 Buy: $107,000 – $107,500 → TP $114,000 | SL $106,000
🔻 Sell (take profit): $114,000 – $115,000 → SL if closes below $112,000
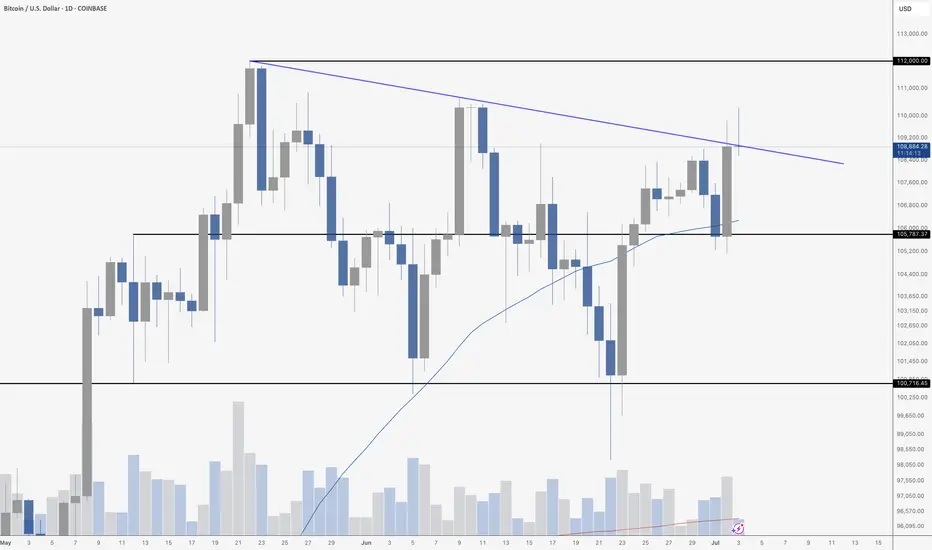
BTC AT RESISTANCEThe jobs report just dropped and was stronger than expected. That means the Fed has less reason to cut. That means less chance of immediate liquidity. Since we live in the upside down, apparently more jobs are bad for markets. And we generally see Bitcoin react first and then quickly go back to trading on its own.
All of that said, this is an interesting spot. Bitcoin broke out yesterday, before closing back below the resistance. The same is happening so far today, with a potentially ugly top candle if the day stays this way. But it is WAY too early to judge.
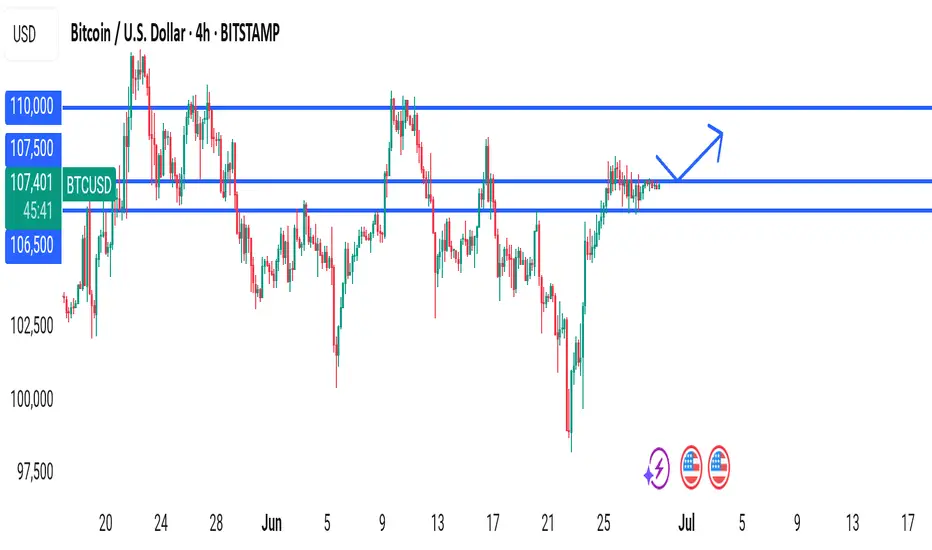
Bitcoin BTCUSD 4H Chart Analysis – Potential Breakout Incoming!Bitcoin is currently consolidating after a strong bullish recovery from the $96,000 zone, holding above $107,000. Price is forming a tight range — a breakout is imminent.
⚡ If BTC breaks above $107,500 with momentum, expect price to target $110,000 and $112,000 short-term.
⚡ If price rejects $107,500 and breaks below $106,500, we could see downside towards $104,000.
⚠️ Watch for volume confirmation before entries. No FOMO.
🚀 Stay ready — breakout traders, your setup is building.
#Bitcoin #BTCUSD #Crypto #TradingView #BTC #Breakout #CryptoTrading
BTCUSD – Rejection or Reload?BTC surged from $105K to above $110K in one of the strongest single-day impulses lately. Price is pausing at resistance near $110,300 with a minor pullback in play. The structure remains intact unless it drops below $108,600. Above $110,300 would unlock next leg higher.
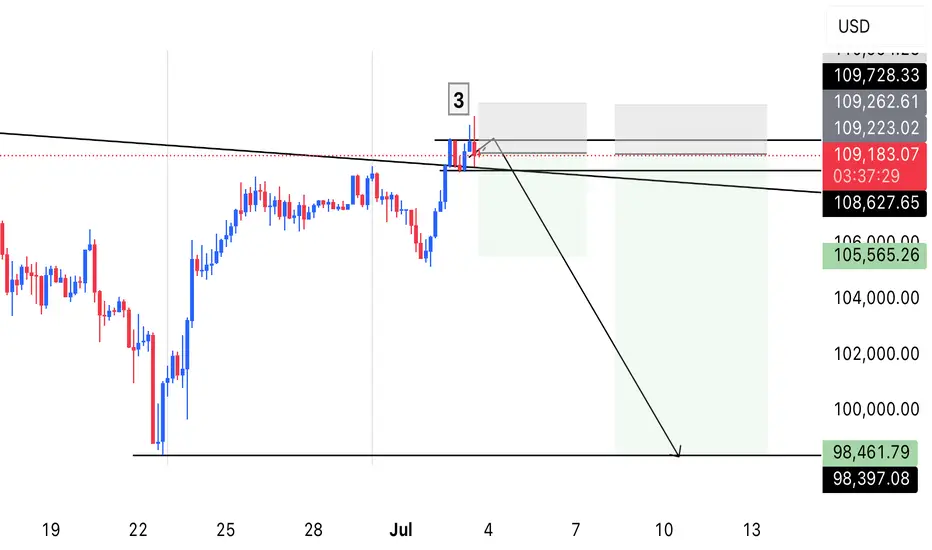
July 1 Bitcoin Bybit chart analysis
Hello
This is Bitcoin Guide.
If you "follow"
You can receive real-time movement paths and comment notifications on major sections.
If my analysis was helpful,
Please click the booster button at the bottom.
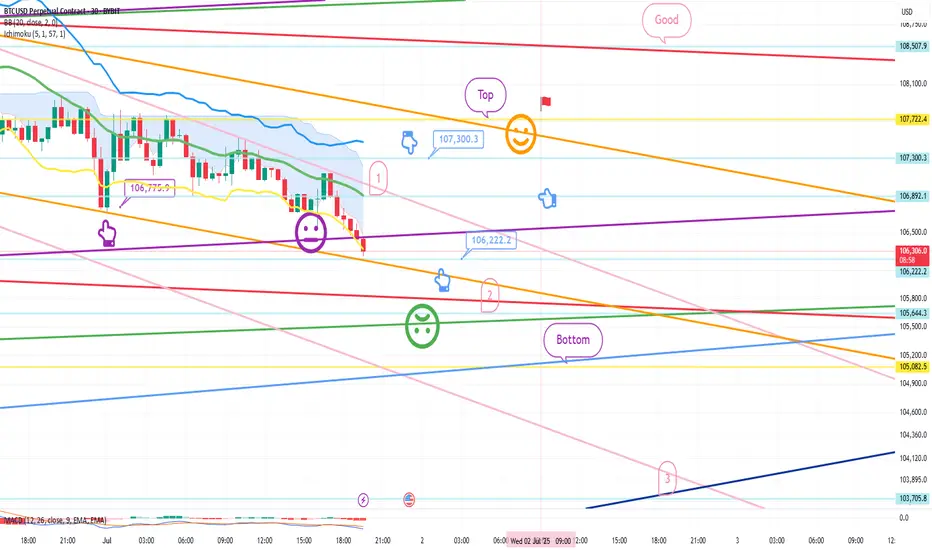
Here is the Bitcoin 30-minute chart.
Shortly later at 10:30 PM and 11:00 PM, there will be a NASDAQ index announcement.
On the left, with a purple finger,
I connected the long position entry point of $106,775.9, which I entered yesterday, to today's strategy.
Since the rebound was not strong yesterday,
the 12-hour chart -> daily chart MACD dead cross is currently under pressure.
Depending on the situation, it can drop strongly to the 3rd section at the bottom,
and since there may be some people who are maintaining long positions yesterday,
I will explain in detail the operating method such as the loss cut price,
so please check it carefully.
*When the blue finger moves,
Bidirectional neutral
Short->Long switching strategy
1. 107,300.3 dollars short position entry section / stop loss price when orange resistance line is broken
2. 106,222.2 dollars long position switching / stop loss price when section 2 is touched
3. Top section long position 1st target -> Good 2nd target
It is important until 9 o'clock when the 12-hour candle is created.
After 9 o'clock, the blue finger 106,222.2 dollars at the bottom
Becomes the main support line
If it comes down from the current position, section 2
The main support line is divided.
In terms of the pattern, it is section 6+12.
If section 2 is touched right away,
There is a high possibility of a strong drop today,
So you should be careful.
- Those who are maintaining a long position
If you touch the 2nd section before 9 PM without touching the short position entry point at the top
You should operate at a loss cut price.
I think it would be good to adjust it according to leverage.
If it falls after touching the 1st section at the top
It becomes a vertical decline condition.
From the bottom, from the 3rd
Maximum Bollinger Band daily chart support line section
Please note that it can be pushed up to 100,685.5 dollars.
I have never changed my perspective suddenly or irresponsibly after leaving an analysis article.
I did my best until the end today.
Please use my analysis article so far only for reference and use
I hope you operate safely with principle trading and loss cut prices.
Thank you.
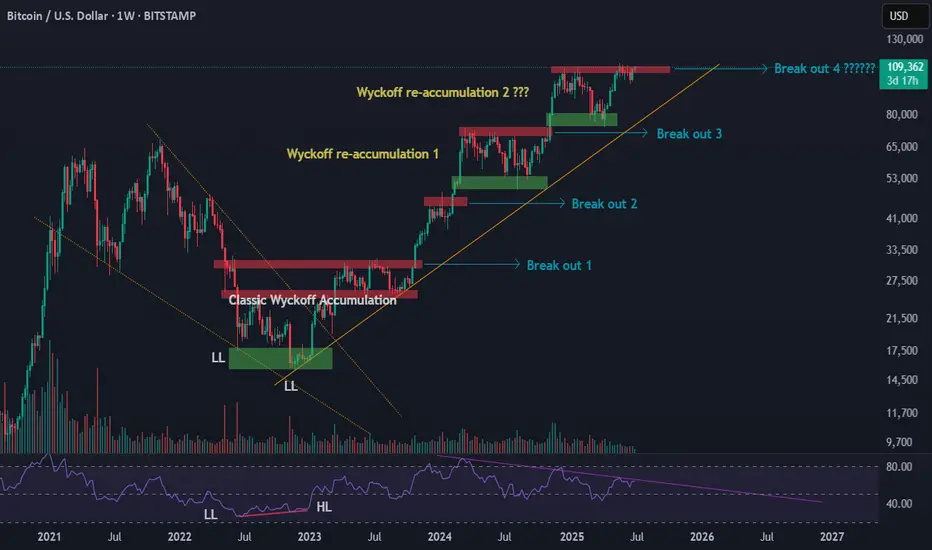
BTC Market Structure (June 22 - June 25): Wyckoff Insights + RSIOver the past few months, I’ve been closely studying Bitcoin’s macro structure from June 2022 to June 2025, and I believe we’re witnessing a textbook example of Wyckoff theory unfolding in real time — not just once, but in multiple phases.
🔍 Phase 1: Classic Wyckoff Accumulation (June 2022 – Oct 2023)
Starting June 2022, BTC began forming a major bottoming structure.
By November 2022, price made a lower low — but RSI (14) was making higher lows, a clear sign of bullish divergence.
From there until October 2023, BTC moved sideways in a Wyckoff accumulation range.
This was Phase A–E in classic Wyckoff terms:
Selling Climax (SC)
Secondary Test (ST)
Spring (false breakdown)
Last Point of Support (LPS)
Sign of Strength (SOS)
🚀 Phase 2: Markup with Re-Accumulations at Each Leg
After the October 2023 breakout, BTC has followed a highly structured rally with multiple consolidation phases and healthy corrections:
✅ Breakout 1:
From ~$31K to $48K → +53% move
Followed by a ~20% pullback to ~$38K
➜ This formed a re-accumulation phase, consolidating above prior resistance
✅ Breakout 2:
From $38K to $73K → +50% move
Then a deeper ~31% correction to ~$50K
✅ Breakout 3:
From $50K to $109K → +48% move
Current pullback to ~$74K → ~31% retracement
Now trading near ATH region again
🧠 Key Observation
In this cycle, we’re seeing not only one accumulation at the bottom, but also clear Wyckoff Re-Accumulation zones forming after each breakout, especially after Breakouts 1 and 3.
This suggests institutional accumulation continues during the trend, supporting the idea that:
Pullbacks are for re-loading, not distribution
Trend strength remains intact as long as prior re-accumulation lows hold
🧭 What This Means for the Current Cycle
If this structure continues, BTC may be preparing for another markup leg above $110K
Historical fractals from past bull markets (e.g., 2020–2021) show similar behavior
RSI structure and market rhythm continue to favor trend continuation, not exhaustion
📌 Conclusion
We are likely in the mid-to-late phase of a well-structured bull market, supported by:
Wyckoff Accumulation at the bottom
Re-Accumulations after each breakout
Healthy 20–31% pullbacks
RSI confirming internal strength
🔔 Next levels to watch:
Support: $74K, $88K
Resistance: $111K–$115K
Breakout target (if pattern continues): $145K–$175K zone
📢 Let me know what you think!
Do you see similar Wyckoff structure?
Drop your thoughts or charts below 👇
#BTC #Bitcoin #Wyckoff #CryptoTA #TradingView #BTCAnalysis #Reaccumulation #RSI #BullMarket
BTCUSD Scalp Longwe´ve just created a nice bottom formation. If we can breake through the Daily open end get a long confirmation, there is a high potential for a long scalp trade
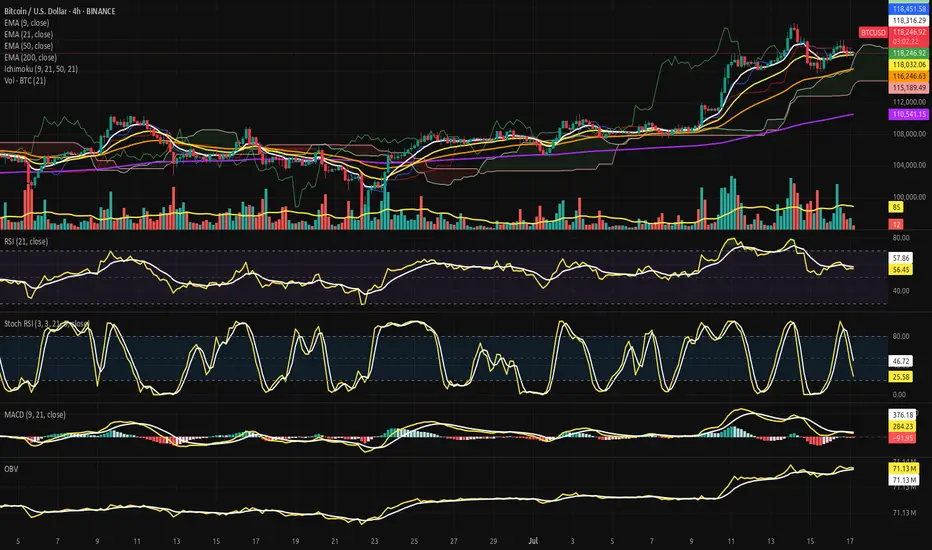
Bitcoin Strategic Compression Beneath the Cloud Gate.⊣
⟁ BTC/USD - BINANCE - (CHART: 4H) - (July 17, 2025).
◇ Analysis Price: $118,099.62.
⊣
⨀ I. Temporal Axis - Strategic Interval – (4H):
▦ EMA9 - (Exponential Moving Average - 9 Close):
∴ EMA9 is currently positioned at $118,286.83, marginally above the current price of $118,099.62;
∴ The slope of the EMA9 has begun to turn sideways-to-downward, indicating loss of short-term acceleration;
∴ The price has crossed below EMA9 within the last two candles, suggesting an incipient rejection of immediate bullish continuation.
✴️ Conclusion: Short-term momentum has weakened, positioning EMA 9 as immediate dynamic resistance.
⊢
▦ EMA21 - (Exponential Moving Average - 21 Close):
∴ EMA21 is measured at $118,018.67, positioned slightly below both price and EMA9, indicating a recent tightening of trend structure;
∴ The slope of EMA21 remains positive, preserving the medium-range bullish structure intact;
∴ EMA21 has been tested multiple times and held as support since July 15 - confirming tactical reliability as dynamic floor.
✴️ Conclusion: EMA21 stands as a critical pivot zone; any sustained breach would denote structural stress.
⊢
▦ EMA50 - (Exponential Moving Average - 50 Close):
∴ EMA50 is currently located at $116,240.85, well below current price action;
∴ The curve maintains a healthy positive inclination, affirming preservation of broader intermediate trend;
∴ No contact or proximity to EMA50 over the last 20 candles - indicating strong bullish detachment and buffer zone integrity.
✴️ Conclusion: EMA50 confirms medium-term bullish alignment; not yet challenged.
⊢
▦ EMA200 - (Exponential Moving Average - 200 Close):
∴ EMA200 stands at $110,539.69, forming the base of the entire 4H structure;
∴ The gradient is gradually rising, reflecting accumulation over a long time horizon;
∴ The distance between price and EMA200 reflects extended bullish positioning, yet also opens risk for sharp reversion if acceleration collapses.
✴️ Conclusion: Long-term structure remains bullish; early signs of overextension exist.
⊢
▦ Ichimoku Cloud - (9, 21, 50, 21):
∴ Price is currently above the Kumo (cloud), placing the pair within a bullish regime;
∴ Tenkan-sen (conversion) and Kijun-sen (base) lines show narrowing separation, suggesting momentum compression;
∴ Senkou Span A > Span B, and the cloud ahead is bullishly twisted, though thinning - indicating potential vulnerability despite structural advantage.
✴️ Conclusion: Bullish regime intact, but loss of momentum and cloud compression warrant caution.
⊢
▦ Volume + EMA21:
∴ Current volume for the latest candle is 3 BTC, compared to the EMA21 of 84 BTC;
∴ This indicates an extremely low participation phase, often associated with distribution zones or indecisive consolidation;
∴ Previous impulsive candles (July 15) reached well above 100 BTC - the current contraction is stark and strategically significant.
✴️ Conclusion: Absence of volume threatens trend continuation; energy depletion apparent.
⊢
▦ RSI - (21) + EMA9:
∴ RSI (21) is positioned at 55.73, marginally above neutral zone;
∴ EMA 9 of RSI is 57.71, crossing downward against RSI - bearish micro signal;
∴ No divergence is present versus price action - oscillator confirms current stagnation rather than exhaustion.
✴️ Conclusion: RSI losing strength above neutral; lacks momentum for breakout, but no capitulation.
⊢
▦ Stoch RSI - (3,3,21,9):
∴ %K is 21.44, %D is 45.34 - both pointing downward, in deacceleration phase;
∴ Recent rejection from overbought zone without full reset into oversold - signaling weak bullish thrust;
∴ Historical cycles show rhythmical reversals near current levels, but only with supportive volume, which is absent now.
✴️ Conclusion: Short-term momentum failed to sustain overbought breakout - micro-correction expected.
⊢
▦ MACD - (9, 21):
∴ MACD line is at -104.80, Signal line at 268.16 - large separation, histogram deeply negative;
∴ The bearish crossover occurred with declining volume, implying fading momentum rather than aggressive sell-off;
∴ No bullish divergence formed yet - continuation of correction remains technically favored.
✴️ Conclusion: MACD confirms trend exhaustion; no reversal in sight.
⊢
▦ OBV + EMA 9:
∴ OBV is 71.13M, perfectly aligned with its EMA9 - indicating equilibrium in volume flow;
∴ No directional bias in accumulation or distribution - flatlining suggests passive environment;
∴ Prior OBV uptrend has stalled since July 15 - reinforcing narrative of hesitation.
✴️ Conclusion: Institutional flow is neutral; no aggressive positioning detected.
⊢
🜎 Strategic Insight - Technical Oracle: The current price structure presents a classic post-impulse compression configuration within a preserved bullish environment. Despite the higher timeframe alignment, multiple short-term indicators exhibit tactical dissonance and signs of momentum decay. This inconsistency reflects a market caught between structural optimism and tactical hesitation.
♘ Key strategic signals - Structural Alignment:
∴ All major EMA's (9, 21, 50, 200) remain stacked in bullish order with no bearish crossovers imminent;
∴ Price remains above the Ichimoku Cloud and above EMA50 - both confirming structural dominance by buyers.
♘ Momentum Degradation:
∴ RSI (21) is drifting below its EMA9, weakening the momentum required for further upside continuation;
∴ Stochastic RSI has rolled over aggressively, failing to reach oversold before reversing - mid-cycle weakness is confirmed.
♘ Volume Collapse:
∴ The current volume profile is critically weak - 3 Bitcoin against an average of 84 Bitcoins (EMA21);
∴ Price attempting to sustain above EMA's with no conviction signals distribution or passivity.
♘ MACD & OBV:
∴ MACD histogram remains deep in negative territory, and no bullish crossover is visible;
∴ OBV is flat - neither accumulation nor distribution dominates, leaving directional thrust suspended.
✴️ Oracle Insight:
∴ The technical field is Structurally Bullish, but Tactically Compressed.
∴ No breakout should be expected unless volume decisively returns above baseline (84 Bitcoins EMA);
∴ Below $117,800, the structure risks transition into a corrective phase;
∴ Above $118,450, potential trigger zone for bullish extension if accompanied by volume surge.
♘ Strategic posture:
∴ Wait-and-observe regime activated;
∴ No entry condition satisfies both structure and momentum at present;
∴ Tactical neutrality is advised until confirmation.
⊢
∫ II. On-Chain Intelligence - (Source: CryptoQuant):
▦ Exchange Reserve - (All Exchanges):
∴ The total Bitcoin reserves held on all exchanges continue a sharp and uninterrupted decline, now at ~2.4M BTC, down from over 3.4M in mid-2022;
∴ This downtrend has accelerated particularly after January 2025, with a visible drop into new lows - no accumulation rebound observed;
∴ Historically, every prolonged depletion of exchange reserves correlates with structural bullish setups, as supply becomes increasingly illiquid.
✴️ Conclusion: On-chain supply is structurally diminishing, confirming long-term bullish regime intact - mirrors technical EMA alignment.
⊢
▦ Fund Flow Ratio - (All Exchanges):
∴ Current Fund Flow Ratio stands at 0.114, which is well below historical danger thresholds seen near 0.20-0.25 during local tops;
∴ The ratio has remained consistently low throughout the 2025 uptrend, indicating that on-chain activity is not directed toward exchange-based selling;
∴ Spikes in this indicator tend to precede local corrections - but no such spike is currently present, reinforcing the notion of non-threatening capital flow.
✴️ Conclusion: Capital is not rotating into exchanges for liquidation - volume weakness seen in 4H chart is not linked to sell intent.
⊢
▦ Miners' Position Index - (MPI):
∴ The MPI sits firmly below the red threshold of 2.0, and currently ranges in sub-neutral levels (~0.5 and below);
∴ This suggests that miners are not engaging in aggressive distribution, and are likely retaining Bitcoin off-exchange;
∴ Sustained low MPI readings during price advances confirm alignment with institutional and long-term accumulation behavior.
✴️ Conclusion: Miner behavior supports structural strength - no mining-induced supply pressure present at this stage.
⊢
🜎 Strategic Insight - On-Chain Oracle:
∴ Across the three strategic indicators, no on-chain evidence supports short-term weakness;
∴ Supply is declining - (Exchange Reserve ↓);
∴ Funds are not preparing for exit - (Flow Ratio stable);
∴ Miners are not selling - (MPI subdued).
✴️ This constellation reinforces the thesis of Structural Bullishness with Tactical Compression, and suggests that any pullback is not backed by foundational stress.
⊢
𓂀 Stoic-Structural Interpretation:
∴ The multi-timeframe EMA stack remains intact and aligned - (9 > 21 > 50 > 200);
∴ Price floats above Ichimoku Cloud, and above EMA21 support, confirming elevated positioning within a macro bull channel;
∴ On-chain metrics confirm supply contraction, miner retention, and absence of fund rotation toward exchanges - structure remains sovereign;
∴ RSI - (21) slips under its EMA9 with low amplitude, indicating absence of energetic flow;
∴ Stoch RSI fails to reset fully and points downward - suggesting premature momentum decay;
∴ MACD histogram remains negative, while volume is significantly beneath EMA baseline (3 BTC vs 84 BTC);
∴ Price faces resistance at Kijun-sen ($118.451), acting as tactical ceiling; no breakout signal detected.
⊢
✴️ Interpretatio Finalis:
∴ Structural integrity remains unshaken - the architecture is bullish;
∴ Tactically, however, the battlefield is fogged - silence reigns in volume, hesitation in oscillators;
∴ A true continuation requires volume resurrection and resolution above $118,450. Until then, neutrality governs the edge.
⊢
⧉
Cryptorvm Dominvs · ⚜️ MAGISTER ARCANVM ⚜️ · Vox Primordialis
⌬ - Wisdom begins in silence. Precision unfolds in strategy - ⌬
⧉
⊢
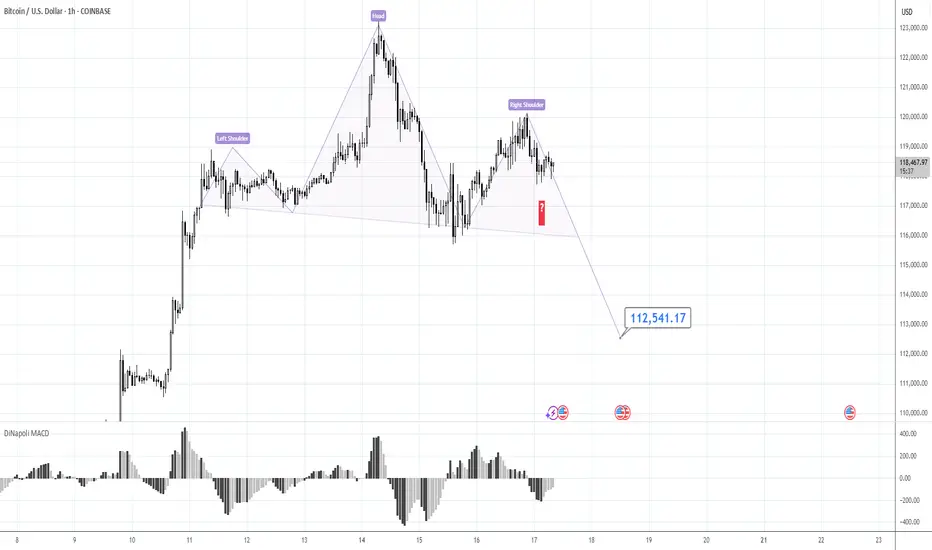
120K is the Key.Morning folks,
Our last plan worked perfect - market re-tested 117K support and jumped out. If you have longs - you could keep it.
We consider now two alternative scenarios, although we think that this one with triangle is more probable, we do not exclude the H&S shape on 1H chart that could lead BTC down to 112-113K support area.
So, if you do not know how to deal with this - keep an eye on the 120K area and top of the right arm. Upside breakout will confirm H&S failure and triangle scenario. Otherwise, until market stands under 120K - consider H&S as a basic scenario, just for safety.
Take care, S.
Bitcoin Day Trade Signsl To Buy NowIf this trade plays out I will make 7x my risk!
Subscribe to my YT channel at DNiceFx to watch me trade live!!
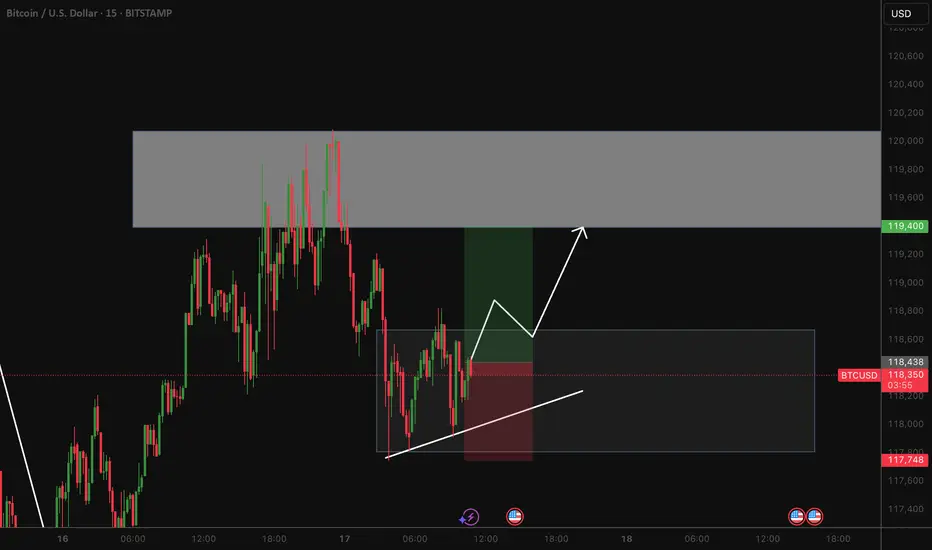
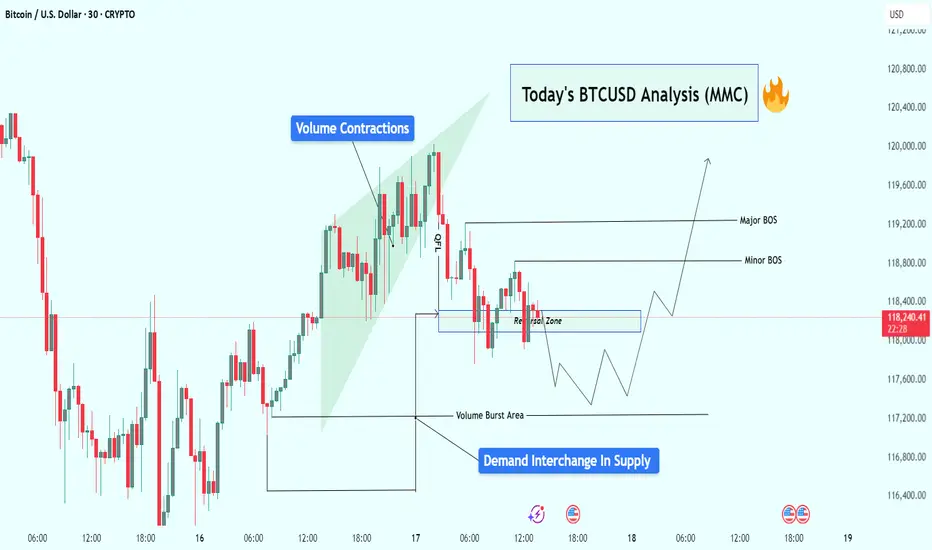
BTCUSD Analysis : Reversal Brewing from Volume Burst Demand Zone🧠 Overview:
Bitcoin is currently showing signs of a potential bullish reversal, following a classic Market Maker Cycle (MMC) pattern. The price action has been clean, respecting both volume dynamics and structural levels, setting the stage for a possible breakout above key areas of interest.
Let’s dive into the detailed breakdown:
🔍 Key Technical Elements:
1️⃣ Volume Contractions – Early Sign of Momentum Shift
At the top left of the chart, we observe a sharp upward move, followed by volume contraction within a rising wedge. This typically represents:
Absorption of orders
Reduced volatility
Market indecision
This kind of structure often precedes a reversal or aggressive breakout, depending on how price behaves near liquidity zones.
2️⃣ Fakeout/Trap Above – Classic MMC Manipulation Phase
After the rising wedge formed, BTC experienced a quick fakeout (stop hunt) just above the highs, then dropped sharply. This was the manipulation leg — a clear signal that liquidity above the wedge was taken and smart money is now repositioning.
🧠 Market makers love to trap breakout traders before moving the opposite way. The drop confirms manipulation is complete.
3️⃣ Reversal Zone + Demand Interchange into Supply
Price then entered a marked reversal zone which was previously an area of demand — now interchanging into supply. This zone is critical because:
It aligns with volume burst zones
It acted as support turned resistance
Multiple rejections confirm order flow shift
This tells us smart money is now testing this area to accumulate or trap sellers.
4️⃣ Volume Burst Area – Institutional Involvement Confirmed
We can clearly identify a Volume Burst Area, where price spiked with strong momentum — this is not retail trading. This zone is now being revisited for a potential bullish re-accumulation.
Expect reaction from this area, as it likely contains unmitigated buy orders from institutions.
5️⃣ Break of Structure (BOS) Mapping:
Minor BOS: Breaks short-term lower highs, showing early intent.
Major BOS: Breaks significant structure, confirming shift in trend direction.
A successful retest of demand and then break of both BOS levels will likely lead to a strong bullish continuation.
📈 Trade Plan & Potential Price Path:
There are two potential bullish entry strategies forming:
✅ Scenario 1: Clean Breakout Plan
Price holds the current reversal zone
Breaks Minor BOS, then Major BOS
Retest of BOS confirms continuation
📍 Target: $119,600+
✅ Scenario 2: Liquidity Sweep Entry
Price dips lower into Volume Burst Area
Sweeps liquidity below and prints a bullish reaction
Enters from discount zone
Same upside targets apply
🧠 This would be a smart money entry — entering from the lowest point of pain for retail traders.
🧵 Final Thoughts:
BTC is setting up beautifully for a reversal continuation pattern within the MMC framework. We’ve seen:
📉 Initial drop (accumulation phase)
🎭 Fake breakout (manipulation phase)
📈 Upcoming expansion (breakout phase)
All signs point to a high-probability move upward, especially if price confirms with BOS + retest. Be patient, wait for price action to align with structure and volume clues.
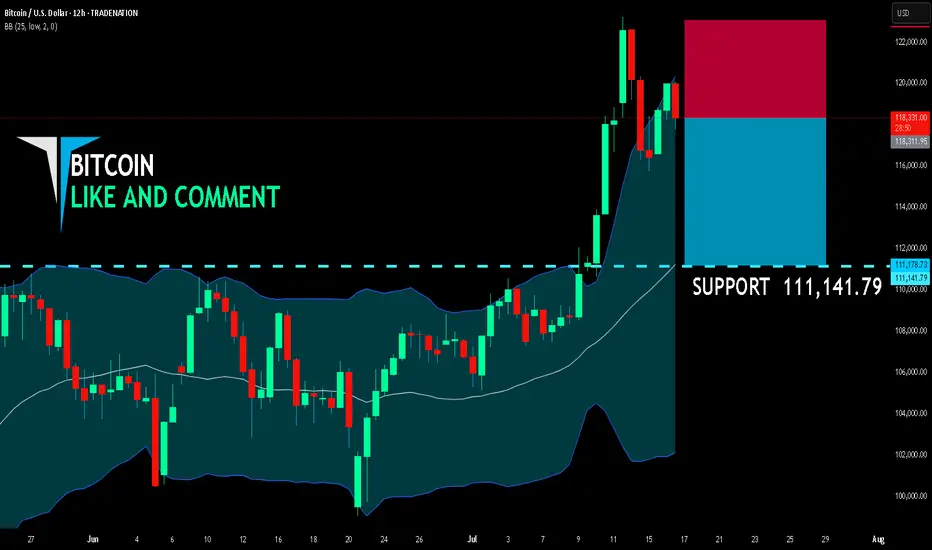
BITCOIN SHORT FROM RESISTANCE
BITCOIN SIGNAL
Trade Direction: short
Entry Level: 118,311.95
Target Level: 111,141.79
Stop Loss: 123,054.98
RISK PROFILE
Risk level: medium
Suggested risk: 1%
Timeframe: 12h
Disclosure: I am part of Trade Nation's Influencer program and receive a monthly fee for using their TradingView charts in my analysis.
✅LIKE AND COMMENT MY IDEAS✅
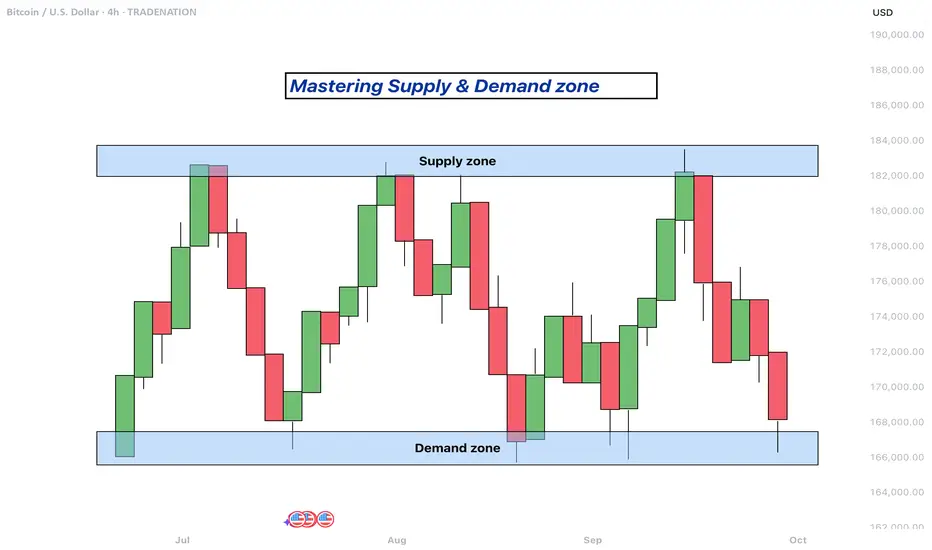
Mastering supply and demand zones - how to use it in trading?Supply and demand zones are key concepts in technical analysis used by traders to identify potential price reversal areas on a chart. They are based on the idea that prices move due to an imbalance between buyers (demand) and sellers (supply).
-------------------------
What will be discussed?
- What are supply and demand zones?
- How to detect supply and demand zones?
- Examples from supply and demand zones?
- How to trade using supply and demand zones?
-------------------------
What are supply and demand zones?
Supply and demand zones are areas on a price chart where the forces of buying and selling are strongly concentrated, causing significant movements in price. In simple terms, a supply zone is an area where selling pressure exceeds buying pressure, often leading to a drop in price. It usually forms when price moves upward into a region where sellers begin to outnumber buyers, pushing the price back down. On the other hand, a demand zone is a region where buying pressure exceeds selling pressure, typically resulting in a rise in price. This occurs when price moves downward into a region where buyers see value and begin to outnumber sellers, causing the price to increase again.
These zones reflect areas of imbalance in the market. In a supply zone, sellers are more eager to sell than buyers are to buy, often due to overbought conditions, news, or fundamental changes. In a demand zone, buyers are more eager to buy than sellers are to sell, often because the price has become attractive or undervalued. Traders look for these zones because they provide clues about where price may reverse or stall, offering potential entries or exits for trades.
-------------------------
How to detect supply and demand zones?
Identifying supply and demand zones involves analyzing price action on a chart, typically using candlestick patterns. A common way to detect a supply zone is to look for a sharp upward move followed by a sudden reversal or strong drop in price. The area where the price stalled before falling sharply is likely to be a supply zone. This zone includes the highest candle body or wick before the drop, and a few candles before it that mark where the selling pressure began.
To identify a demand zone, you would look for a sharp drop in price followed by a strong rally upward. The area where the price paused before rising significantly can be considered a demand zone. Like with supply zones, the demand zone includes the lowest candle before the price reversed and a few candles leading up to it.
These zones are not exact price levels but rather ranges. Price does not have to touch an exact line to react; it often moves within the general area. For more accuracy, traders often refine their zones by identifying them on higher time frames such as the 4-hour or daily chart, then adjusting them slightly on lower time frames like the 1-hour or 15-minute chart.
-------------------------
Examples from supply and demand zones:
-------------------------
How to trade using supply and demand zones?
Trading supply and demand zones involves anticipating how price is likely to behave when it returns to one of these key areas. A common method is to wait for price to enter a zone and then watch for confirmation that it is going to reverse. For example, if price rises into a supply zone, you might look for signs like a bearish candlestick pattern, a drop in volume, or a rejection wick to signal that sellers are stepping in again. This would be an opportunity to enter a short trade with the expectation that price will fall.
Conversely, if price falls into a demand zone, you would wait for bullish signals—such as a strong bullish candle, a double bottom pattern, or clear rejection of lower prices—to confirm that buyers are returning. This would be a potential setup for a long trade, expecting the price to move up from the zone.
Traders often place stop losses just beyond the zone to limit risk in case the level fails. For a supply zone, the stop loss would go just above the zone, while for a demand zone, it would go just below. Targets can be set at recent support or resistance levels, or by using risk-reward ratios like 1:2 or 1:3 depending on the trader’s strategy.
Patience and discipline are important when trading these zones. Not every zone will lead to a reversal, and false breakouts can occur. Therefore, combining supply and demand analysis with other tools such as trendlines, moving averages, or indicators can improve the chances of a successful trade.
In summary, supply and demand zones help traders understand where large buying or selling forces are likely to influence price. By learning to identify these zones and waiting for confirmation signals, traders can enter high-probability trades with clear risk and reward levels.
-------------------------
Disclosure: I am part of Trade Nation's Influencer program and receive a monthly fee for using their TradingView charts in my analysis.
Thanks for your support. If you enjoyed this analysis, make sure to follow me so you don't miss the next one. And if you found it helpful, feel free to drop a like and leave a comment, I’d love to hear your thoughts!
BTCUSD Time to Short BTC was rejected form the recent resistance area and is likely to go down to around 140000. Wait for breakdown of the support
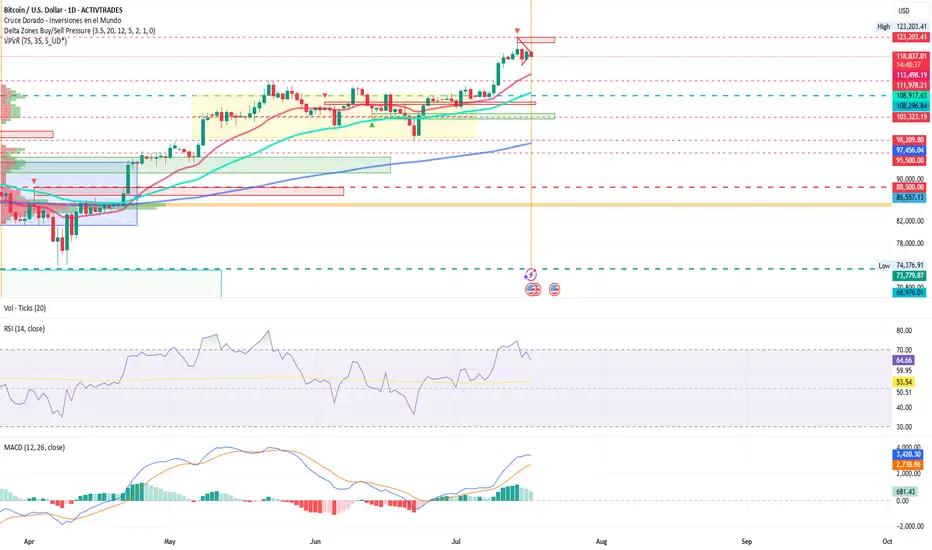
Crypto Week in the U.S. – Bitcoin SurgesCongressional Crypto Week: Bitcoin Hits All-Time Highs in a Decisive Week for the U.S.
Ion Jauregui – Analyst at ActivTrades
Bitcoin (BTCUSD) is back in global headlines after breaking above $123,203 this Tuesday, setting a new all-time high in the same week. So far in July, the leading cryptocurrency has surged 17%, fueled by a combination of institutional inflows, political momentum, and evolving regulation. This week, Washington is hosting “Crypto Week,” a key event that may define the legal and financial future of digital assets in the United States. At the same time, institutional backing shows no signs of slowing down—Bitcoin ETFs continue to set records for net inflows, particularly BlackRock’s IBIT, now managing over $85 billion in assets.
ETFs, Trump, and Regulation: All Roads Lead to Crypto
BlackRock’s spot Bitcoin ETF, IBIT, attracted $729 million in net inflows last week alone, setting a historic milestone by becoming the fastest ETF ever to reach $80 billion in assets under management—just 374 days, compared to over 1,800 days for the previous record held by the Vanguard S&P 500 ETF. The growing institutional interest—with over 265 funds and entities now actively investing in BTC—not only validates the asset class but also tightens supply: BlackRock reportedly acquired an average of more than 860 bitcoins per day last week. This persistent demand is directly contributing to the price momentum.
A Legal Framework in Progress
Three major bills are on the Congressional agenda this week:
The Genius Act: Aims to regulate stablecoins and has already passed the Senate with bipartisan support.
The Clarity Act: Seeks to define which cryptocurrencies qualify as securities or commodities, clarifying regulatory oversight.
The Anti-CBDC Act: Proposes restricting the government’s ability to issue an official digital currency, favoring decentralized ecosystems.
This regulatory push is seen by the market as a sign of institutional consolidation in the crypto space, paralleling the already advanced European MiCA framework.
Technical Analysis of BTCUSD
On the daily chart, Bitcoin broke decisively above the previous ceiling at $112,000 on July 12 and has since been validating a consolidation pattern near the $120,000 level—forming a bullish pennant on the 1-hour chart. The RSI remains overbought at 64.92%, but with no current signs of bearish divergence. The next technical target lies in the $130,000–$135,000 zone, while the nearest support is found at $118,000. A daily close below that level could trigger a technical correction toward $108,000–$109,000, marking the base of the current impulse. The point of control sits far lower at $85,195, although the current move appears to be unfolding within the third of three key volume profile levels. The MACD continues to support price expansion, though trading volume appears to be declining. Delta level indicators suggest strong resistance near current price highs, meaning another push may be needed—possibly triggered by continued regulatory momentum.
*******************************************************************************************
The information provided does not constitute investment research. The material has not been prepared in accordance with the legal requirements designed to promote the independence of investment research and such should be considered a marketing communication.
All information has been prepared by ActivTrades ("AT"). The information does not contain a record of AT's prices, or an offer of or solicitation for a transaction in any financial instrument. No representation or warranty is given as to the accuracy or completeness of this information.
Any material provided does not have regard to the specific investment objective and financial situation of any person who may receive it. Past performance and forecasting are not a synonym of a reliable indicator of future performance. AT provides an execution-only service. Consequently, any person acting on the information provided does so at their own risk. Political risk is unpredictable. Central bank actions can vary. Platform tools do not guarantee success.
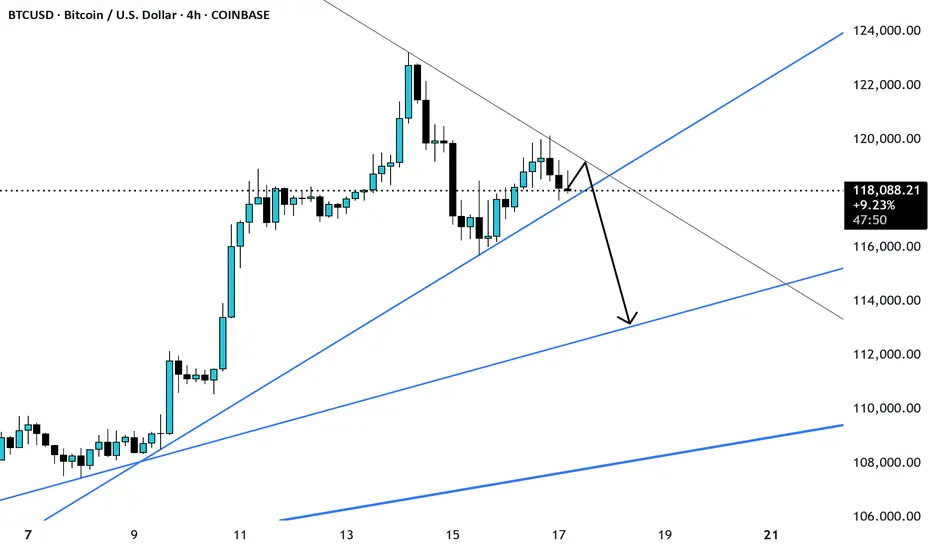
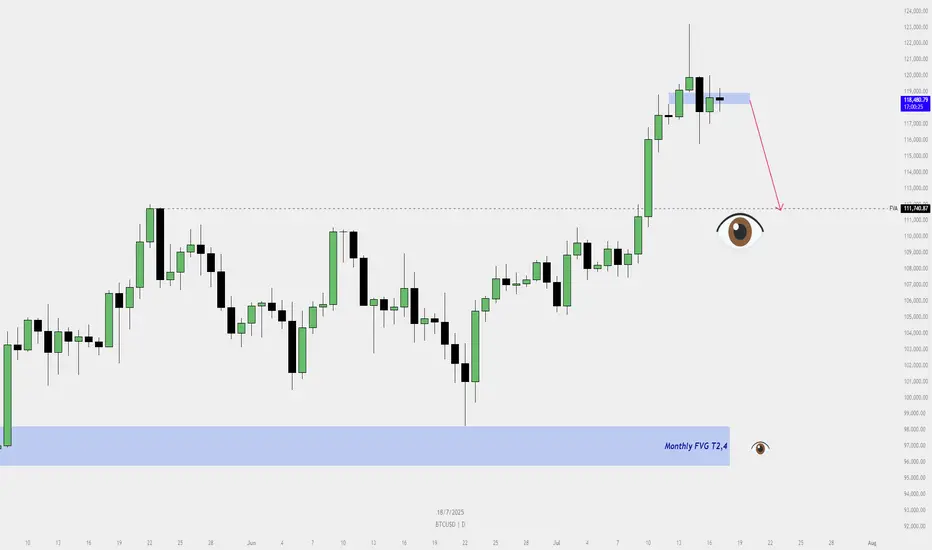
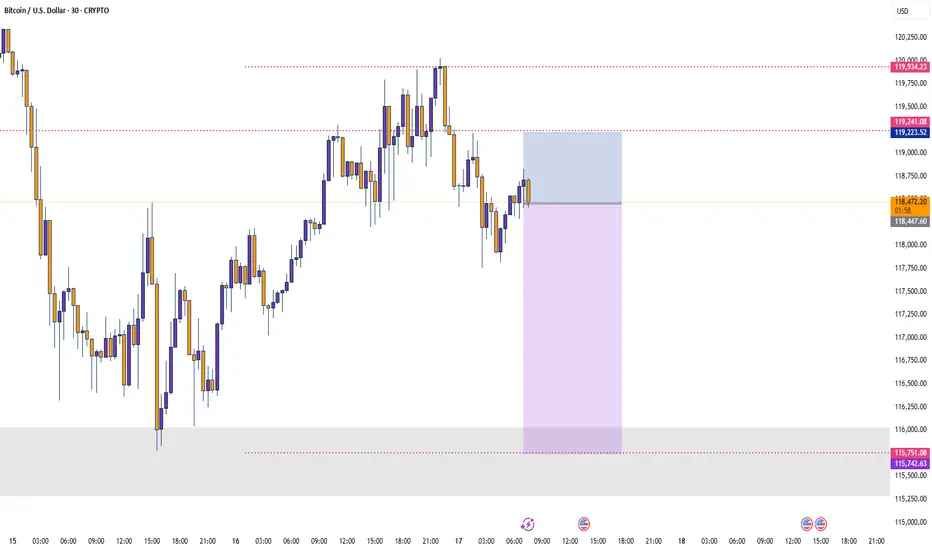
BTCUSD – Pullback Imminent?📉 BTCUSD – Pullback Imminent?
Buyers beware ⚠️ — The bullish FVG on the daily chart is no longer holding. Price has shown signs of rejection from the premium zone , and a deeper pullback toward the Fair Value Area at 111,740 seems likely.
🧠 Let the market breathe... we’ll catch the real ride from below.
👀 Eyes on the Monthly FVG (T2,4) as the ultimate demand zone if price accelerates lower.
SellRejection Level
Daily Volume
Market Structure Shift
London Session
Trend Line Break
Untapped Order Point
Head And Shoulder Pattern
Bitcoin Buy analysis/ideaThis analysis is based on the 4-hour and 1-hour timeframes and executed using Supply and Demand trading and trend formation. Complete explanation in the video!

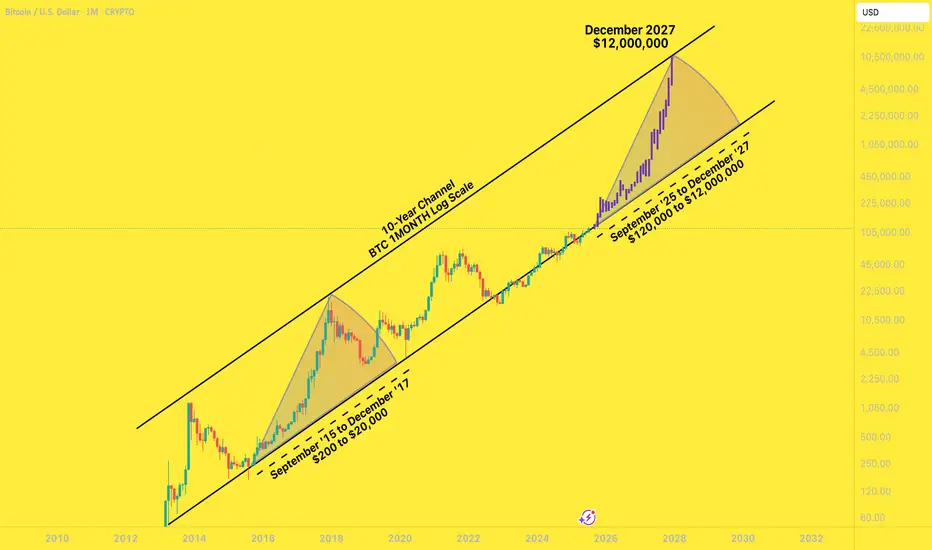
BTC to $12,000,000 December '27I had a years-old bookmarked chart from @MillionaireEconomics that I wanted to update and pick a random, extremely bullish candle pattern from the last time BTC came off the bottom channel to slap on it.
Riddle me this:
Why shouldn't Bitcoin go to $12,000,000 by December 2027?
Saylor continues to lead the way for global companies to scramble to build their own BTC warchests. These early adopters are having investor money dumped into them by the truckload.
Countries are stacking BTC
The BTC ETFs are a smash hit
Trump is all for making his own multi-billy family bitty stack
Mid-curvers will sell far too early, for far too little.
In the next two years, you'll be bombarded with countless, seemingly good reasons to sell your Bitcoins for hundreds of thousands of dollars - and then millions of dollars.
A shocking number of people will be far too early to sell. They will wake up in a cold sweat, night after night, haunted by their "could-have-been" stack, the number that updates in their head ten times a day, going up by six or seven figures a day .
... until they FOMO right back in at $11,999,999.