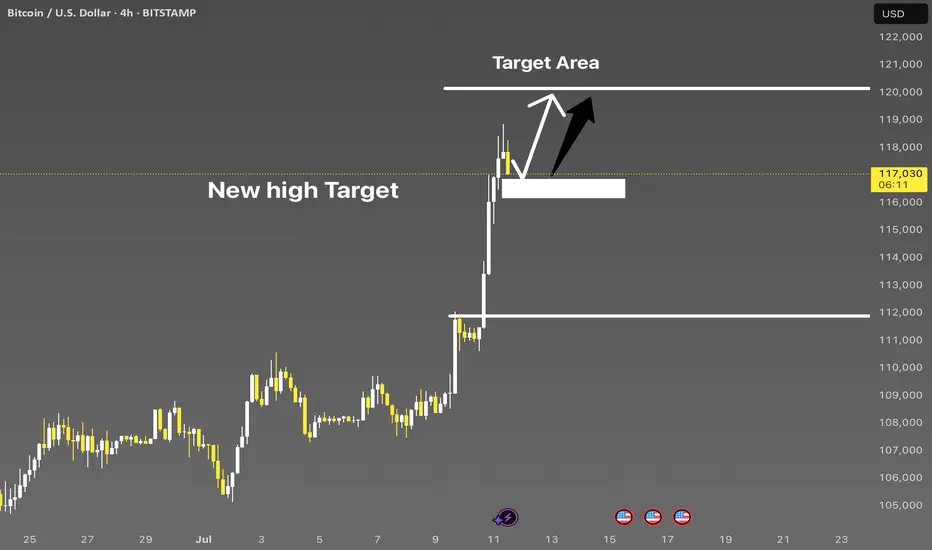
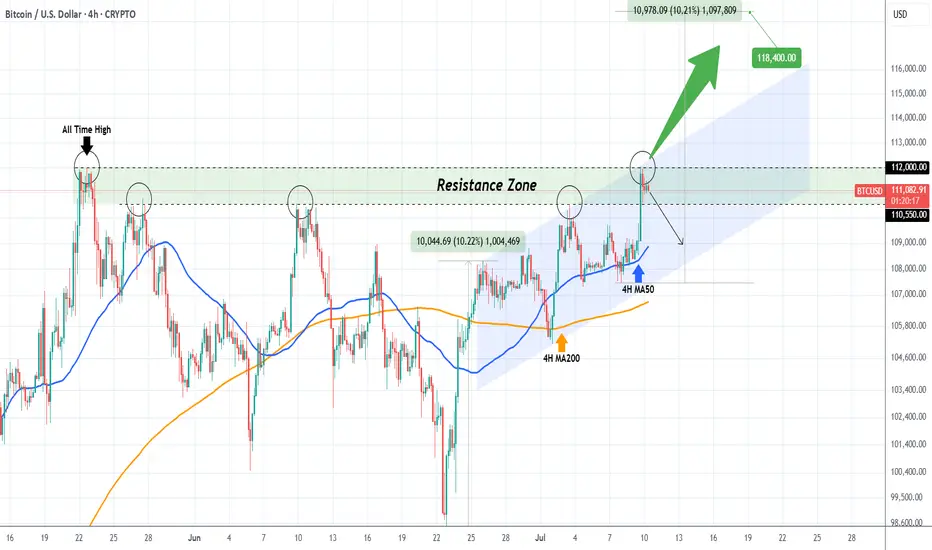
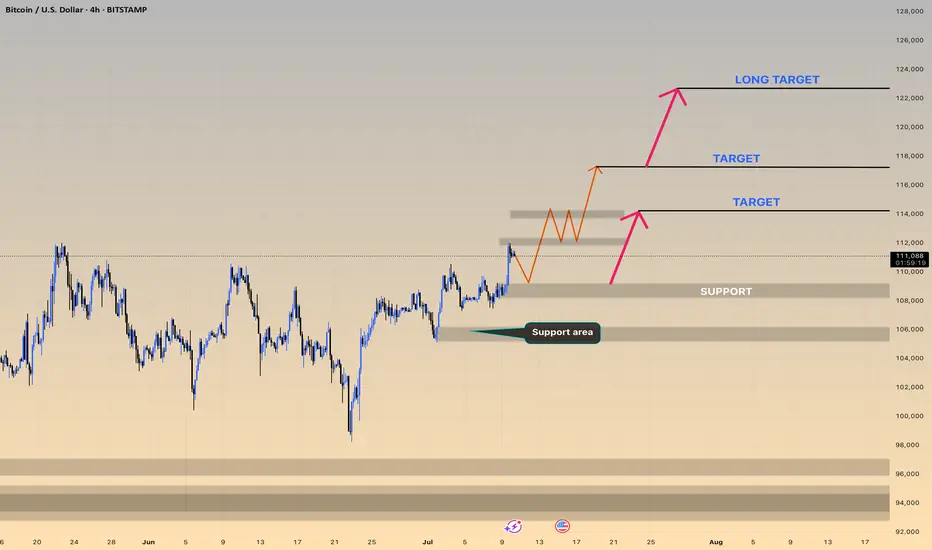
BITCOIN facing the most important Roadblock of the Cycle.Bitcoin (BTCUSD) reached $112000 yesterday, testing the May 22 2025 All Time High (ATH) and immediately got rejected. This ATH rejection is key to the continuation of the bullish trend as the entirety of the ATH Resistance Zone is perhaps the last (and most important) Roadblock before the final rally of the Cycle that could potentially price the new Top.
You can see that this Resistance Zone already had 3 rejections previous on its bottom and yesterday was the first one on its top.
A break above it can target $118400 at least within days, in anticipation of a +10.20% Bullish Leg, similar to the one following the June 22 Low.
If the rejection prevails however, we may see a pull-back that will test the bottom of the (blue) Channel Up.
Which scenario do you think will prevail? Feel free to let us know in the comments section below!
-------------------------------------------------------------------------------
** Please LIKE 👍, FOLLOW ✅, SHARE 🙌 and COMMENT ✍ if you enjoy this idea! Also share your ideas and charts in the comments section below! This is best way to keep it relevant, support us, keep the content here free and allow the idea to reach as many people as possible. **
-------------------------------------------------------------------------------
💸💸💸💸💸💸
👇 👇 👇 👇 👇 👇
BITCOIN trade ideas
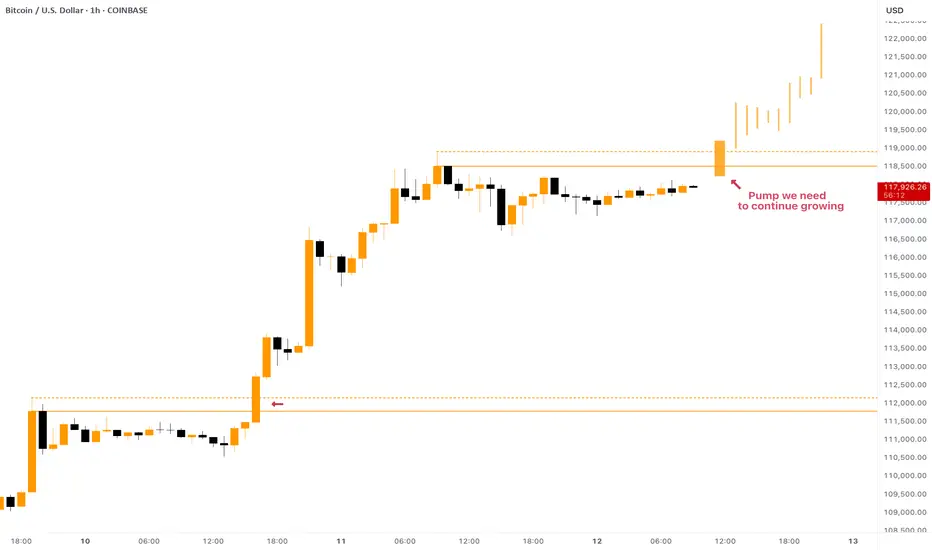
BITCOIN - Local Conditions for Growth ContinuationCRYPTOCAP:BTC showed us an astonishing growth from $108,000 to $118,000 in a few days! But what is next and where is the next target?
At the moment the price is consolidating below the ATH, in fact there are two resistances: $118,500 and $119,000. To continue pumping, Bitcoin has to break both of them with strong impulse.
To be honest , the current price development reminds me of what we've seen a couple days ago: breakout of the resistance -> consolidation below local highs -> strong breakout and growth continuation. Something similar can be expected now as well.
In the past couple of years CRYPTOCAP:BTC taught us a lesson of waiting no time to hop on the train . When it pumps - it does it quickly, just like it does it this time. So, waiting for the best entry near $109,000 - $110,000 might leave you behind while Bitcoin will be pumping towards $125,000.
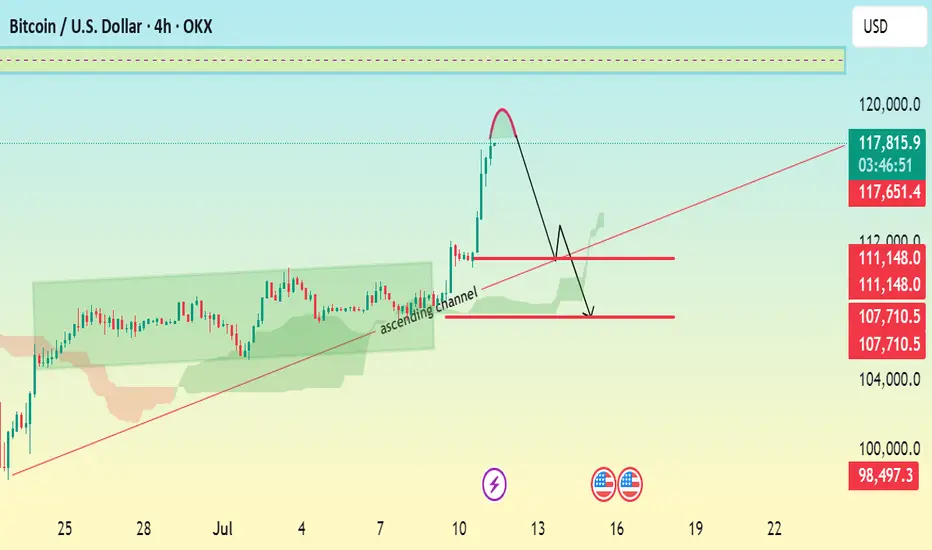
BTC/USD 4H CHART ANALYSIS \ BEARISH CORRECTION EXPECTED.Current Price: $117,755
Trend: Recently bullish, now facing a potential correction
Chart Pattern: Breakout above ascending channel, followed by a sharp projected correction.
🔍 Technical Breakdown:
> Ascending Channel:
Price was respecting an ascending channel (highlighted in green).
A bullish breakout occurred with strong momentum.
> Sharp Rejection & Correction Setup:
After the breakout, a steep rally seems to have peaked.
The red curved arrow suggests a completed bullish impulse, now setting up for a bearish correction.
> Key Levels:
Resistance Zone: $118,000 – $120,000
Immediate Support: $111,150
Next Major Support: $107,700
Bearish Target Support: $105,945
🎯 Trade Setup Suggestion:
Short Entry Zone: Around $111,150 if price gets rejected there.
Target: $105,945
Stop-Loss: Above $112,000 (tight risk control)
Weekly Close Watch: Bitcoin’s Key Level Could Shift the ChartsGood morning, Guys
There's only 1 day and 13 hours left until the weekly Bitcoin candle closes.
It's crucial that this candle closes above the 112,331 level with strong volume. Anyone experienced in economics and technical analysis knows just how significant this is.
If we get that close above the level, I’ll share a powerful analysis with a clear target.
I want to sincerely thank everyone who’s been supporting my analyses with likes—your support is
my biggest source of motivation when it comes to sharing content.
Much love to you all—we’re more than just a community, we’re a family. 💛
Quantum Computing - Why BTC isn't the biggest worryYou’ve probably heard that quantum computing could break Bitcoin’s encryption—and that’s true. But here’s the thing: Bitcoin might not even be the biggest target.
The real risks? Financial systems, national security, healthcare, and even the internet itself. These areas rely on the same encryption methods that quantum computers could crack, and the fallout could be far worse than a Bitcoin hack.
Let’s break it down.
1️⃣ Financial Systems: A Global Crisis Waiting to Happen
Imagine if hackers could:
Drain bank accounts at will.
Manipulate stock markets.
Fake trillion-dollar transactions.
This isn’t just about stolen crypto—it’s about economic chaos. Banks, stock exchanges, and payment systems all depend on encryption. If quantum computers break it, we’re looking at a meltdown way bigger than Bitcoin’s $3 trillion market.
2️⃣ National Security & Internet Privacy: A Hacker’s Dream
Governments and militaries use encryption to:
Protect classified intelligence.
Secure communications between leaders.
Guard critical infrastructure (power grids, water supplies).
If quantum computers crack these codes, entire nations could be exposed to cyberwarfare. Your private data? At risk too—email, messaging, even your online banking could be decrypted years later.
3️⃣ Healthcare, Supply Chains & IoT: The Hidden Vulnerabilities
Medical records could be leaked, exposing sensitive health data.
Smart devices (like home security systems) could be hacked.
Supply chains might collapse if logistics networks are breached.
These systems weren’t built with quantum threats in mind—and upgrading them won’t be easy.
🔴 The Bigger Picture: A "Civilizational Upgrade"
Switching to quantum-resistant encryption is like rebuilding the internet’s foundation. It’s necessary, but messy. Some experts compare it to the Y2K bug—but way harder.
🔷 So, Is Bitcoin Safe?
Not entirely—about 25% of all Bitcoin could be stolen if quantum computers advance fast enough. But compared to the risks facing banks, governments, and hospitals? Bitcoin might be the least of our worries.
🔷 What’s Next?
Governments & companies are already working on fixes (like NIST’s post-quantum cryptography standards).
The transition will take years—and hackers might exploit weak spots along the way.
Staying informed is key. If you’re in tech, finance, or security, this affects you.
ℹ️ Want to Dive Deeper?
Deloitte’s take on quantum computing & Bitcoin
Forbes on quantum risks beyond crypto
🤷♂️ Bottom line?
Quantum computing is coming—and while Bitcoin has risks, the real danger lies in the systems we all depend on every day.
❔What do you think? Will we be ready in time? Let me know in the comments! 🚀

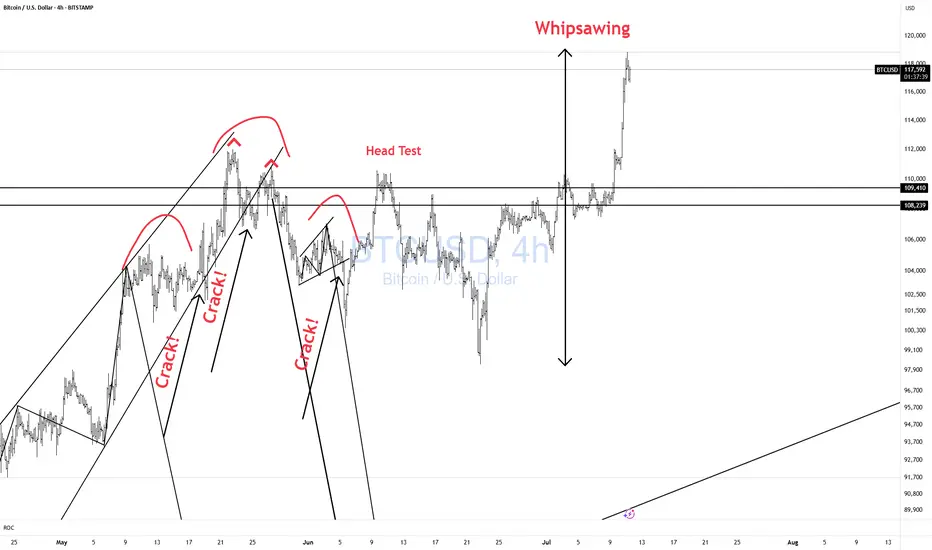
BTCUSD Whipsawing! CAUTION!Bulls CAUTION! Price is whipsawing all over the place.
Better to be out of the market wishing you were in than in wishing you were out!! Don't chase!!
Sell bitcoin now because we are seeing a quick momentum changeSell bitcoin now because we are seeing a quick momentum change, close our
Buy position on small profit and take a sell now
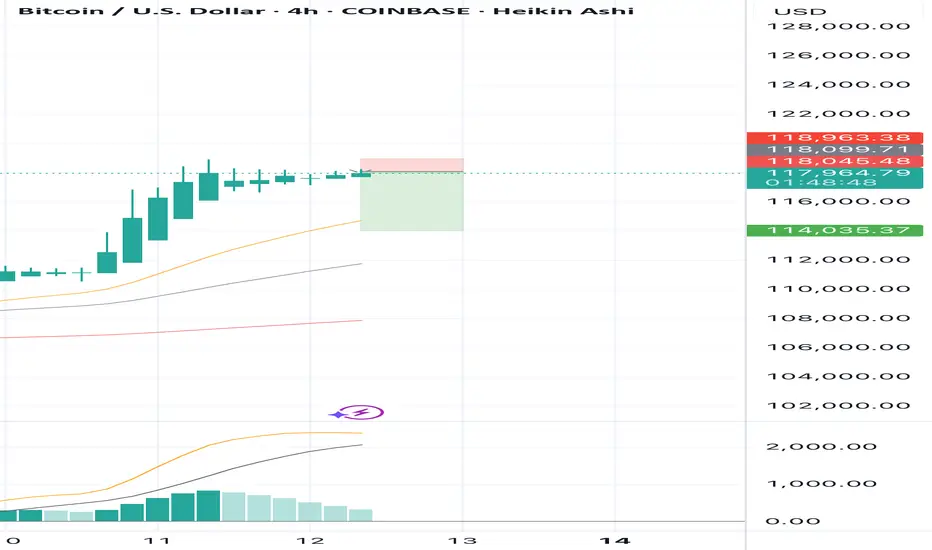
BITCOIN NEXT TARGET 1205001. Professional & Direct:
BTC Long in Play – Eyes on 120,500 🔥
Momentum building strong. Stay in the trend — next target: 120.5K.
---
2. TradingView Style (Engaging):
Bitcoin Bulls Gaining Strength 🚀
Long position active. Targeting next major level at $120,500 — hold tight!
---
3. VIP Signal Tone:
BTC BUY Signal Active ✅
We’re riding the wave to $120,500. Strong confirmation on higher timeframes.
BTCUSD BULLISH MORE all time high again The price may briefly break above the 113,000–114,000 level (first target) to trap long positions, then sharply reverse.
Support Break Warning:
If BTC fails to hold the 110,000–108,000 support zone, it could accelerate a drop to deeper supports:
Support Area 1: 106,000
Support Area 2: 102,000
Extreme Bearish Target: 96,000–94,000
What to Watch:
Bearish divergence on lower timeframes
Volume drop on new highs = possible fakeout
Candle rejection from 113,000–114,000 zone
Are we on Super Bullish Express Highway ? Elliott Waves RoadmapHello friends,
Welcome to RK_Chaarts
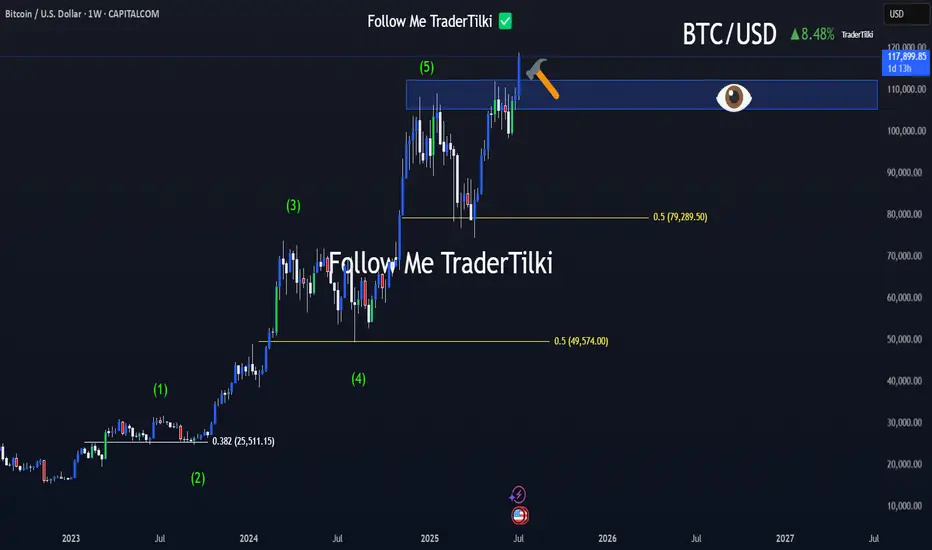
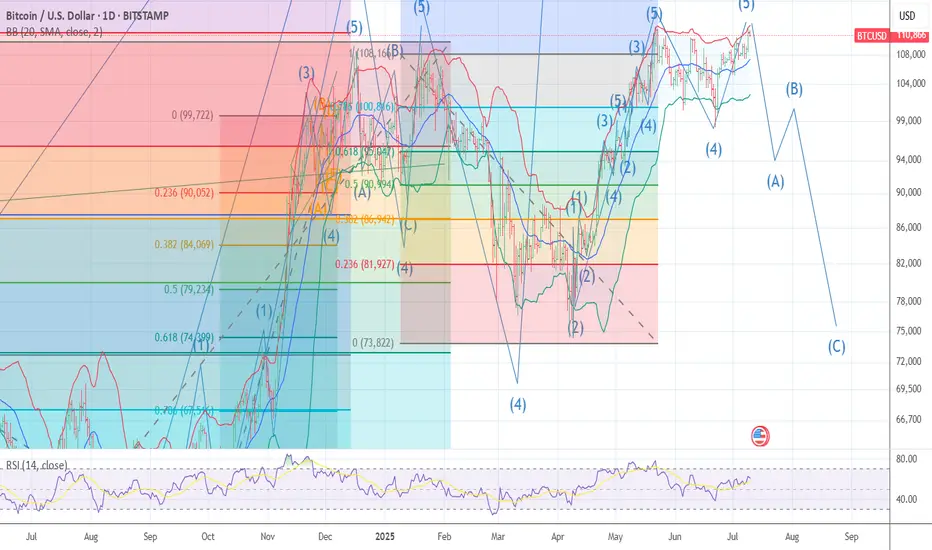
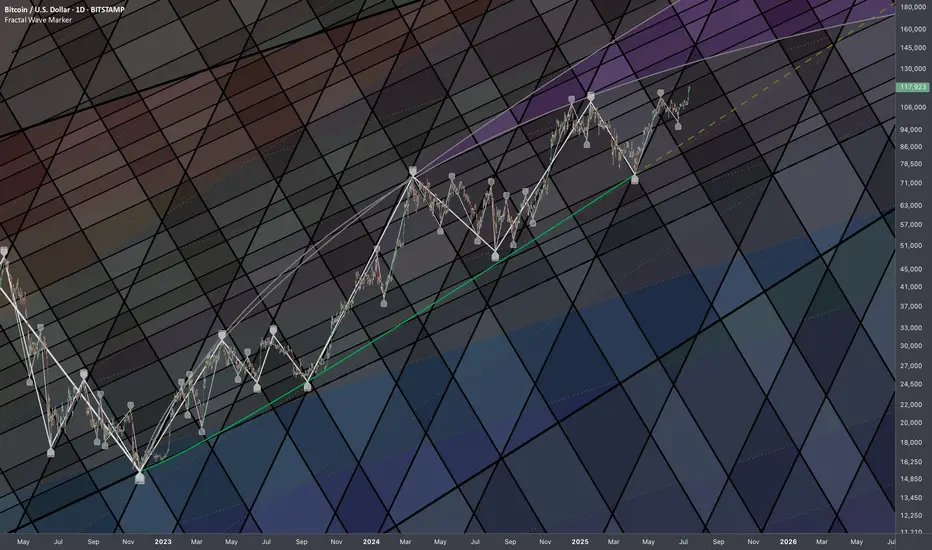
Today we're attempting to analyze Bitcoin's chart, specifically the BTCUSD chart, from an Elliott Wave perspective. Looking at the monthly timeframe chart, which spans the entire lifetime of Bitcoin's data since 2011, we can see the overall structure. According to Elliott Wave theory, it appears that a large Super Cycle degree Wave (I) has completed, followed by a correction in the form of Super Cycle degree Wave (II), marked in blue.
Now, friends, it's possible that we're unfolding Super Cycle degree Wave (III), which should have five sub-divisions - in red I, II, III, IV, & V. We can see that we've completed red I & II, and red III has just started. If the low we marked in red II doesn't get breached on the lower side, it can be considered our invalidation level.
Next, within red III, we should see five primary degree sub-divisions in black - ((1)), ((2)), ((3)), ((4)) & ((5)). We can see that we've completed black ((1)) & ((2)) and black ((3)) has just started. Within black ((3)), we should see five intermediate degree sub-divisions in blue - (1) to (5). Blue (1) has just started, and within blue one, we've already seen red 1 & 2 completed, and red 3 is in progress.
So, we're currently in a super bullish scenario, a third of a third of a third. Yes, the chart looks extremely bullish. We won't commit to any targets here as this is for educational purposes only. The analysis suggests potential targets could be very high, above $150,000 or $200,000, if the invalidation level of $98,240 isn't breached. But again, friends, this video is shared for educational purposes only.
Many people think that the market doesn't move according to Elliott Waves. But friends, here we've tried to analyze from the monthly time frame to the overly time frame. We've definitely aligned the multi-time frame and also aligned it with the principal rules of Elliott Waves, without violating any of its rules.
I agree that the Elliott Wave theory can be a bit difficult, and for those who don't practice it deeply, it can be challenging. But yes, the market moves according to this methodology, following this pattern. This is a significant achievement.
I am not Sebi registered analyst.
My studies are for educational purpose only.
Please Consult your financial advisor before trading or investing.
I am not responsible for any kinds of your profits and your losses.
Most investors treat trading as a hobby because they have a full-time job doing something else.
However, If you treat trading like a business, it will pay you like a business.
If you treat like a hobby, hobbies don't pay, they cost you...!
Hope this post is helpful to community
Thanks
RK💕
Disclaimer and Risk Warning.
The analysis and discussion provided on in.tradingview.com is intended for educational purposes only and should not be relied upon for trading decisions. RK_Chaarts is not an investment adviser and the information provided here should not be taken as professional investment advice. Before buying or selling any investments, securities, or precious metals, it is recommended that you conduct your own due diligence. RK_Chaarts does not share in your profits and will not take responsibility for any losses you may incur. So Please Consult your financial advisor before trading or investing.

BITCOIN TO BREAK DOWN SHARP on any new highThe chart of Bitcoin I DO NOT SEE 140 I see under 98 k soon into late july cycle I have NOT CHANGED THE LABEL in my EW work .best of trades WAVETIMER
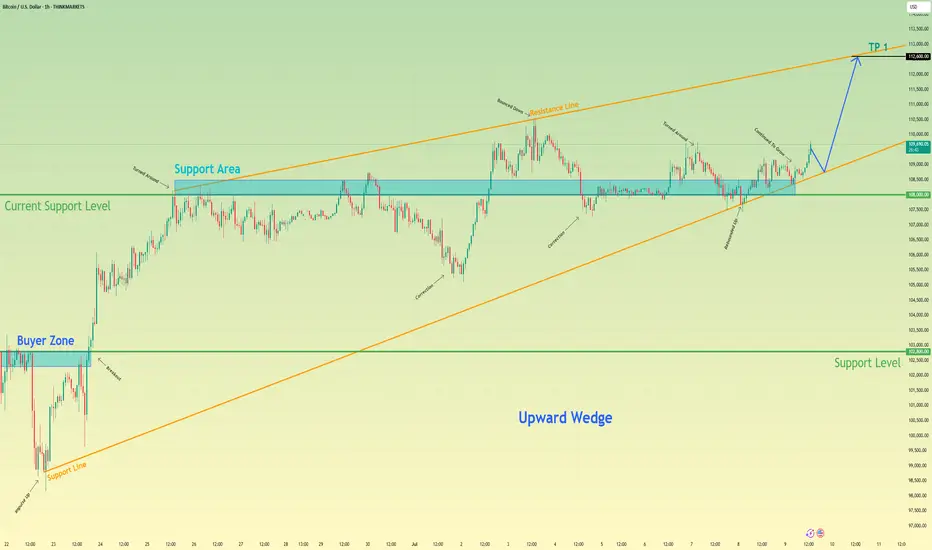
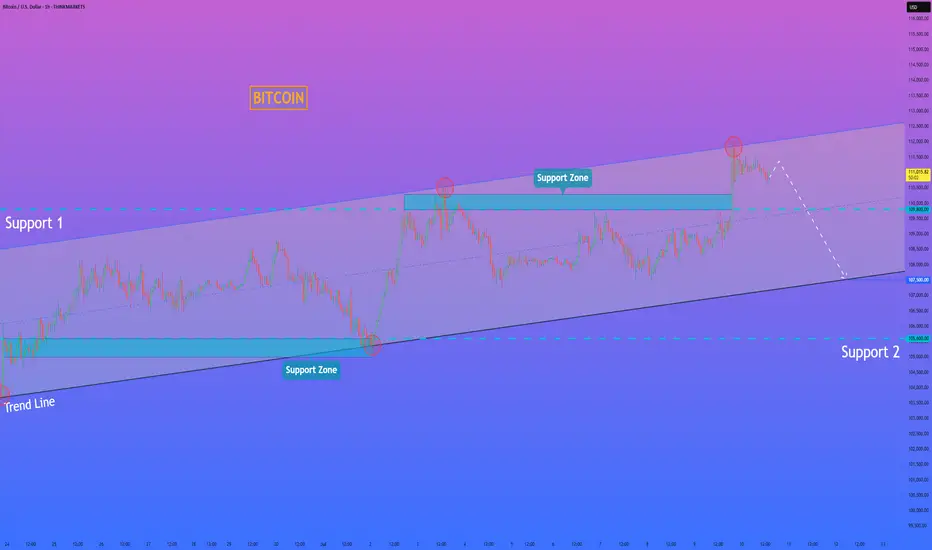
Bitcoin can rebound up from support line of upward wedgeHello traders, I want share with you my opinion about Bitcoin. In this chart, we can see how the price dropped from the 102800 support level, which coincided with the buyer zone, and later entered to wedge upward. In this pattern, price made an impulse up from the support line of the wedge pattern and broke the 102800 support level, after making a retest, and continued to move up. Bitcoin rose to the current support level, which coincided with a support area and even entered this area, but soon turned around and fell below. Next, price rose to this area again and then made a correction movement, after which it turned around and made an impulse up to the resistance line of the wedge, breaking the 108000 level. After this movement, the price bounced from this line and fell back to the current support level, where it some time traded in the support area. Later price rebounded and continued to move up. Now, I expect that BTC can correct to support line of the wedge and then rise to the resistance line of this pattern. That's why I set my TP at the 112600 points, which coincided with this line. Please share this idea with your friends and click Boost 🚀
Disclaimer: As part of ThinkMarkets’ Influencer Program, I am sponsored to share and publish their charts in my analysis.
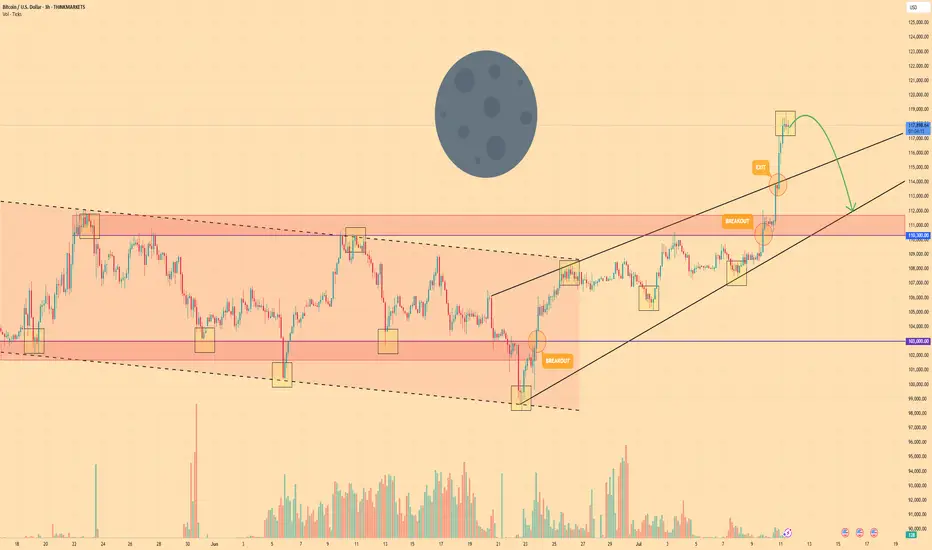
BITCOIN - Price can go into correction after reaching new ATHHi guys, this is my overview for BTCUSD, feel free to check it and write your feedback in comments👊
Bitcoin spent weeks confined to a tight falling channel, carving out a series of lower highs and lower lows as sellers maintained full control of the market.
The breakout above $110300 ignited a powerful rally, propelling BTC into an ascending wedge formation and driving price sharply higher toward a fresh all-time high at $118800.
Once the ATH was reached, selling pressure reasserted itself, halting further upside and triggering a loss of bullish momentum.
This lightning-fast climb to $118800 appears to have drained buyer enthusiasm.
Key support now resides around $110300 - $111700, backed by the wedge base.
Given the exhaustion of buyers and the clear wedge resistance, I anticipate BTC to retrace toward the $112000 area following its recent surge.
If this post is useful to you, you can support me with like/boost and advice in comments❤️
Disclaimer: As part of ThinkMarkets’ Influencer Program, I am sponsored to share and publish their charts in my analysis.
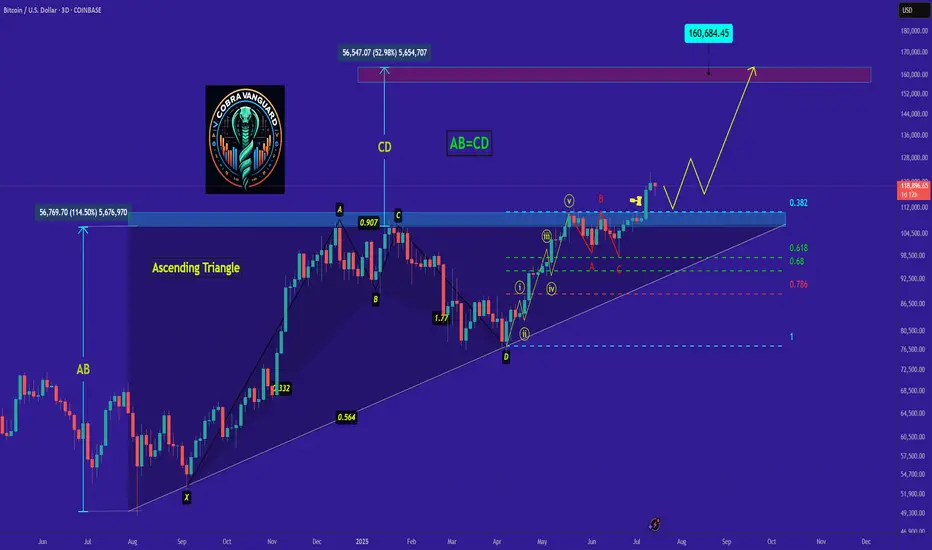
Do you think I'm joking ???As I said, Bitcoin broke the triangle, and now with a slight price correction, it could surge to $160,000, and you still think I'm joking!!
Previous analysis
Best regards CobraVanguard.💚
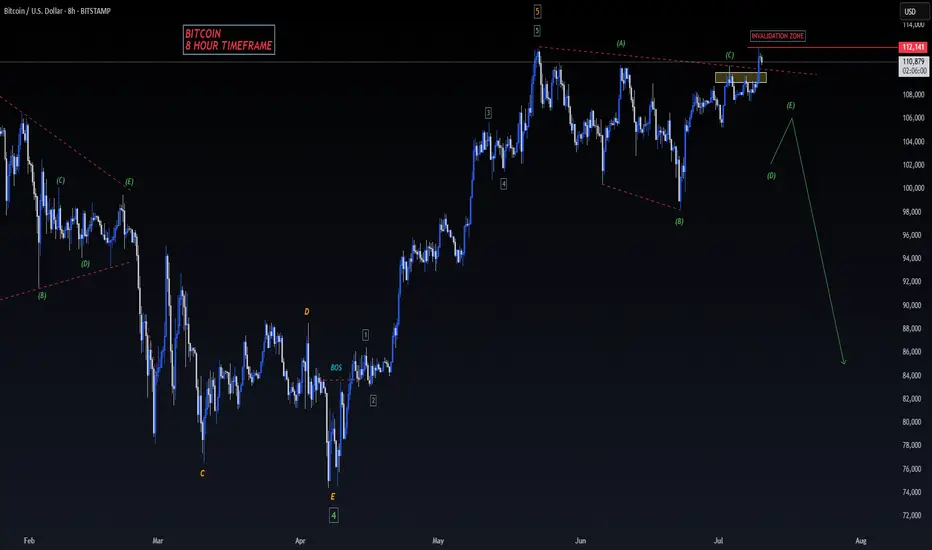
BITCOIN - SELL TO $86,000 (8H UPDATE)Bitcoin spiked up last night, but just about missed our 'Invalidation Zone' of $112,140 by a few pips. As long as this level can hold & sellers move back down, this sell analysis is still valid.
A lot of whipsaw price action in the markets right now, so use stick risk management.
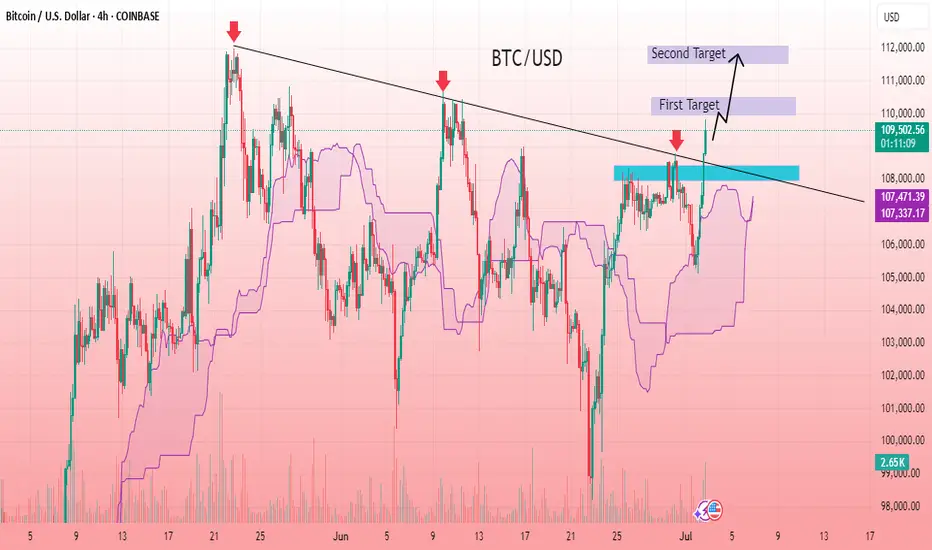
BTC Breakout Alert: Ready for the Next Bullish Wave The BTC/USD 4-hour chart shows a clear breakout above a descending trendline that has acted as resistance since mid-May. After multiple rejections, the price has now broken above the structure, signaling bullish momentum. The Ichimoku cloud confirms support underneath, providing confluence for a potential rally. The bullish breakout is also accompanied by increasing volume and a bullish engulfing pattern near the breakout zone, which adds confirmation. Price is currently consolidating just above the breakout area, suggesting a retest may be forming before further upside continuation. If momentum sustains, higher levels could soon be tested in the coming sessions.
Entry: 109,400
1st Target: 110,000
2nd Target: 111,870
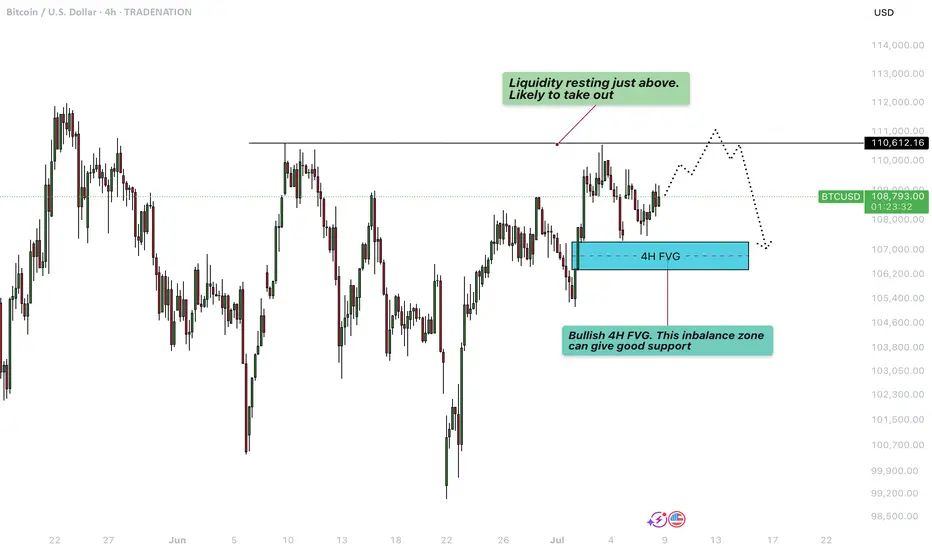
Bitcoin - Liquidity grab at $111.000?This 4-hour BTCUSD chart illustrates a potential short-term bullish continuation scenario followed by a deeper retracement, highlighting key liquidity levels and an important Fair Value Gap (FVG) support zone.
Liquidity sweep
At the top of the current price action, just above the $110,612.16 level, there is a clear area of resting liquidity. This zone has likely accumulated a significant number of stop-loss orders from traders who are shorting the market or who went long earlier and are protecting profits below previous highs. The market tends to seek liquidity to fill institutional orders, making this zone a high-probability target for a sweep. As a result, price is likely to take out these resting stop orders in a quick upward move, often referred to as a "liquidity grab" or "stop hunt", before potentially reversing or consolidating.
Bullish 4H FVG
Following this liquidity sweep, the chart suggests a retracement into a bullish 4-hour Fair Value Gap (FVG) located around the $106,600 to $107,400 region. This imbalance zone was formed during an impulsive move up, leaving behind a gap between the wicks of consecutive candles. Such gaps represent areas where demand previously overwhelmed supply, and they often act as strong support on a retest. If price revisits this zone, it is expected to offer support and could serve as a base for another upward push, assuming bullish momentum remains intact.
Downside risk
However, if the bullish FVG fails to hold as support and price breaks down through this imbalance zone, it would signal a weakening of bullish structure. In that case, the breakdown would likely lead to a deeper correction or even a trend reversal, with price seeking lower levels of support further down the chart. This would invalidate the short-term bullish scenario and suggest that sellers are gaining control, possibly triggering further liquidations and more aggressive selling pressure.
Conclusion
Overall, the chart is currently leaning bullish, anticipating a liquidity sweep to the upside followed by a potential pullback into the FVG. The reaction at the FVG will be critical in determining whether the market can continue higher or if it shifts into a deeper bearish correction.
Disclosure: I am part of Trade Nation's Influencer program and receive a monthly fee for using their TradingView charts in my analysis.
Thanks for your support.
- Make sure to follow me so you don't miss out on the next analysis!
- Drop a like and leave a comment!
HelenP. I Bitcoin can continue to fall and break support levelHi folks today I'm prepared for you Bitcoin analytics. If we look at the chart, we can see that Bitcoin has been trading inside a well-defined upward channel. The price recently touched the upper boundary of this channel for the second time and formed a clear reaction, indicating strong resistance. After this, BTCUSD started to pull back from the resistance zone around 110300 - 109800 points. At the moment, it is trading slightly above this support area, but momentum is already shifting downward. Given this structure, I believe Bitcoin is likely to continue its decline and break below the support zone. The previous upward impulse has already lost steam, and there are no signs of strong buying activity around the current levels. The next logical target in this scenario is the lower boundary of the channel, near the 107500 level, where the trend line acts as dynamic support. This level has historically served as a rebound point, and I expect it to do so again. My current idea is short, aiming for a move down toward the trend line. If BTCUSD breaks through the first support and confirms the weakness, the price could fall quickly and test the next support area around 105600 - 105000 points. But for now, I will be watching the 107500 level closely. If you like my analytics you may support me with your like/comment ❤️
Disclaimer: As part of ThinkMarkets’ Influencer Program, I am sponsored to share and publish their charts in my analysis.
Bitcoin: Boundaries of Progression (Dual Aspect)Structure Source
Modification:
Extending fibonacci ratios: x.146 and x.886 to define missing levels (Fibs express probabilistic "layers")
Dual top curves to define boundaries if price continues traveling further up with its distinctive progression.
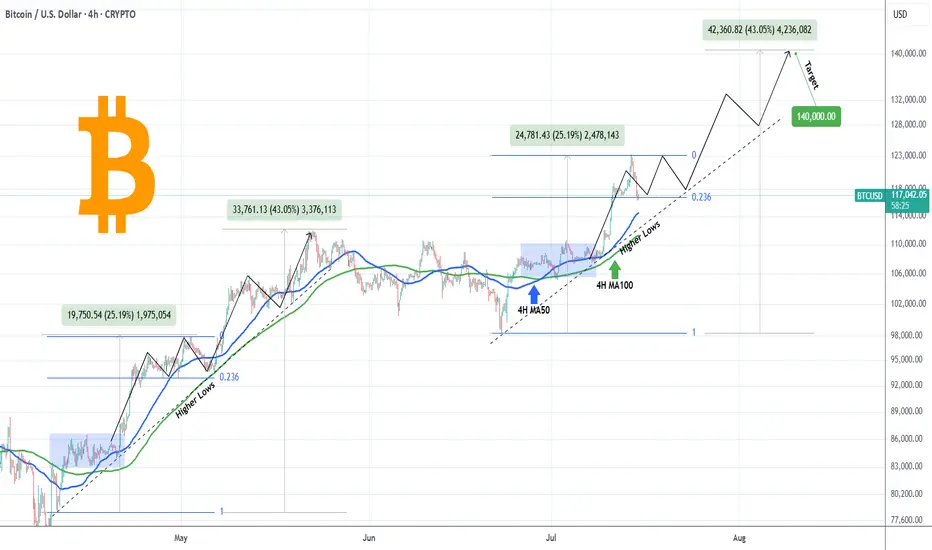
BITCOIN Will it go lower?Bitcoin (BTCUSD) pulled back rather aggressively yesterday after marginally breaking above $123000 and making a new All Time High (ATH).
We've mentioned before the similarities of this Bullish Leg to the April - May structure and so far the current pull-back having already touched the 0.236 Fibonacci retracement level, resembles the late April pull-back.
However, besides the 0.236 Fib, that pull-back also hit its 4H MA50 and rebounded, so that's a condition that hasn't been fulfilled. If it does, we are potentially looking for a Low around the $115k mark. Notice also how both fractals are supported by a Higher Lows trend-line exactly on their respective 4H MA100 (green trend-line) levels.
If BTC continues to replicate this pattern, we expect to see $140000 (+43.05% from the bottom) by early August.
Will the Support levels hold and push it that high? Feel free to let us know in the comments section below!
-------------------------------------------------------------------------------
** Please LIKE 👍, FOLLOW ✅, SHARE 🙌 and COMMENT ✍ if you enjoy this idea! Also share your ideas and charts in the comments section below! This is best way to keep it relevant, support us, keep the content here free and allow the idea to reach as many people as possible. **
-------------------------------------------------------------------------------
💸💸💸💸💸💸
👇 👇 👇 👇 👇 👇
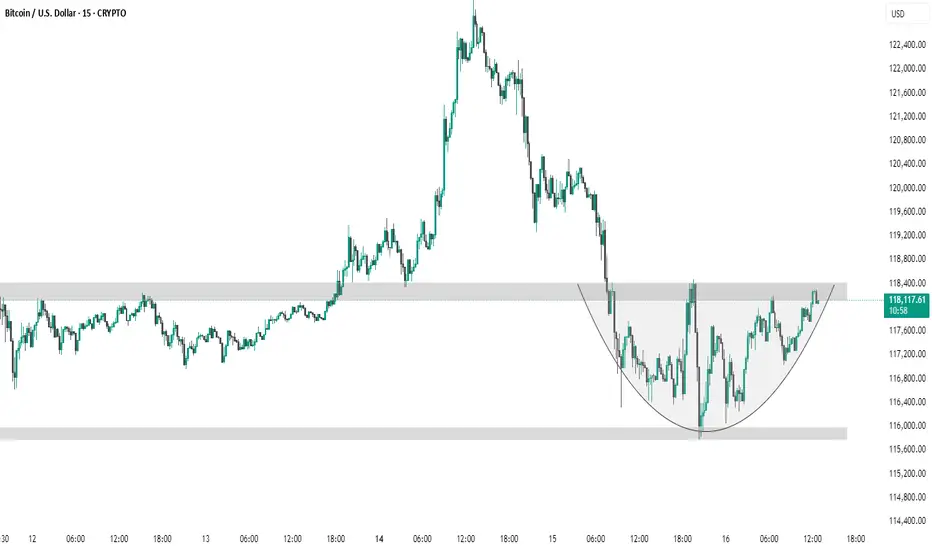
BTC #ARC FormationThe chart **15-minute Bitcoin (BTC/USD)** candlestick pattern with a clearly drawn **cup and handle** or **rounded bottom** formation. Let's identify key levels:
---
🔍 **Key Levels Identified:**
1. **Resistance Zone (Neckline of Cup)**
Level:** \~**118,400 USD**
Significance:** This is the upper gray zone where price has repeatedly been rejected. It's acting as a **resistance** and also forms the **neckline of the cup pattern**. A breakout above this level may indicate bullish continuation.
2. **Support Zone (Bottom of Cup)**
Level:** \~**115,800 – 116,000 USD**
Significance:** This is the **lowest point** in the recent pullback and serves as strong support**. The price rebounded from here to form the cup.
3. **Mid-Level / Breakout Point**
Current Price:** \~**118,067 USD**
Significance:** Price is testing the **resistance**. A candle close and confirmation above 118,400 could trigger a bullish move, possibly targeting previous highs near **121,600 USD** or more.
---
⚠️ Watch For:
Breakout confirmation above 118,400 USD** with volume for bullish continuation.
Rejection at 118,400 USD** could lead to a pullback or handle formation.
Support holding above 116,000 USD** is key to maintain bullish structure.
Let me know if you want price targets or entry/exit suggestions based on this setup.
thank u
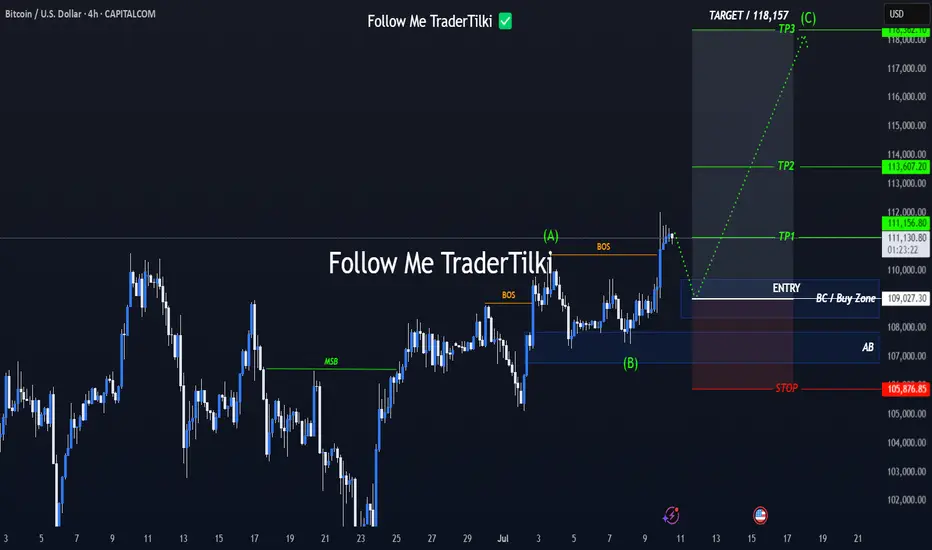
109K Launch Zone? Bitcoin Update Now LiveHey everyone,
Here's my latest Bitcoin analysis for you. The current price action is unfolding within an ABC corrective wave.
🔍 I've identified the optimal buy zone between 108,349 and 109,682.
📉 Once the price pulls back into this range, my limit orders will be triggered and the position will open.
🎯 In this scenario, my target level is 118,157.
Below are the exact levels for my entry, targets, and stop-loss:
- 🟩 Entry Level: 109,027
- 🟥 Stop-Loss: 105,876
- 🎯 TP1: 111,156
- 🎯 TP2: 113,607
- 🎯 TP3: 118,362
- ⚖️ Risk/Reward Ratio: 3.00
(This is based on a swing trade model, so reaching this level may take some time)
--------
Your likes and support are what keep me motivated to share these analyses consistently.
Huge thanks to everyone who shows love and appreciation! 🙏
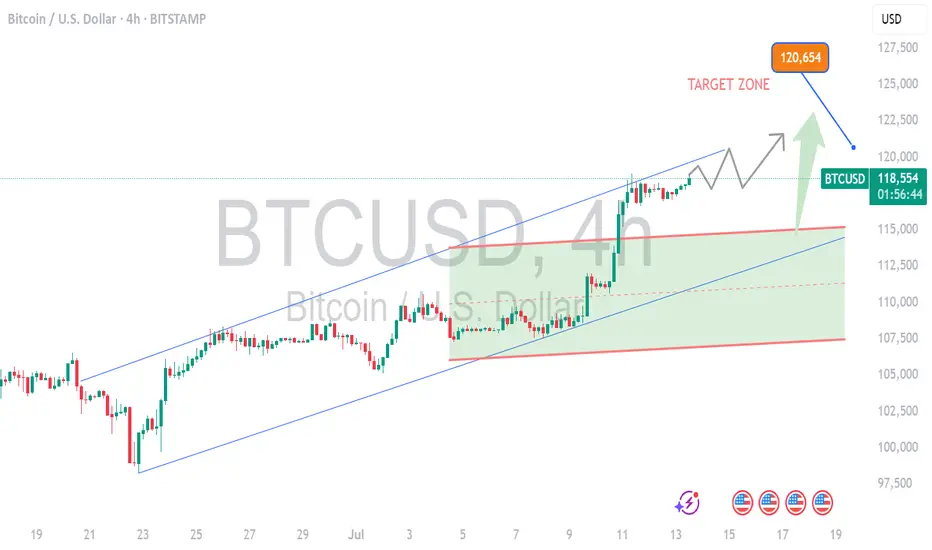
Bitcoin more high opportunity BTCUSD 4H | New Highs in Play
Price has broken structure with strong momentum. A bullish retest near 116,000–116,800 could trigger the next leg up toward the 120,000–121,000 target zone. Watching for price reaction at demand to confirm continuation.