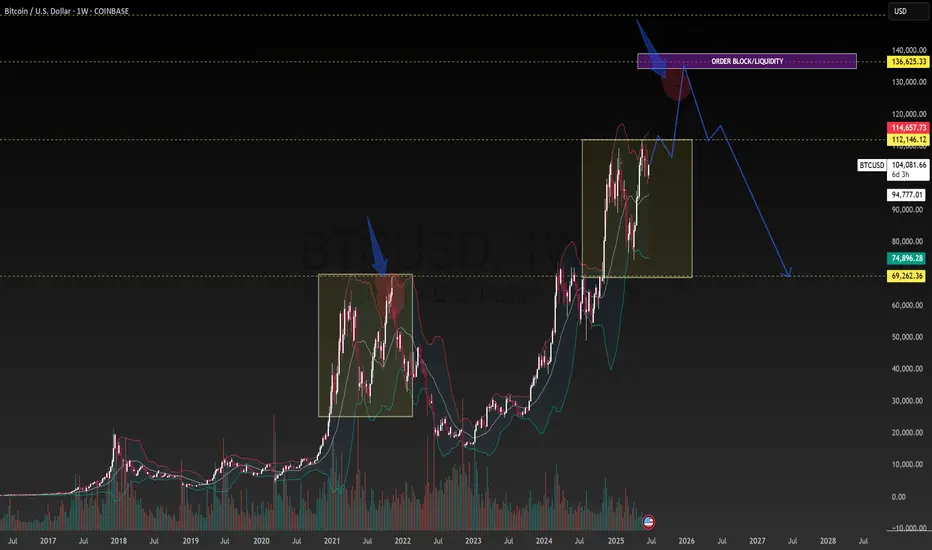
BTC USDT 135k TARGET. BTC USDT going to cross the 135k mark by the year end before cooling off.
HISTORY REPEATS ITSELF.
BITCOIN trade ideas
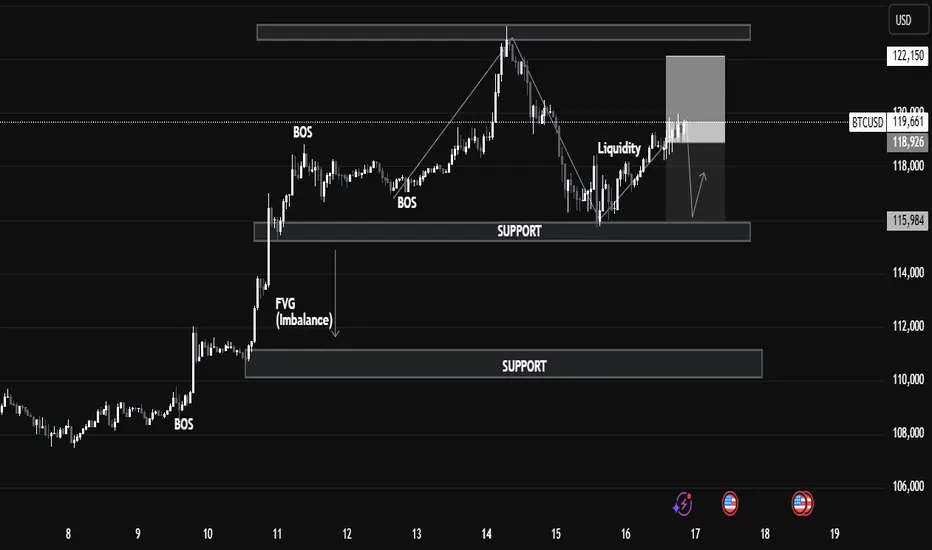
BTCUSD - Smart Money Trap Before the Next Move?1. Market Structure & BOS (Break of Structure):
We can observe multiple BOS levels around July 10–12, signaling a strong bullish transition.
2. Break of Structure (BOS)
Definition: BOS occurs when price breaks above a previous swing high with conviction.
Application on Chart: The BOS on July 11 marked the continuation of bullish market structure.
This indicated strong buying pressure, often driven by institutional order flow.
📉 3. Fair Value Gap (FVG)
Definition: A Fair Value Gap is an inefficiency or imbalance in the market where price moves too quickly, skipping potential orders.
On Chart: The FVG is present between July 11–12.
Expectation: Price often returns to these zones to “rebalance” or mitigate orders before continuing the trend.
Educational Note: FVGs act as magnet zones and are often used to identify entry points or liquidity pools.
💧 4. Liquidity Sweep
Definition: A liquidity grab occurs when price spikes above a recent high or low to trigger stop-loss orders before reversing.
On Chart: Just above resistance, a liquidity grab took place.
Purpose: Institutions often sweep liquidity before large moves to fill larger orders.
🔹 Resistance & Supply Zone:
The resistance area between 122,150–123,500 has held firmly, causing a notable correction.
This region aligns with institutional order blocks, suggesting potential smart money selling.
🔹 Support & Demand Zone:
The nearest support zone lies at 115,984, marked by previous consolidation and BOS.
Price is likely to revisit this zone, acting as a retest for demand re-entry, providing a strong buy-side opportunity if confirmed.
🔹 Current Price Action:
BTC is consolidating around 119,253, with a possible liquidity sweep above short-term highs.
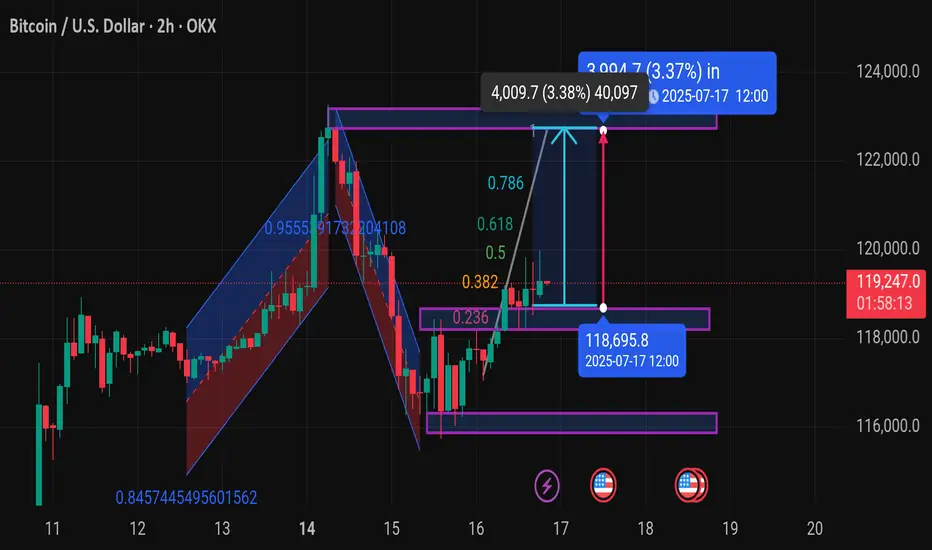
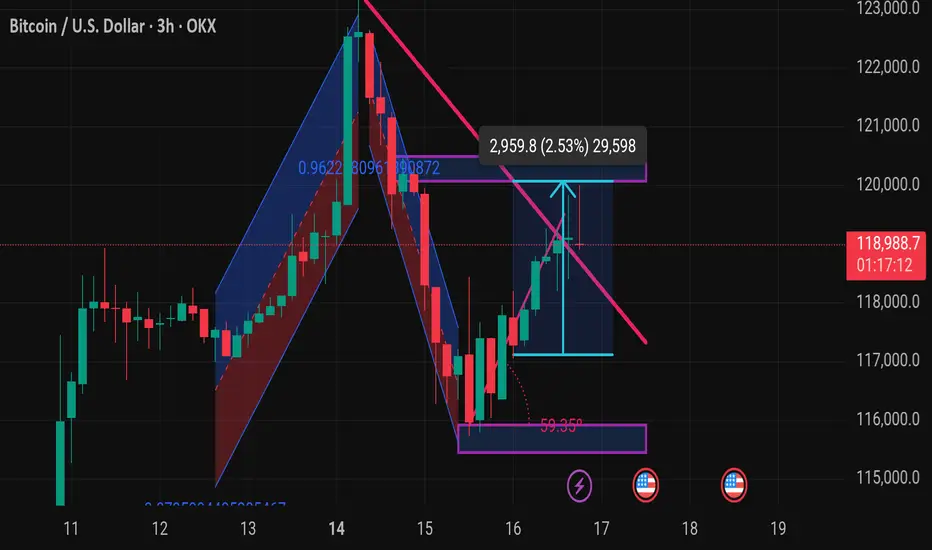
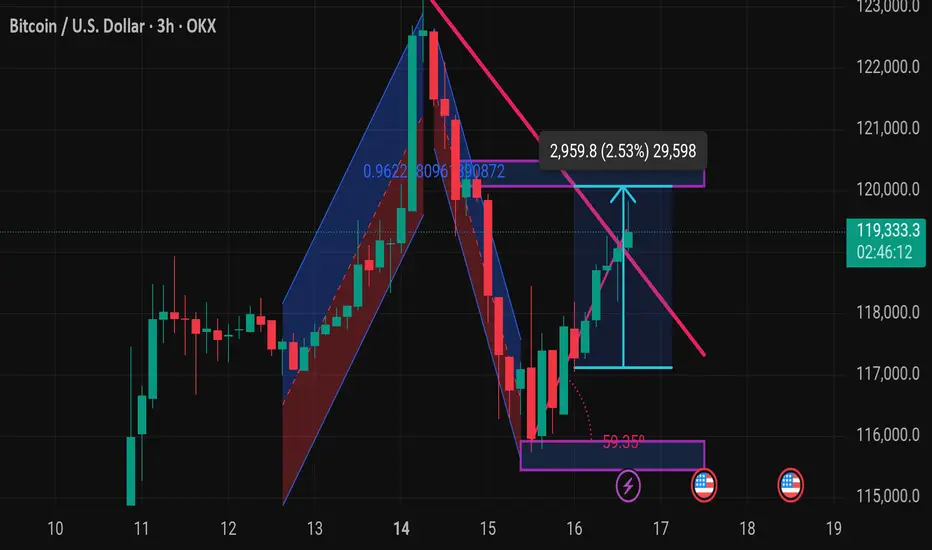
Btcusd techinical analysis.Chart Overview (BTC/USD - 2H, OKX):
Current Price: $119,240.5 (+1.23%)
Key Zones:
Support Zone: Around $118,695.8 (highlighted for July 17, 12:00)
Resistance/Target Zone: Around $123,250 (based on the measured move)
Fibonacci Levels: Drawn from the recent swing high to swing low
Important retracement levels: 0.236, 0.382, 0.5, 0.618, 0.786
Price is currently testing the 0.5–0.618 zone, which is a common area for potential breakout or rejection
Potential Price Move:
Bullish Projection:
Upside target of $4,009.7 (3.38%) from the breakout area
Reaching the $123,250 range by July 17 at 12:00 (UTC)
Technical Patterns:
It looks like you're tracking:
A potential bullish breakout from a consolidation range
Possibly a bullish flag or continuation pattern
Momentum is shifting after a clean bounce off the 0.236 zone
---
Let me know if you want:
A deeper analysis (e.g., RSI, MACD, volume)
Confirmation for long/short entries
Risk management suggestions
What’s your goal here — are you planning to trade this move or just analyzing the pattern?
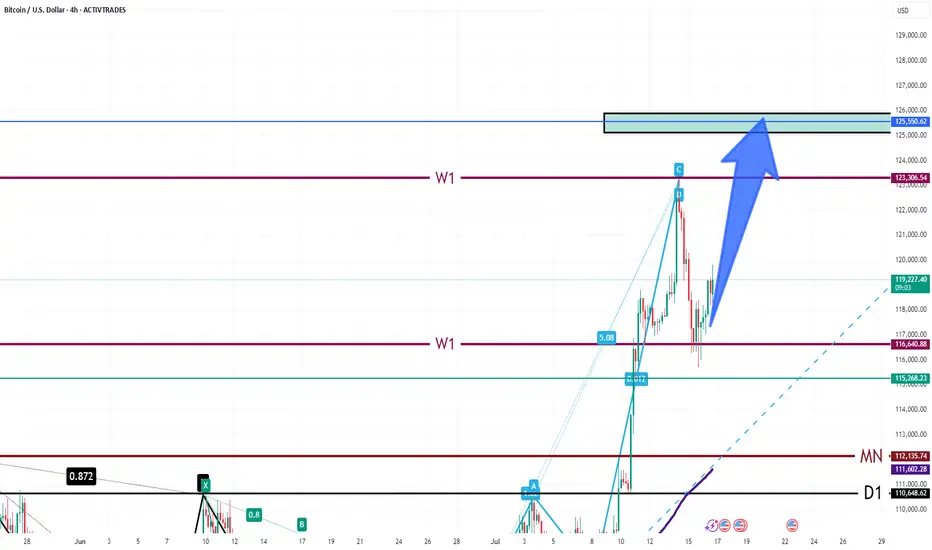
Bullish Correction Complete — Targeting 125,500–126,000Market Overview:
After a strong bullish impulse, BTC retraced to the 116,000–117,000 support area and is now showing renewed momentum. The current price action suggests a move toward the 125,500–126,000 target zone.
Technical Signals & Formations:
— Completed ABC corrective structure
— Weekly support held at 116,000–117,000
— Price bouncing from 144 EMA
— Break above local resistance confirms bullish continuation
Key Levels:
Support: 117,000, 116,000
Resistance: 123,300, 125,500–126,000 (target zone)
Scenario:
Primary: holding above 119,000 opens the way toward 125,500–126,000
Alternative: break below 117,000 could lead to a deeper pullback toward 115,000
BIG ALERT: Stock Market shown a massive break on a TL support. 🚨BIG ALERT: Tech Sector shown a break on a massive TL support level and this news just came out.
We may see everything reverse here pretty soon, depending how the market responds......
CRYPTO may still trend upward and most likely WILL!
- Crypto wins in the end, stay watchful! #BlackChain

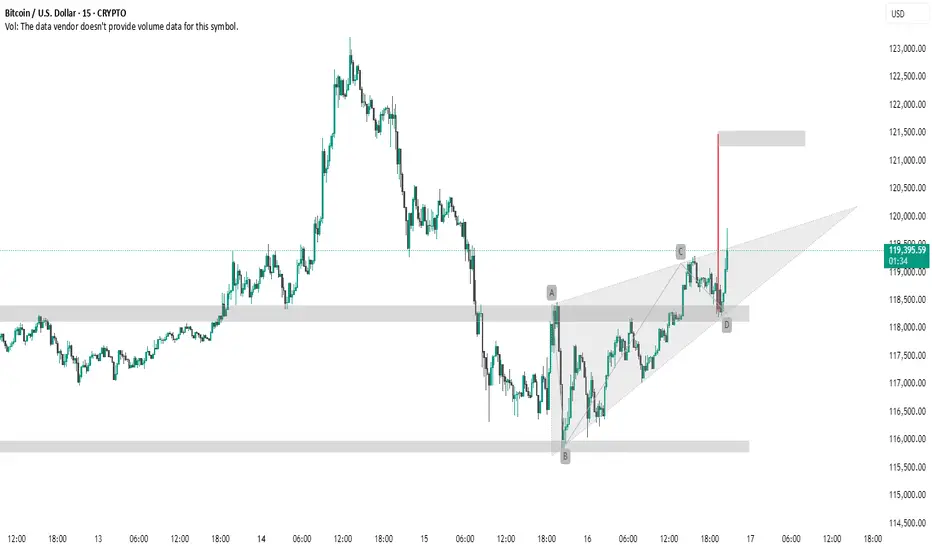
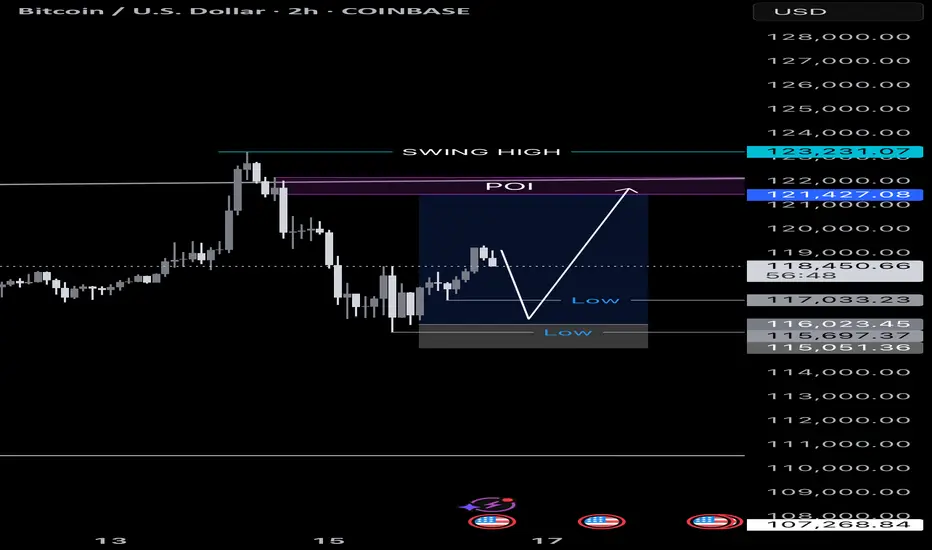
BTC #Trangle BreakoutThis 15-minute BTC/USD chart presents a **bullish breakout** from a **rising wedge pattern**, which typically has bearish connotations but in this case broke upward — suggesting strong buying pressure.
Key Observations:
* **AB=CD Pattern**: The chart shows a completed harmonic AB=CD pattern, typically a **reversal** or **continuation** signal, depending on context.
* **Breakout & Target Zone**: Price broke above the wedge resistance near point D, with a projected target zone around **\$121,500**, shown with the red vertical line and grey box.
* **Support Zones**: Well-defined support areas near **\$118,000** and **\$116,000** provide a strong base for the bullish move.
Summary:
This setup indicates a **bullish continuation** with a breakout from the wedge, validated by the harmonic pattern and volume momentum (if available). Traders may watch for price holding above \$118,000 to confirm continuation toward \$121,500.
thank u
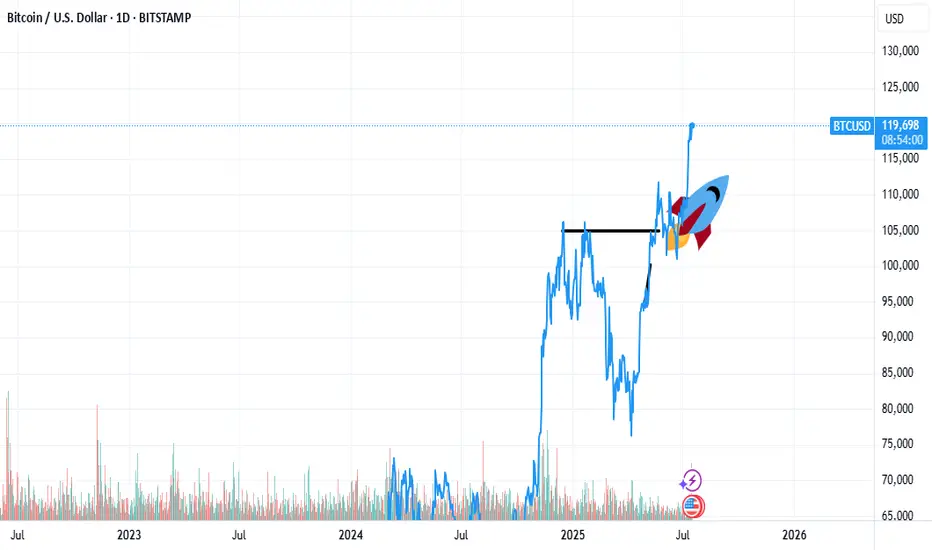
Bitcoin bull runthe $120k bitcoin all time high comes earlier than expected, it looks like our next stop might be $150k by the end of these year
4 Analyses with 100% sensitivityBTCUSD - LTCUSD - ETHUSD - XRPUSD
I suggest that if you want to see the strongest price support in these 4 currencies, check out the analysis I posted for these currencies in the past months.

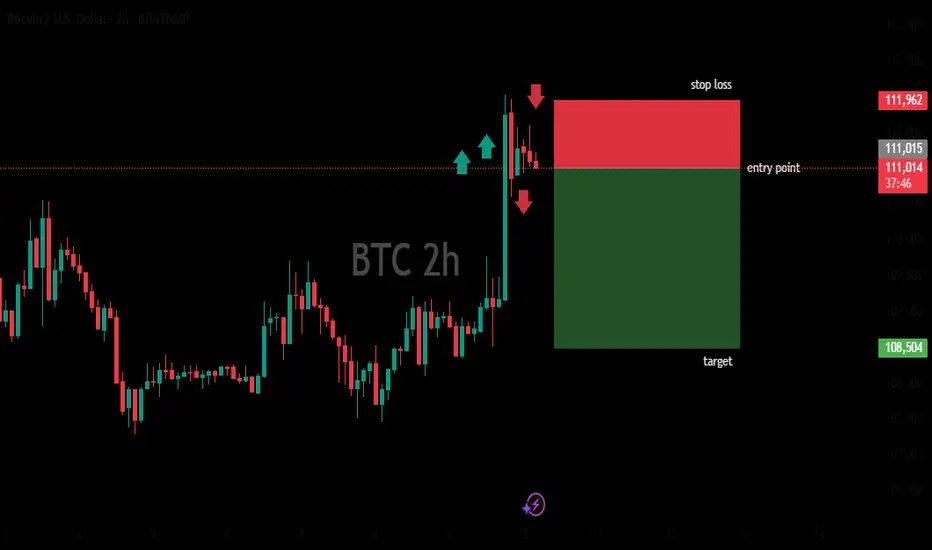
Bitcoin | BTCUSD | SELLSell Bitcoin.
Price reached supply level on 1H, we got confirmation of rejection from 15m.
Take Profit: 111,430
Stop Loss: 120600
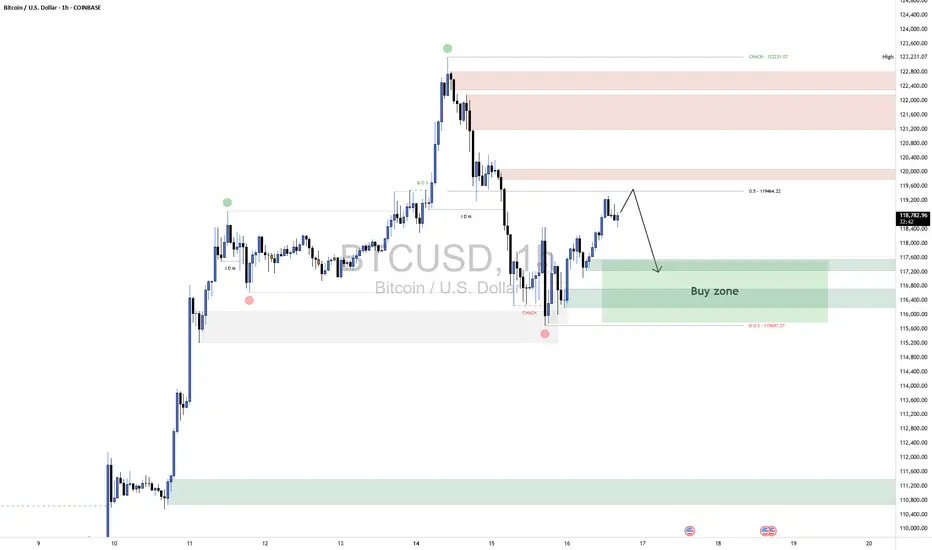
BTC Possible Short-Term Scenario (Long)Sharing my view on the BTC short-term scenario.
Main idea here is to find confluence of the resistance levels using different technicals.

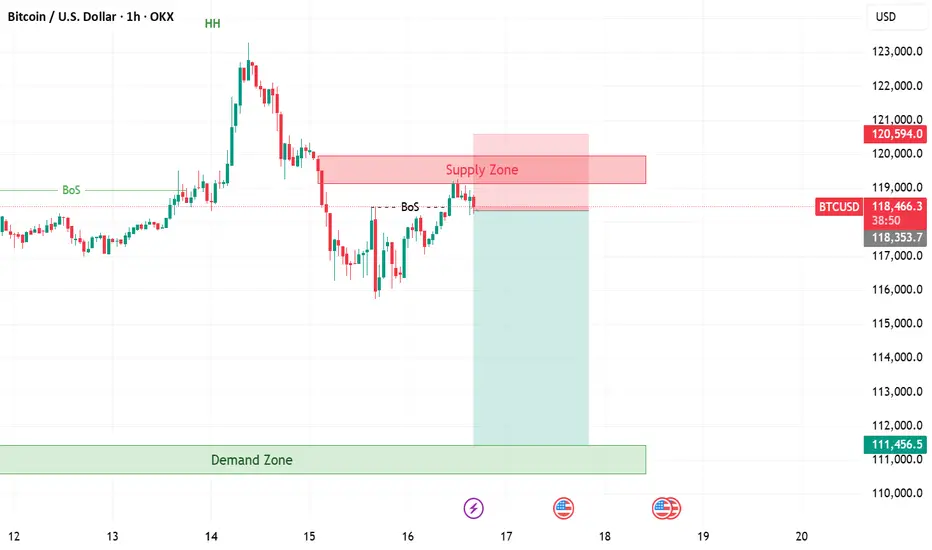
BTCUSD ShortBTCUSD 1H Technical Analysis
⚙️ Scenario Outlook:
Bias: Bearish
Preferred Play: Wait for price to enter the 119,000–120,000 supply zone. If price shows signs of exhaustion or bearish confirmation (e.g. bearish engulfing, strong rejection), a short position becomes favorable.
Targets: First target at 117,200; final target near 115,600–115,000 range, depending on how price behaves within the intermediate demand.
🔼 Supply Zone (Resistance):
Zone: 119,000–120,000
This red zone marks a previously unmitigated supply area aligned with the 50% Fibonacci retracement level from the prior bearish impulse. It's expected to act as the final resistance before the next move lower. A rejection from here would confirm bearish intent and offer optimal risk-to-reward for short setups.
🔽 Demand Zones (Support Targets):
First Demand Zone: 117,200–117,600
This green border is your first liquidity pocket to watch. It may offer a brief reaction or bounce, but if bearish momentum holds, price is likely to continue through it.
Deeper Demand Zone: 115,600–116,200
This is the stronger accumulation area, marked by your lower green zone. It sits just above the previous CHoCH and BOS lows, making it a prime liquidity sweep and reversal candidate if price moves deeply into it.
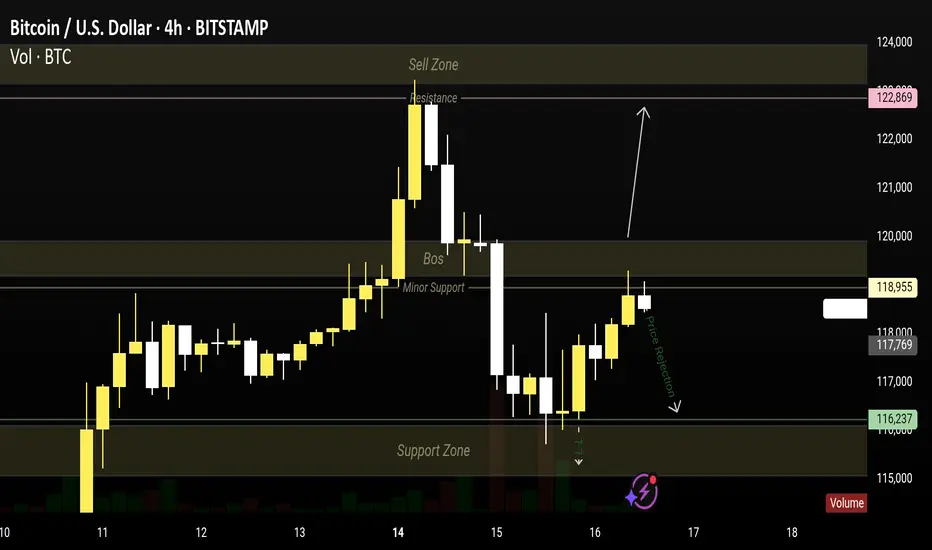
KOG BTC 4H chart updates.
KOG BTC 4H CHART
🔹 Sell Zone: 122,869
🔸 Resistance Holding Strong!
🔻 Price Rejected from 118,955 Minor Support
• Watch for pullback toward 116,237 Support Zone
• Possible BOS retest before next move
• If breaks → watch for continuation to 115,000
• If holds → bullish bounce possible
• Volume spike confirms reaction level.
Bitcoin short term moveBTCUSDT
We have swept highs and also swept lows.
Now price is in a minor uptrend.
We can pump from here immediately
Or
Retest 0.718 fib then pump.
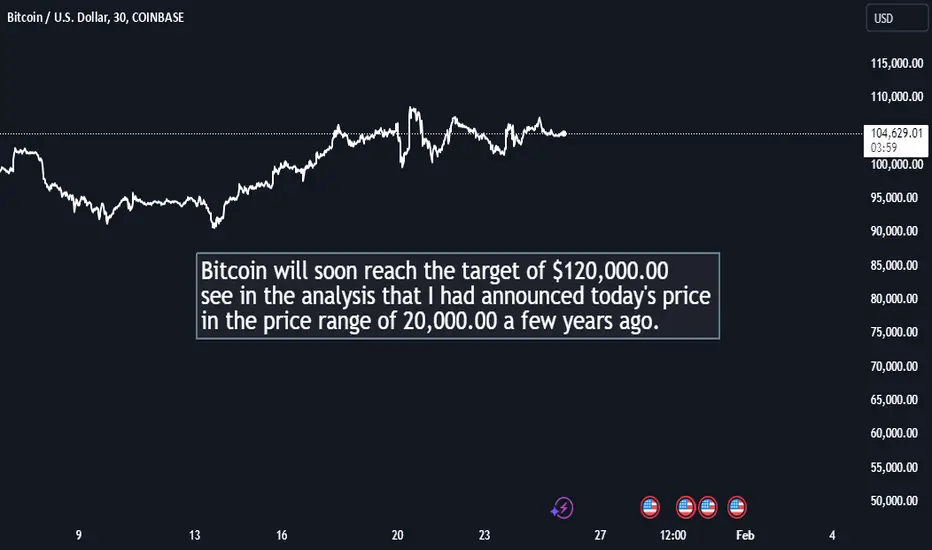
Bitcoin $120,000.00 Bitcoin will soon reach the target of $120,000.00, see in the analysis that I had announced today's price in the price range of 20,000.00 a few years ago.
Sasha Charkhchian
Whales Impact on BTC and XRP MarketsKey Points:
Whales drive market dynamics, focusing on BTC, ETH, XRP.
Whales influence price movements and trader behavior.
Institutional inflows increase, spotlighting large-cap assets.
Whale activities have drawn attention due to their potential to alter market dynamics, indicating possible price shifts and investment strategies for traders.
Recent Influences of Whale Activity on Cryptocurrency Markets
Recent whale activity has driven interest in Bitcoin and XRP, as whales accumulate assets, influencing market trends. Abdullah “Abs” Nassif emphasized the strategic importance of holding, advising caution.
"If you hold it and play the game like we do, you have a chance at freeing people around the world from the debt slavery system. I can promise you that." - Abdullah “Abs” Nassif, Host, Good Morning Crypto
Financial markets are adapting, with noticeable movements in cryptocurrency prices due to whales' actions. Their accumulation signals rising confidence, especially in Bitcoin, which hit a new all-time high.
BTC's surge influenced the broader market, encouraging capital flow into large-cap assets. These movements reflect potential shifts in trader strategies, highlighting the impact of significant investments.
Insiders suggest regulatory developments may affect prices, yet whale activity implies potential long-term growth. Historical patterns highlight institutional investors' stability during volatile periods, underscoring the strategic value of holding as exhibited by these whales.
Plan on bracing yourself for Monday most likely. That's when we'll really see the test as to whether crypto can maintain the momentum. OKX:BTCUSD BITFINEX:BTCUSD BITFINEX:BTCUSD OANDA:BTCUSD
10 Types of Cryptocurrencies: Explanations and ExamplesCryptocurrencies go far beyond Bitcoin. Today’s digital asset market includes a wide variety of coins and tokens, each serving distinct purposes. Below are 10 key categories of cryptocurrencies with brief explanations and examples:
Store of Value Cryptocurrencies:
Used as a digital form of gold or a long-term value reserve.
▶ Example: Bitcoin (BTC)
Smart Contract Platforms:
Support decentralized applications and programmable transactions.
▶ Example: Ethereum (ETH)
Stablecoins:
Pegged to fiat currencies to reduce volatility.
▶ Examples: USDT, USDC
Payment Tokens:
Designed for fast, low-cost money transfers.
▶ Examples: XRP, Stellar (XLM)
Governance Tokens:
Allow holders to vote on protocol decisions.
▶ Examples: UNI, MKR
Meme Coins:
Inspired by internet culture and social trends.
▶ Examples: Dogecoin (DOGE), Shiba Inu (SHIB)
Gaming Tokens:
Used in blockchain-based games and metaverses.
▶ Examples: AXS, SAND
Privacy Coins:
Focused on anonymous, untraceable transactions.
▶ Examples: Monero (XMR), Zcash (ZEC)
NFT Tokens:
Represent digital collectibles or assets on-chain.
▶ Examples: Bored Ape, CryptoPunks (ERC-721)
Infrastructure Tokens:
Power scalability, cross-chain solutions, or protocols.
▶ Examples: Polkadot (DOT), Cosmos (ATOM)
Understanding these categories helps investors and users navigate the complex crypto ecosystem more effectively.

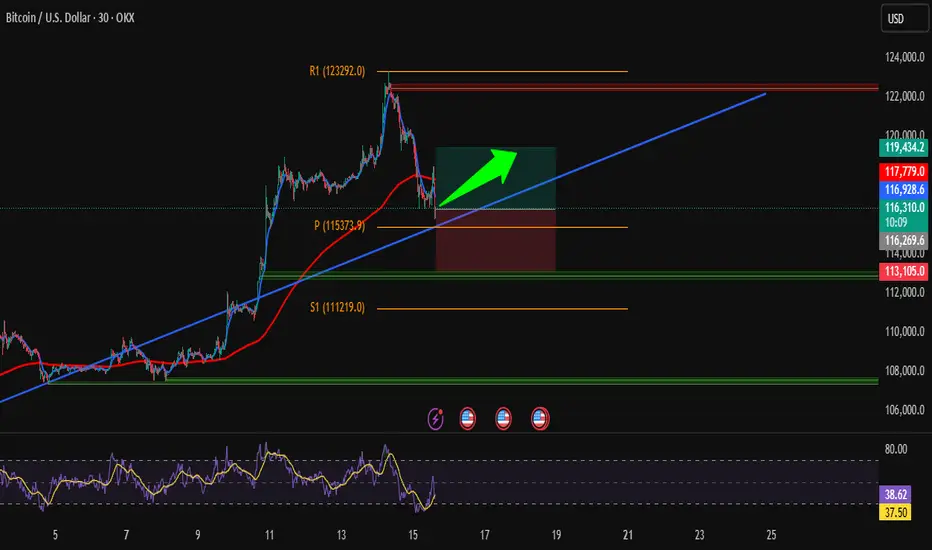
Clean BTC Trade – Bounce from Key Trendline SupportHi traders! , Analyzing BTC/USD on the 30-minute timeframe, we can observe that price is respecting the ascending channel and reacting to the dynamic trendline support (blue line). This bounce, aligned with prior structure, signals a potential bullish continuation.
🔹 Entry: 116,249
🔹 Take Profit (TP): 119,434
🔹 Stop Loss (SL): 113,105
Price remains above the 200 EMA while continuing to respect the ascending trendline, signaling sustained bullish structure. The RSI is showing a bullish divergence, which supports the idea of upward momentum. We also saw a strong reaction at the pivot point (115,373), and a bullish engulfing candle formed right near the trendline — adding further confirmation to this potential long setup.
This long setup presents a favorable risk/reward ratio within the context of the broader trend. Targeting a clean break above previous resistance and return to the R1 zone.
⚠️ DISCLAIMER: This is not financial advice. Trade at your own risk and always use proper risk management
btc 2hours bearish analysisThe image shows a computer screen displaying a Bitcoin price chart on the TradingView platform. The chart is set to a 2-hour time frame and shows the price of Bitcoin in US dollars. The chart has several indicators and annotations, including a stop loss, entry point, and target price.
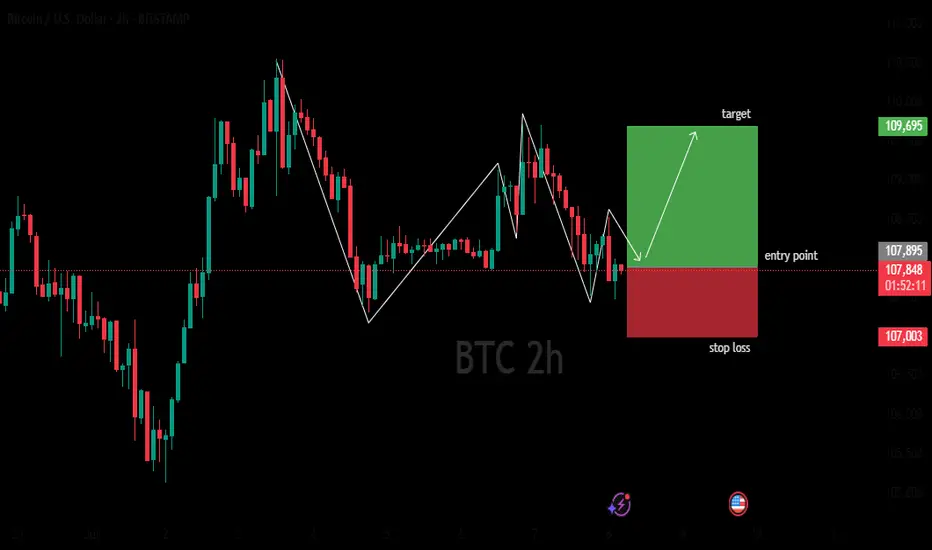
BTC 2HOURS BULISH ANALYSISThe image shows a computer screen displaying a Bitcoin trading chart on the TradingView website. The chart is titled "BTCUSD" and features a 2-hour time frame, with a black background and white text. The chart displays a downward trend, with red and green bars indicating price movements.
Global Market Overview | July 15President Trump’s latest statements made headlines again, but market reactions have become more measured. The Dow declined slightly, while Asian markets presented mixed performances; Japan remained flat, Korea and Australia posted losses, and Taiwan outperformed. The US dollar strengthened as the yen weakened. Bitcoin recovered near $118,000 after dropping from its $123,000 high. Silver held firm above $38.
Today, market focus turns to U.S. PPI data and key bank earnings reports.
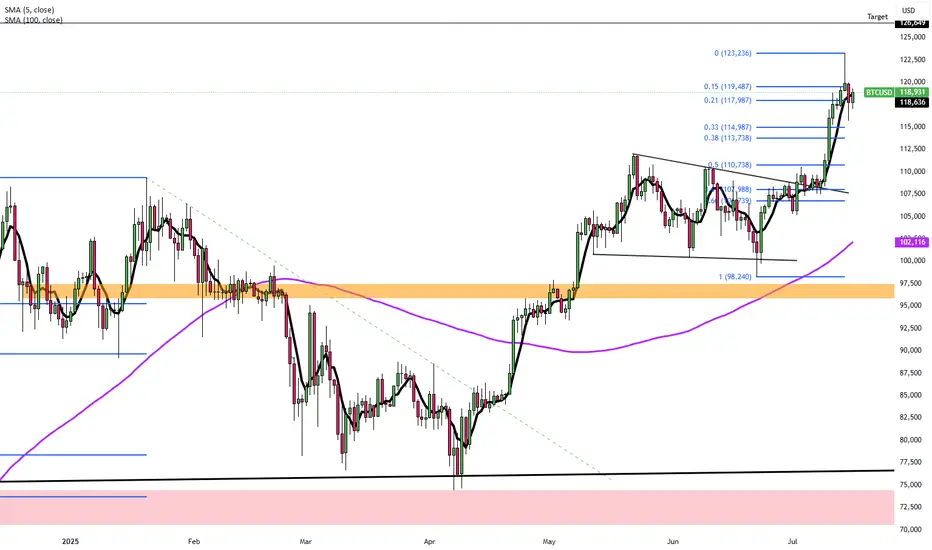
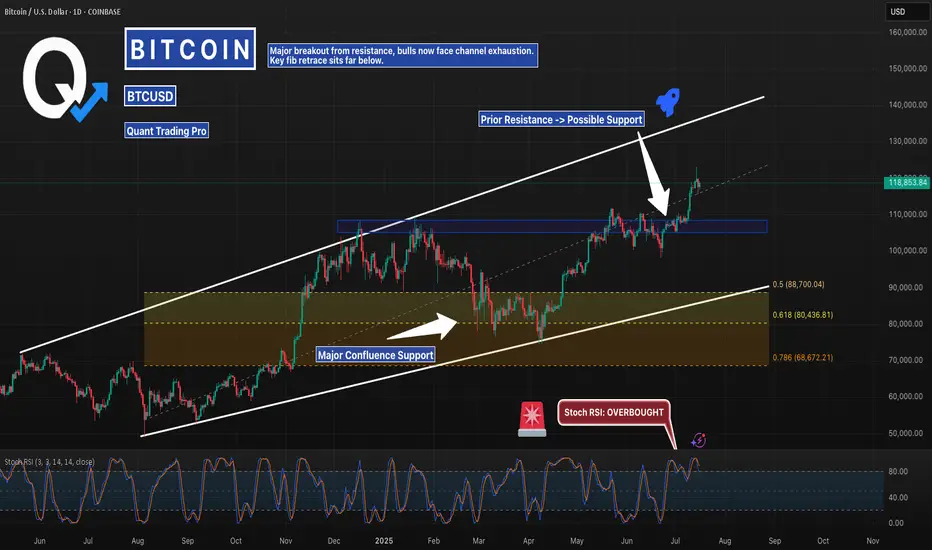
BTCUSD - Breakout Or Bull Trap? Watching the Fib Reload ZoneBitcoin just cleared the prior resistance zone near 114K–115K, breaking higher within the macro ascending channel. But with Stoch RSI overheated and price stretching toward the upper trendline, this move may exhaust soon.
I’m watching the Fib confluence zone between 88K–80K — which aligns with the mid-channel and prior breakout structure. If bulls lose steam, that’s where the real bid could return.
Set alerts. Let the algo hunters chase.
This is where smart traders prepare.
#BTCUSD #Bitcoin #Crypto #PriceAction #Fibonacci #SmartMoney #Backtesting #QuantTradingPro #TradingView