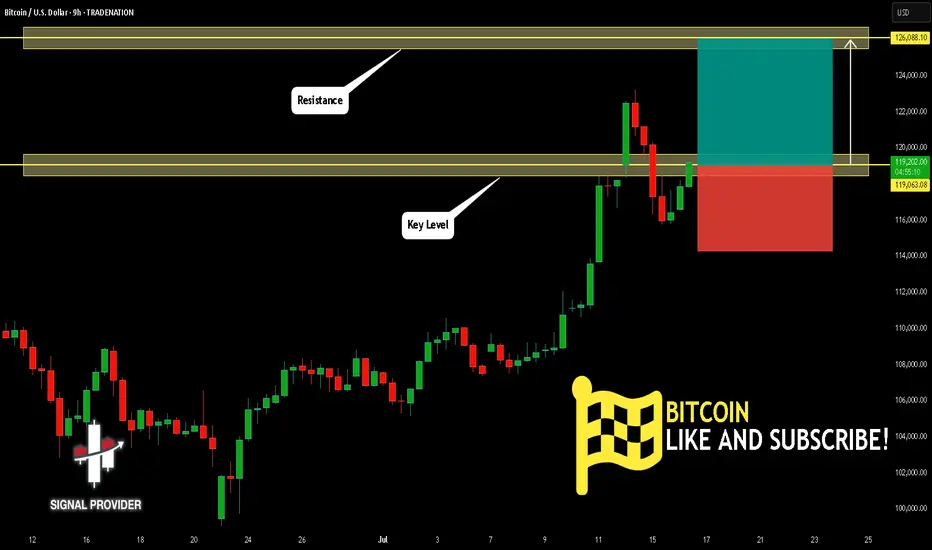
BITCOIN Will Go Higher! Long!
Here is our detailed technical review for BITCOIN.
Time Frame: 9h
Current Trend: Bullish
Sentiment: Oversold (based on 7-period RSI)
Forecast: Bullish
The market is trading around a solid horizontal structure 119,063.08.
The above observations make me that the market will inevitably achieve 126,088.10 level.
P.S
Overbought describes a period of time where there has been a significant and consistent upward move in price over a period of time without much pullback.
Disclosure: I am part of Trade Nation's Influencer program and receive a monthly fee for using their TradingView charts in my analysis.
Like and subscribe and comment my ideas if you enjoy them!
BITCOIN trade ideas
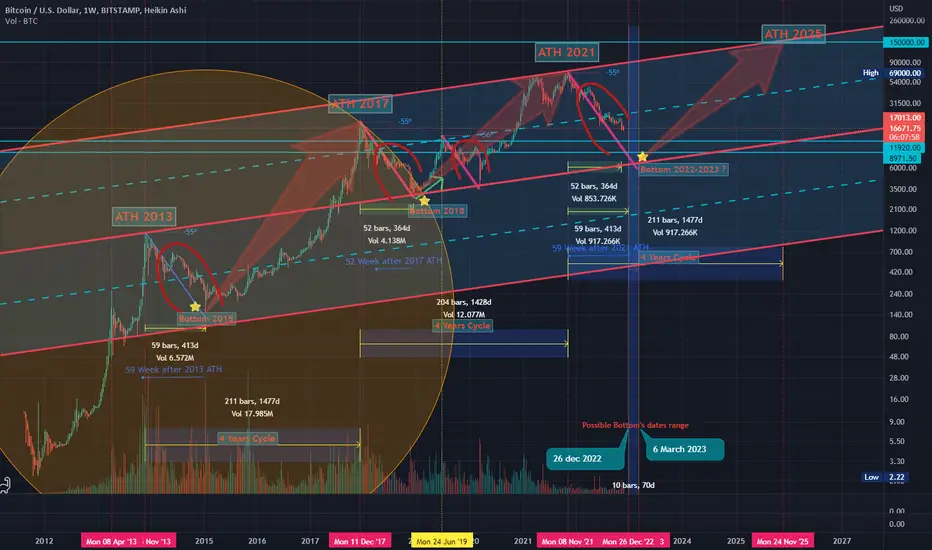
BTC Bottom & New ATH..... when ?!!! Hello Guys
There are some notes of BTC weekly Chart:
1. We have a new ATH every 4 years ( 1428-1477 ) days..
2. After the ATH we take about ( 52-59 ) weeks to make a new bottom then we go up a little ...
3. Every time we reach a new ATH we drop down in a same angle (-55) before the new bull run starting .... look at my chart ( Red angles and curves ):
****** We dropped from ATH 2013 to Bottom 2015 by an angle ( -55 ) .
****** We dropped from ATH 2017 to Bottom 2018 by an angle ( -55 ) .
****** Same (24 July 2019) we dropped from local top to the local bottom by Angle ( -56 ) .
****** Will we drop from ATH 2021 to Bottom (2022 - 2023) by the same angle ( -55 or -56 )??
4. In my opinion , I expect we will reach the final bottom between ( 26 December 2022 : 6 march 2023 ).
5. I don't care what will be the price of BTC then , but I care only for when will be the possible bottom !!.
But if we can try to expect the price it will be in a range of ( 11900 : 9000$) ...
Note:( 10K - 10500$) is very very strong demand area for BTC .
-------------------------------------------------------------------------------------------------------------------------------------------------------------------------------------------------------
Finally , I think the new ATH will not be before Nov 2025 ( 150k $ ).
It is not a financial advice , I am only share my thoughts with u :)
Thank u and good luck.
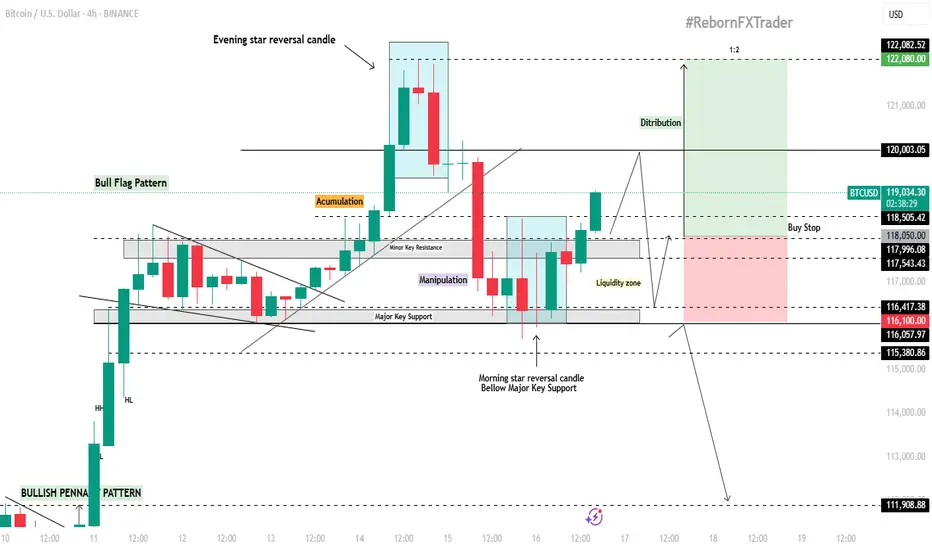
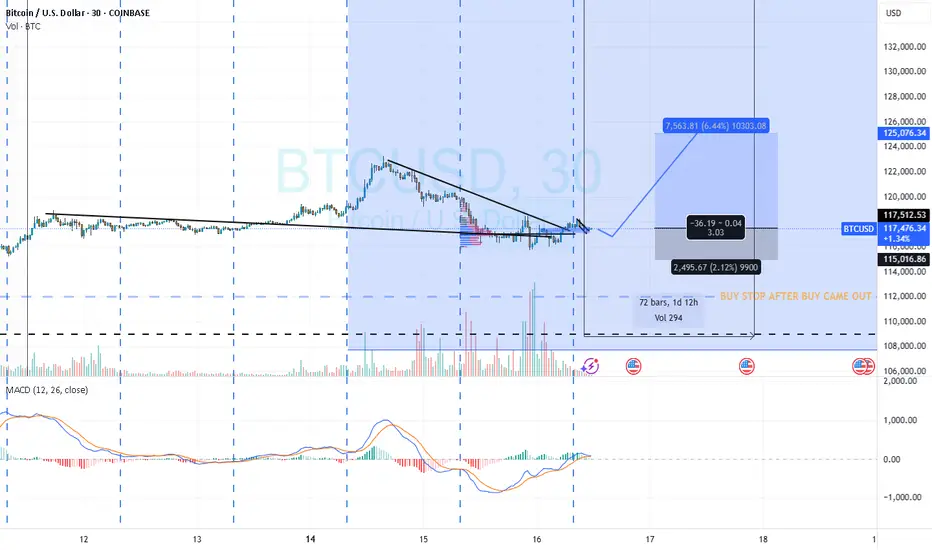
BTC/USD 4H Technical & Fundamental AnalysisBTC/USD 4H Technical & Fundamental Analysis
Bitcoin remains fundamentally bullish as institutional adoption continues to rise through Spot ETF inflows, while post-halving supply pressure tightens the available BTC in circulation. Additionally, the upcoming regulatory clarity such as the GENIUS Act could pave the way for major institutions like JPMorgan to issue their own stablecoins, further bridging the gap between crypto and traditional finance. On the technical side, BTC is currently consolidating around the 116,200 level, potentially forming a bull flag pattern on the 4H timeframe. This zone has acted as a major support level due to multiple historical touches.
Previously, price reached an all-time high around 122,000 before forming an Evening Star reversal pattern, leading to a pullback back to the 116,200 zone. A Morning Star reversal then formed on this key support, suggesting renewed bullish momentum.
Our current objective is to wait for price to climb toward the 120,000 level, where we anticipate a potential liquidity grab within the highlighted liquidity zone.
📍Buy Stop Setup:
Buy Stop Entry (AOI): Around 118,050
Stop Loss: 116,100 (below liquidity zone)
Take Profit: 122,080
📌 Disclaimer:
This is not financial advice. Always wait for proper confirmation before executing trades. Manage risk wisely and trade what you see—not what you feel.
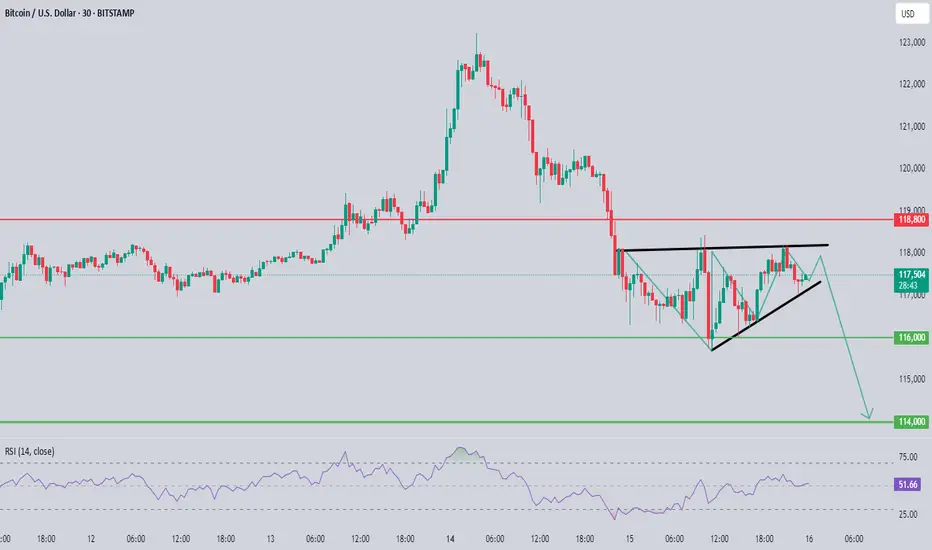
XAU/USD Chart Pattern ObservedBased on the image you've shared, this is a technical analysis chart for gold (XAU/USD), with a visible bearish setup in play. Here’s a detailed sell-side analysis:
Chart Pattern Observed
Bearish Pennant/Wedge Breakout:
The price appears to be breaking out downward from a rising wedge or bearish pennant pattern.
These patterns typically indicate a continuation to the downside after a short consolidation or pullback.
Key Levels Identified
Resistance Zone:
118.800 (Strong resistance level marked in red)
Price failed to break above this and reversed, confirming it as a solid supply zone.
Current Price: Around 117.500
Support Levels (Take Profit Targets):
116.000 – Minor support/first TP level
114.000 – Major support/final TP level (likely the full target of the move)
RSI Indicator
RSI at 50.71 – neutral but pointing slightly downward.
This gives room for further bearish momentum to unfold.
Sell Trade Setup
Entry: After confirmed break below the rising trendline (around 117.800 - 117.500)
Stop Loss: Above 118.800 (just above the resistance zone to avoid fakeouts)
Take Profits:
TP1: 116.000
TP2: 114.000
Trade Justification
Clear lower highs forming.
Rejection at strong resistance.
Breakdown of rising structure = bearish continuation.
Bearish projection arrows on chart suggest institutional outlook favors sell.
Risk Management
Use proper lot sizing based on your account balance and risk %.
Look for a retest of the trendline as a safer sell entry if missed the initial break.
BTC? intra
Hi
Looking ready for next round for upside.
Are you still bullish?
I see yest was accumulation.
If today is a bullish day. Later we'll see prints of 118500 above.
If not.. 116800 is not a good print.
All the best.
Not a guru
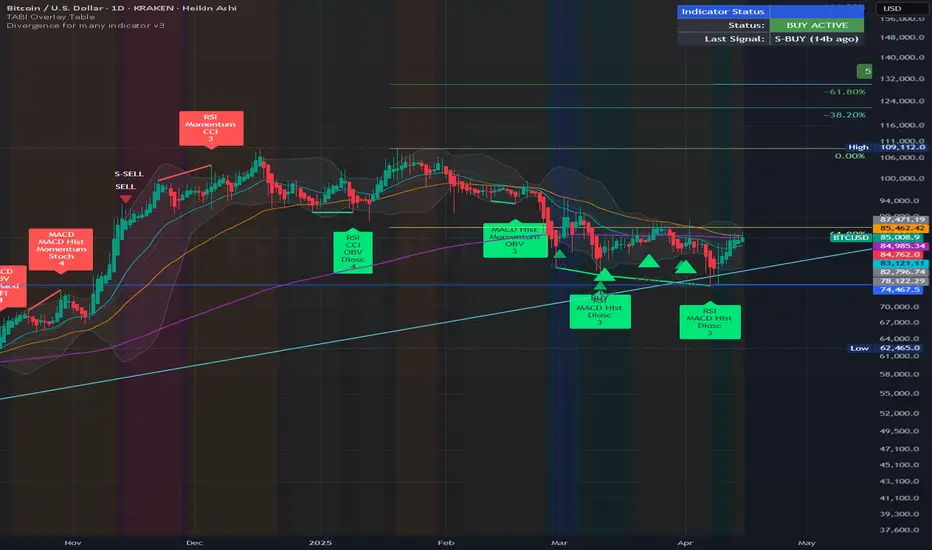
BTC – Strong Buy Signals, Sentiment Reversing, Final Push?BTC is clearly in a place of rising trust
- Fear & Greed Index improving: last week 24 (Extreme Fear), yesterday 31, now 38 (Fear), last month low was 3
- Several bullish divergences visible: RSI and MACD show higher lows vs. price, momentum indicators curling up, OBV ticking higher despite weak price action
- Price is sitting at the lower Bollinger Band and holding an ascending trendline
- Multi-indicator (mostly RSI-based) showing clustered buy signals, similar to previous rallies
- Simple Fibonacci retracement from the recent high (~73K) shows potential move toward 130K, assuming continuation and break above ~109K
- Last S-BUY signal was 14 bars ago, still active
- Structure is clean and holding
- If this is the final leg up, we could be entering danger or euphoria territory soon
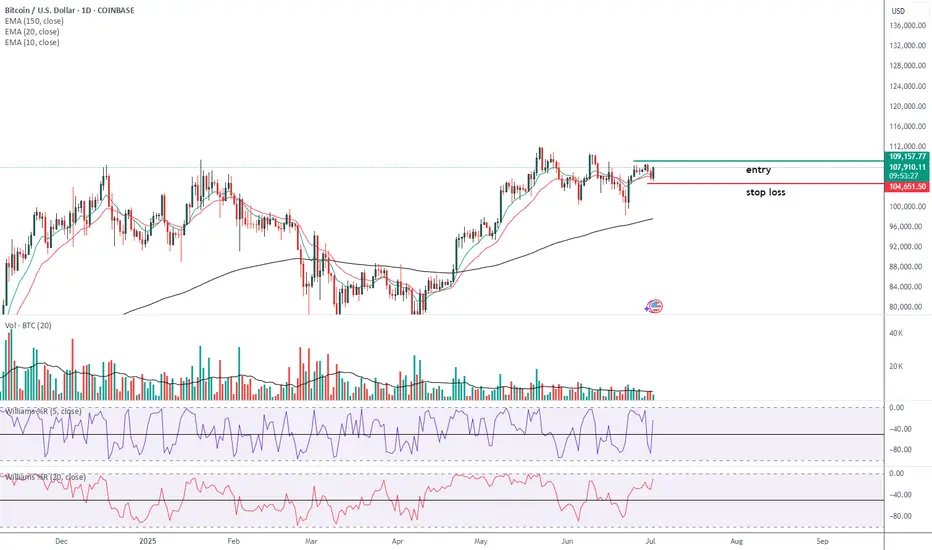
BTC Heading DownThis is my first chart using TradingView. I'm 50/50 on how I feel about it's utility, but it does well enough until I learn it better. I use the D Timeframe too look for support/resistance. I focus in on the 4h, then 1h further. I have recently switched from lower timeframes to higher timeframes with some surprising success following my rules. Constructive Criticism/Dialogue welcomed.
It is time for a reversal. Why? Those ATHs were just hit after two bullish runs for 2025 (Jan and July). Granted it would be hopeful for all investors to keep seeing this beast rip for a 3rd time in 2025, that is a dream, I think. There has been two runs then consolidation/pullbacks, NORMALLY (see hollow boxes on chart). This does not mean this is the case, but this is what I am going with after researching. After the ATH, a lovely wick and an incredibly high volume on an engulfing candle formed. This along with a PSAR switch on the 4H is what I utilize. I have only researched down to $102k. Each TP (blue line), I will be looking for a sign of reversal on the 4h.
Key:
Blue lines:
- My TP
Boxes:
- Areas of Interest
Hollow Boxes only:
- Shows two runs before a consolidation to an official breakout
Highlights:
- What within that area of interest I'm using for justification
Orange lines:
- Where in the past BTC has had breakouts then a retest before the next breakout
Red line:
- My SL
Enjoy your BTC,
AtlasRising
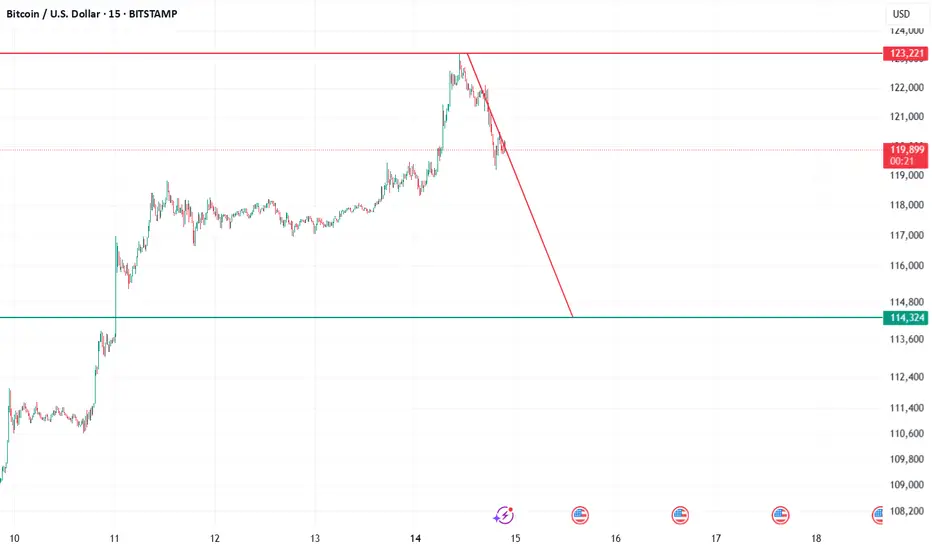
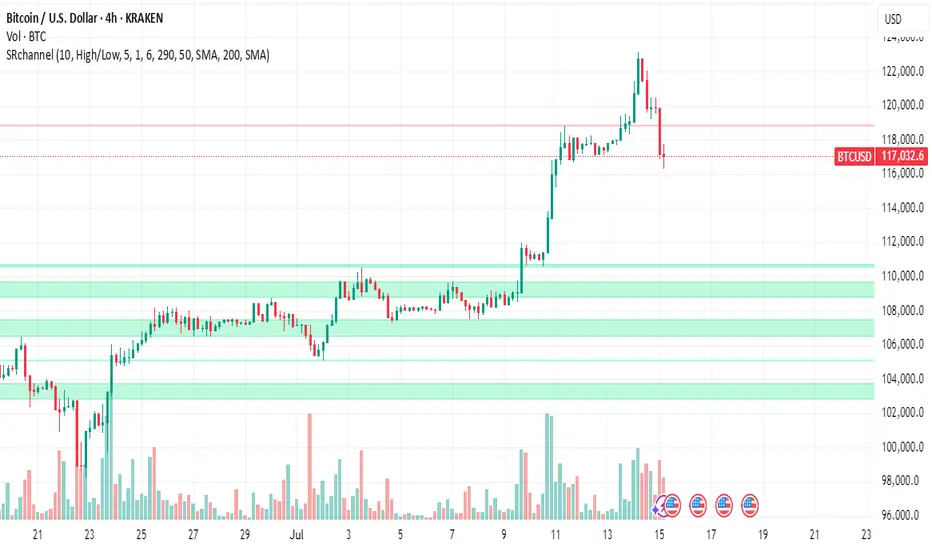
BTC SHORT FOR NOW?An all time high was achieved recently at around 123k USD. A number of buyers should potentially be liquidating their profits around this region, reducing buy pressure and ultimately leading to a short term pull back maybe close to around the 110's? Price action will have to reveal more information in order to see what happens after this movement.
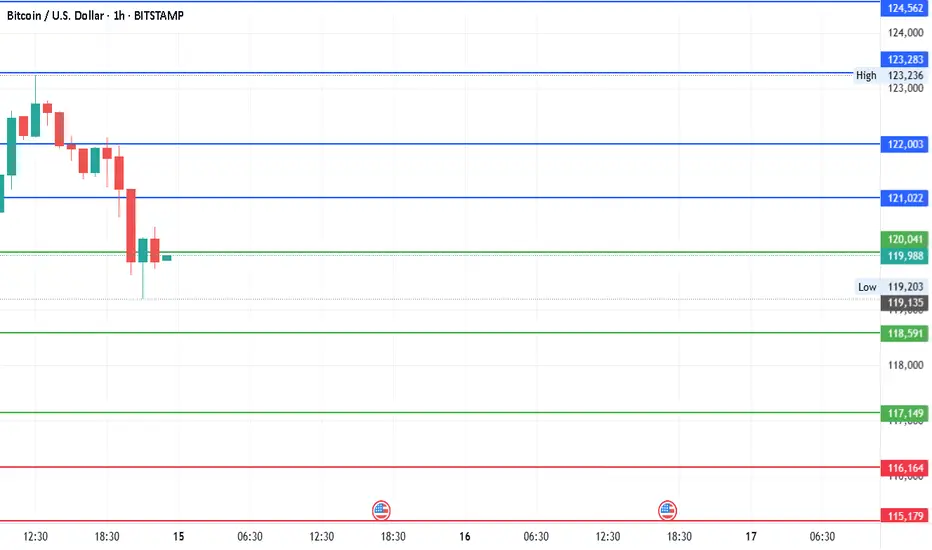
#Bitcoin - Levels to watchDate: 14-07-2025
#Bitcoin
Current Price: 119900
Pivot Point: 118591.00 Support: 117149.31 Resistance: 120041.22
Upside Targets:
Target 1: 121022.11
Target 2: 122003.00
Target 3: 123282.50
Target 4: 124562.00
Downside Targets:
Target 1: 116164.16
Target 2: 115179.00
Target 3: 113899.50
Target 4: 112620.00
#Crypto #Bitcoin #BTC #CryptoTA #TradingView #PivotPoints #SupportResistance
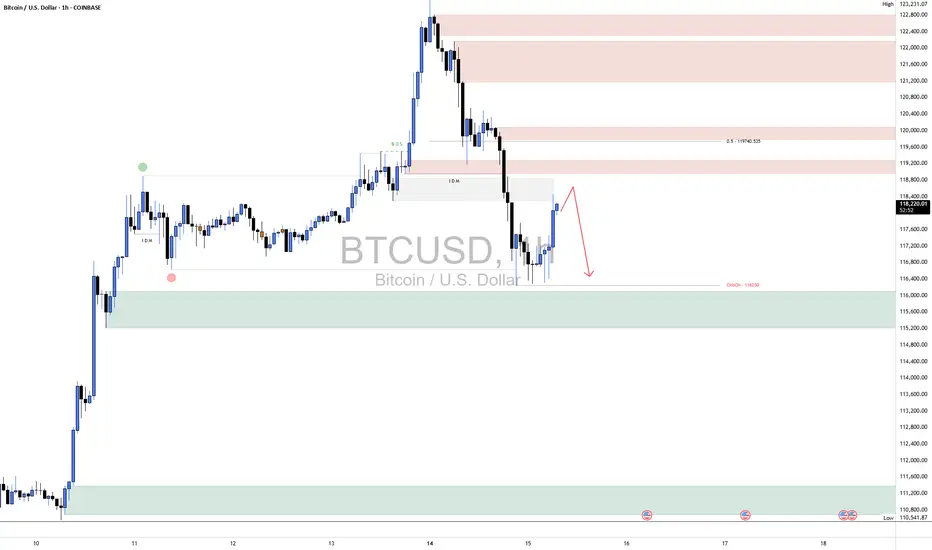
BTC ShortBTC has shown some short-term bullish signs, with a corrective bounce from the demand zone around 116,000–115,000, indicating a temporary reaction from buyers. However, this move appears to be a retracement rather than a full reversal, as the overall structure remains bearish.
Price is currently pushing into a previously broken intraday supply zone and approaching the 50% equilibrium level near 119,000, which aligns with a potential lower high forming. As long as BTC stays below this key level and fails to break market structure to the upside, the bias remains bearish.
We still believe BTC is likely to come back down to retest the recent lows, possibly revisiting the 116,000 zone to sweep more liquidity before any meaningful reversal can occur.
As always, proper risk management is essential. Wait for confirmation before entering trades and protect your capital in these volatile conditions.
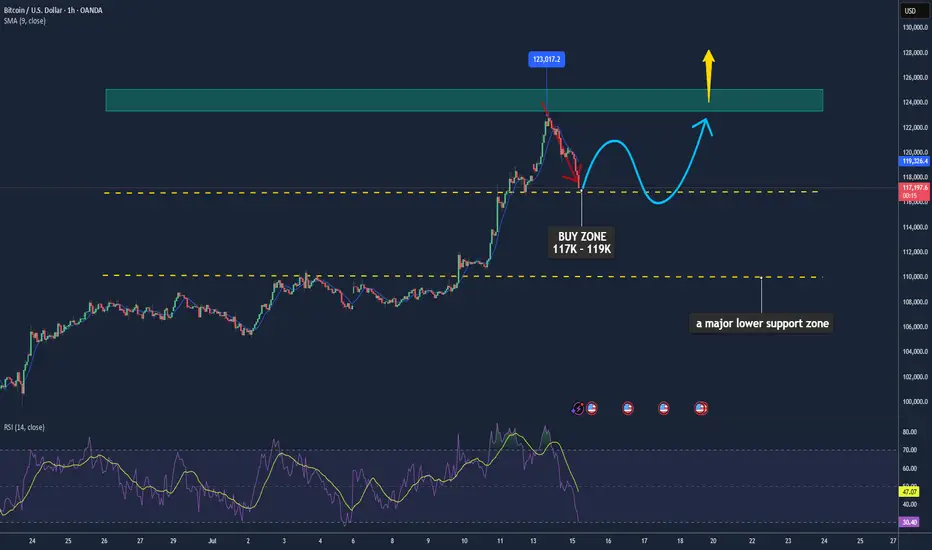
Bitcoin May Pause After Recent Highs📊 Market Move:
Bitcoin (BTC) recently touched an intraday high of ~$122.8K after hitting new all-time highs, supported by a weaker USD, strong institutional inflows, and favorable U.S. regulatory developments (e.g., GENIUS Stablecoin Act, CLARITY Act, and Trump’s executive orders). However, rising volatility (DVOL) and a rebounding USD are signaling a possible short-term correction.
📉 Technical Analysis:
• Key Resistance: ~$123K–$125K
• Nearest Support: ~$117K (with $110K as a major lower support zone)
• EMA: Price is currently above the 9-day EMA → short-term trend remains bullish.
• Candlestick / Volume / Momentum:
• A cup-and-handle formation has emerged, typically a bullish continuation pattern, suggesting a possible 14% rally to ~$134.5K.
• Momentum is still strong; RSI is elevated but not yet overbought (14-day stochastic RSI at ~79.4%).
📌 Outlook:
Bitcoin may consolidate or experience a mild pullback in the short term around the $123K level, especially if the USD continues to strengthen or volatility spikes. However, a clean breakout above $125K could trigger a further rally toward the $134K–$146K range.
💡 Suggested Trading Strategy: (Spot only – no leverage)
🔻 SELL Bitcoin/USD at: $123K–125K
🎯 TP: $117K
❌ SL: $126.5K
🔺 BUY Bitcoin/USD at: $117K–119K
🎯 TP: $123K–125K
❌ SL: $115K
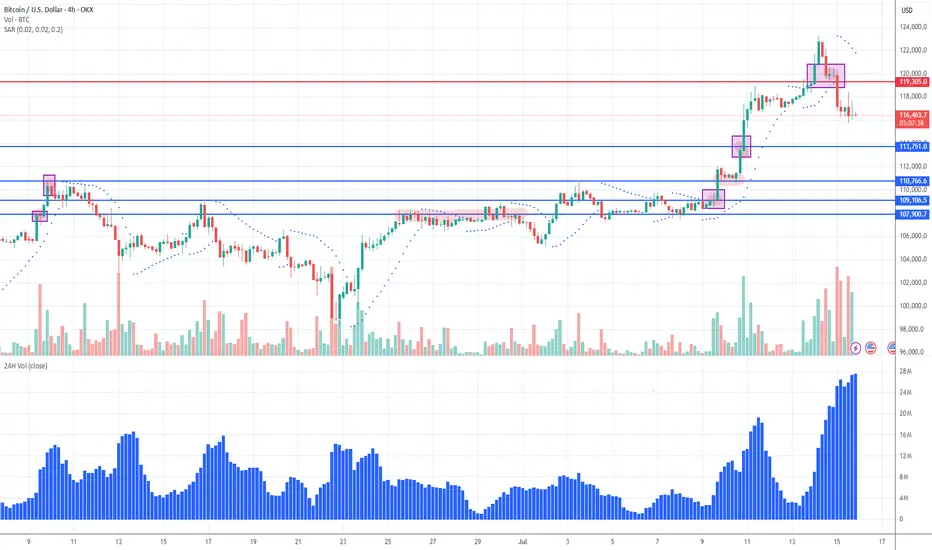
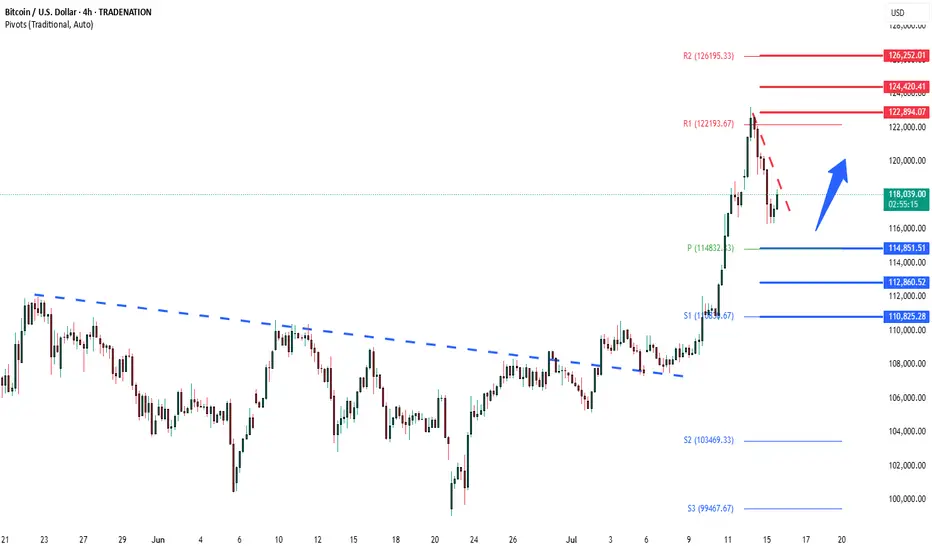
BTCUSD overbought correction supported at 114,850The BTCUSD remains in a bullish trend, with recent price action showing signs of a corrective pullback within the broader uptrend.
Support Zone: 114,850 – a key level from previous consolidation. Price is currently testing or approaching this level.
A bullish rebound from 114,850 would confirm ongoing upside momentum, with potential targets at:
122,900 – initial resistance
124,420 – psychological and structural level
126,250 – extended resistance on the longer-term chart
Bearish Scenario:
A confirmed break and daily close below 114,850 would weaken the bullish outlook and suggest deeper downside risk toward:
112,860 – minor support
110,825 – stronger support and potential demand zone
Outlook:
Bullish bias remains intact while the BTCUSD holds above 114,850. A sustained break below this level could shift momentum to the downside in the short term.
This communication is for informational purposes only and should not be viewed as any form of recommendation as to a particular course of action or as investment advice. It is not intended as an offer or solicitation for the purchase or sale of any financial instrument or as an official confirmation of any transaction. Opinions, estimates and assumptions expressed herein are made as of the date of this communication and are subject to change without notice. This communication has been prepared based upon information, including market prices, data and other information, believed to be reliable; however, Trade Nation does not warrant its completeness or accuracy. All market prices and market data contained in or attached to this communication are indicative and subject to change without notice.
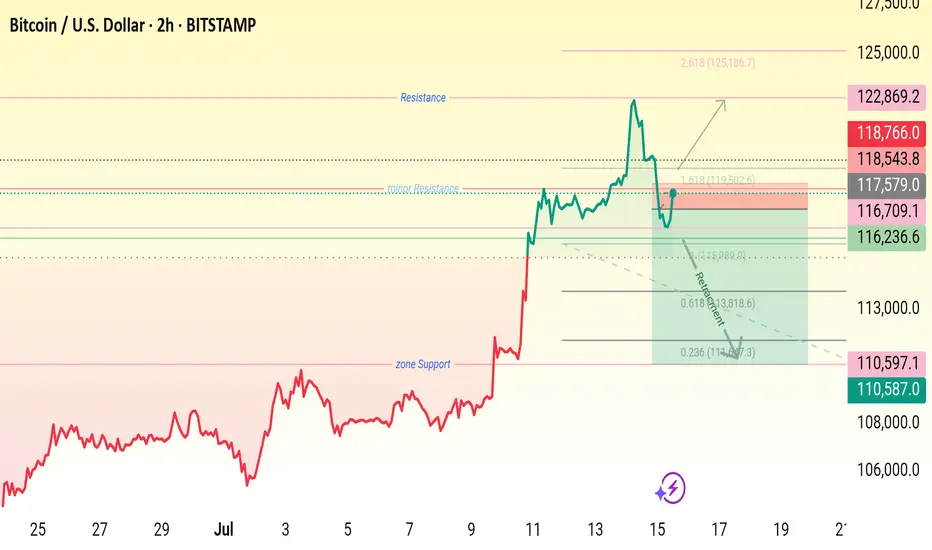
Btc key levels,
Wait for price rejection .
•Entry Zone: 115,900 – 116,700
• Stop Loss: Below 110,587
🎯 Target 1: 118,543
🎯 Target 2: 122,869
• Extension Target: 125,186 (1.618 Fib)
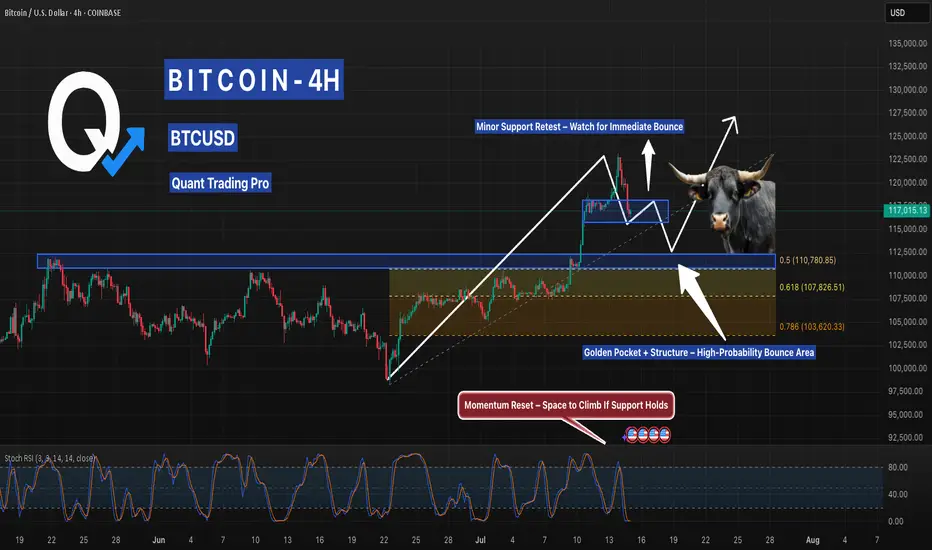
Bitcoin Cooling Off… But the Bulls Aren’t Done YetAfter a sharp run-up, Bitcoin is pulling back into the first support zone just above prior resistance. If this level fails, the 0.5–0.618 Fib area aligned with structure (110K–107K) is the key zone to watch. Bullish momentum could reload from either zone if buyers step in.
This is the zone where smart entries form — not exits. Let price confirm, then strike with precision.
BTC/USD: Multi-Timeframe Breakdown & Retest of Key Demand ZoneThis multi-timeframe analysis for BTC/USD highlights a significant bearish breakdown from prior support levels and a rising trendline. Price has entered and is currently consolidating within a major demand zone around 116,675 - 118,828.8. The analysis focuses on the current price action at this critical support, looking for either a confirmed bounce for a retest of broken resistance, or a decisive breakdown for further downside. Key observations include the strong bearish impulse, the breakdown of a long-term trendline, and the current consolidation at a multi-timeframe demand area. The upcoming 4-hour candle close/open at 16:30 (after 4hr) is a critical time for potential volatility and confirmation of direction.
BTCUSD Analysis : Bitcoin Trend Shifted/Bullish Pattern + Target🧭 Overview:
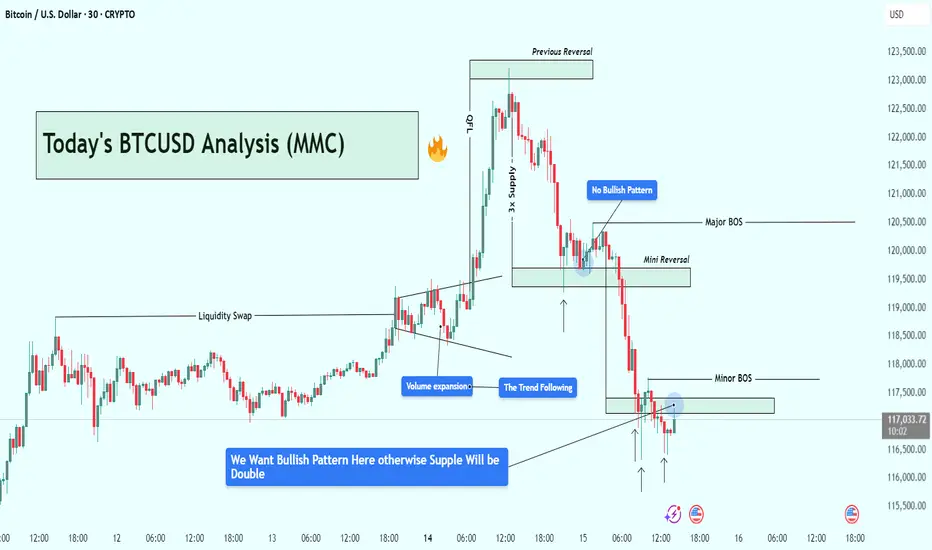
Bitcoin’s recent price action has delivered a textbook sequence of institutional liquidity play, volume-driven breakout, and supply zone rejection. After rallying on increasing volume, BTC tapped into a significant 3x Supply Zone—which also served as a previous reversal point—and was swiftly rejected. The market is now trading around a key decision zone where traders must stay alert for a confirmed bullish reversal, or risk getting caught in further downside.
🔍 Step-by-Step Technical Breakdown:
🔸 Liquidity Grab + Volume Expansion
The move began with a liquidity sweep, as BTC pushed above recent highs, hunting stop-losses and inducing breakout traders. This kind of price manipulation is typical of smart money accumulation/distribution zones.
Immediately following that, we observed a volume expansion—a strong signal that institutional players had stepped in, propelling BTC upward with conviction. This expansion pushed price sharply into the 3x Supply Zone, a critical zone of interest from a previous bearish reversal.
🔸 3x Supply Zone – The Turning Point
Once price entered the 3x Supply Zone, bearish pressure resumed. No bullish continuation pattern appeared on the second attempt into this zone—confirming that sellers were defending it aggressively. This area has now been validated as a strong supply barrier, capable of initiating trend reversals.
🔸 Major BOS – Structural Shift Confirmed
Price broke below key support around $120,500, which marked a Major Break of Structure (BOS). This BOS is crucial—it represents a shift from a bullish to bearish market structure and is often the signal that retail longs are trapped.
This BOS was followed by a mini reversal zone, but again, no bullish confirmation appeared there—highlighting market weakness.
🔸 Minor BOS & Trendline Breakdown
Further downside action led to a Minor BOS near $117,800, reinforcing the bearish sentiment. Additionally, the ascending trendline—which had supported BTC’s rally—was decisively broken and retested from below. This confirms a shift in momentum, now favoring sellers.
📍 Current Price Action – Critical Decision Zone
BTC is currently hovering around $117,000, right at a potential demand zone. While there was a brief bullish reaction, the market hasn’t formed a valid bullish reversal pattern yet.
There’s a clear message from the chart:
“We want a bullish pattern here—otherwise, support will break and supply will double.”
In simple terms, unless bulls step in with structure (higher low, engulfing candle, etc.), sellers will likely take over, and price may test deeper support levels.
🎯 What to Watch Next:
✅ Bullish Case:
If BTC forms a strong reversal pattern (e.g., double bottom, bullish engulfing, or inverse head & shoulders), we can expect a short-term recovery back to:
Target 1: $118,500
Target 2: $120,000–$120,500
❌ Bearish Case:
Failure to hold this zone and no clear bullish pattern = likely continuation to the downside, potentially targeting:
$116,000
Even $114,500 in extended moves
🧠 Trading Insights (Educational):
Volume + Structure = Edge
Don’t rely solely on candlestick signals—combine them with structural breaks and volume to get confluence.
Supply Zones Aren’t Just Rectangles
The 3x Supply Zone was powerful because it had historical context, volume convergence, and psychological resistance. These layered factors make zones more reliable.
BOS Isn’t a Trendline Break
BOS means real structural shift. In this case, lower highs and lower lows confirmed the change.
💡 Final Thoughts:
BTC is at a make-or-break level. The recent rejection at the 3x supply zone has shifted the momentum, and buyers must prove their strength now—or risk watching the price unravel further.
Stay patient, wait for structure, and never fight momentum.
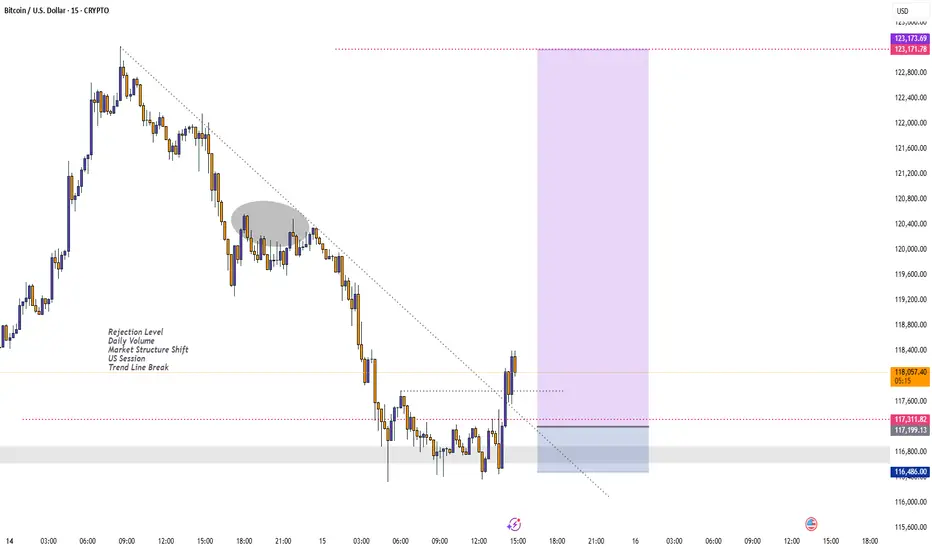
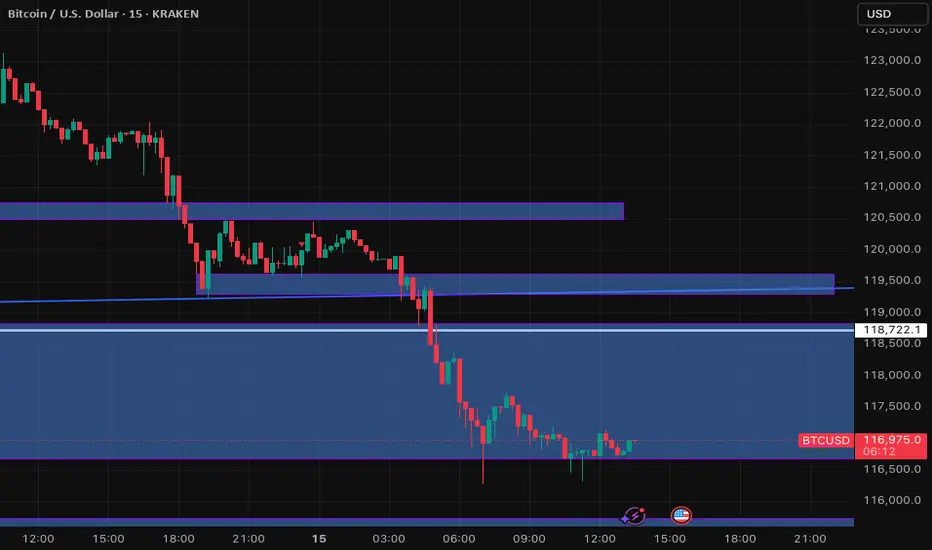
Liquidity Sweep PossibilityFrom the chart provided (BTC/USD on the 15-minute timeframe), here are the **key points** and notable observations:
---
🔑 **Key Technical Points:**
1. **Price Level**:
* Current price: **\$116,942.23**
2. **Supply/Demand Zones**:
* **Supply Zone (Resistance)**: Gray zone near the **\$117,000** level
Price entered this zone and rejected, indicating selling pressure.
* **Demand Zone (Support)**: Lower gray zone around **\$115,900–\$116,100**
This area may act as a bounce point if price drops further.
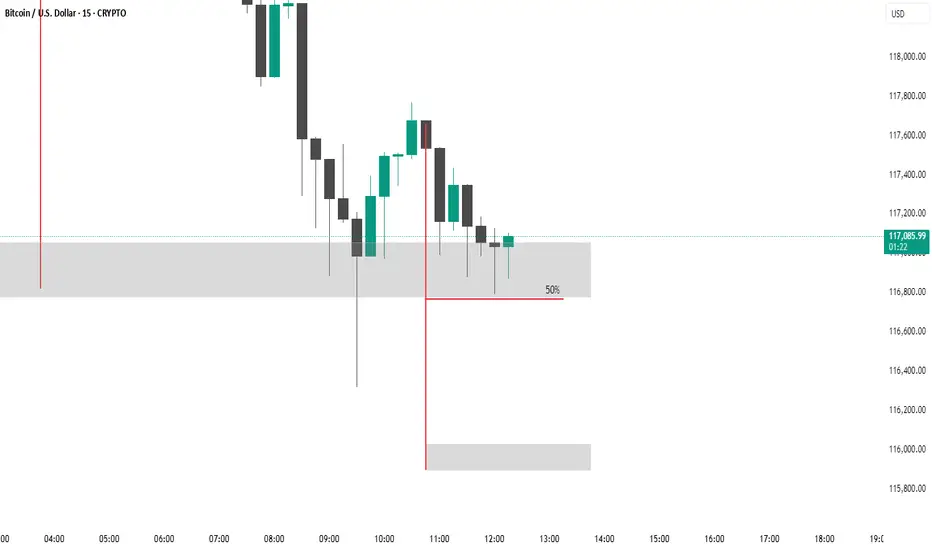
3. **50% Level**:
* A red horizontal line is marked at **50% of the last impulse leg**, just above **\$116,800**.
This is likely used as a **midpoint retracement** zone and is acting as resistance.
4. **Bearish Candlestick Structure**:
* Series of lower highs and lower lows after the price failed to break the resistance area.
* Momentum appears to be favoring the downside.
5. **Liquidity Sweep**:
* A long wick can be seen below \$116,800, indicating a **liquidity grab** before a bounce.
* This often signals stop-hunting activity.
---
📉 **Potential Scenarios:**
* **Bearish Bias**: If price continues below \$116,800 (50% level), it could target the demand zone near **\$116,000**.
* **Bullish Rejection**: If price bounces sharply from the current gray zone, watch for a re-test of the **\$117,200+** area.
---
thanking u
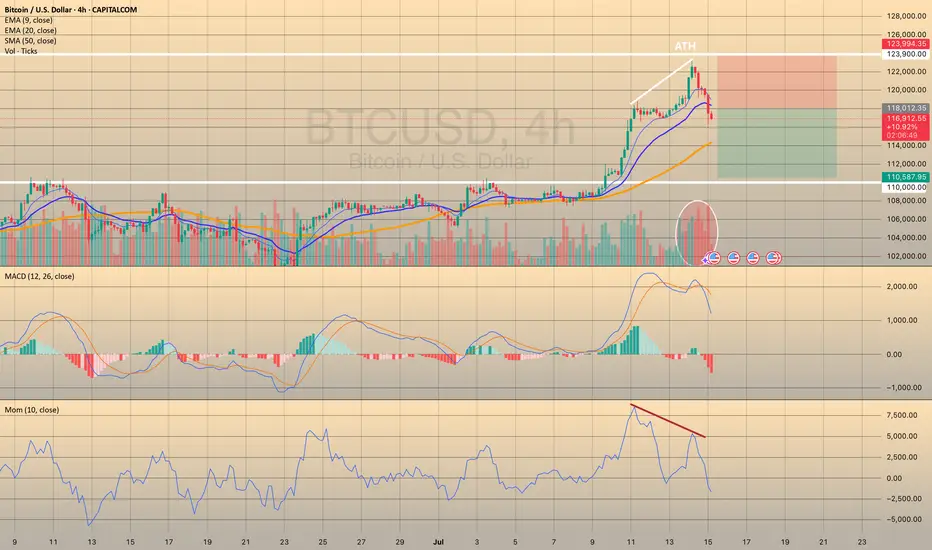
BTCUSD - REBOUND FROM ATHYesterday BTCUSD has reached new price level slightly above 123,000.00 and started to decline afterwards on big selling volume. Also we see some divergence on momentum oscillator and MACD has crossed into a red zone. I still think that bitcoin is overbought and needs the correction before next growth, so I decided to go short with
🔽 a market sell order at 117461.25 with
❌a stop loss at 123894.15 and
🤑a take profit at 110587.70
A stop loss is above the ATH, take profit just above the support level of 110,000.00. It is a counter-trend trade, so it's a bit more risky than usual.
Trade cautiously! Preserve your deposits!
Bitcoin Hits New Highs: Is The Institutional Money Here To Stay?Bitcoin Hits New Highs, Gains Stability and Scale in Its Institutional Era: Will It Last?
From a volatile and often misunderstood outsider, Bitcoin has embarked on a remarkable transformation, evolving into what many now see as a foundational financial layer. This new era is not fueled by the fleeting whims of retail hype, but by the calculated, long-term strategies of professional capital. The steady influx of institutional investors is profoundly reshaping Bitcoin's character, taming its notorious volatility and broadening its accessibility to everyday individuals. This seismic shift begs the question: is this newfound stability and scale a permanent feature of the financial landscape, or a transient phase in Bitcoin's tumultuous history?
The Dawn of a New Epoch: The Institutional Stampede
For years, the narrative surrounding Bitcoin was one of a grassroots monetary experiment, a digital curiosity championed by cypherpunks and early internet adopters. Wall Street remained a skeptical spectator, wary of the asset's wild price swings, its lack of regulatory clarity, and its disruptive potential. However, Bitcoin's unyielding resilience and its core value proposition of a decentralized, finite digital asset gradually wore down this institutional resistance. The floodgates did not just creak open; they were blown apart with the regulatory approval of spot Bitcoin Exchange-Traded Funds (ETFs). This landmark decision marked a clear and decisive tipping point, a formal invitation for mainstream finance to embrace the world's first cryptocurrency.
This regulatory green light has had a profound and cascading impact. It has, in a single stroke, legitimized Bitcoin in the eyes of the most conservative financial establishments. More importantly, it has provided a familiar, regulated, and highly accessible entry point for a vast and previously untapped ocean of capital. Exposure to Bitcoin is no longer confined to specialized crypto-native platforms, which often carried a steep learning curve and perceived security risks. Now, it can be seamlessly integrated into the traditional investment portfolios that millions of people rely on, managed through their existing brokerages, pension funds, and even insurance products. This growing wave of institutional adoption is not merely inflating Bitcoin's price; it is fundamentally anchoring it more firmly within the global economy, weaving it into the very fabric of the system it was once designed to challenge.
The numbers illustrating this shift are staggering. In a remarkably short period, spot Bitcoin ETFs have amassed well over $138 billion in assets. This figure is not static; it represents a dynamic and growing pool of capital, reflecting sustained institutional interest. Registered Investment Advisors (RIAs), who manage the wealth of millions of Americans, along with sophisticated hedge funds and forward-thinking pension funds, represent a growing share of this investment. These are not speculative day traders but entities with long-term horizons and rigorous due diligence processes. Their participation signals a deep conviction in Bitcoin's future.
This institutional embrace extends far beyond the realm of ETFs. Major corporations have continued their aggressive accumulation of Bitcoin, viewing it as a treasury reserve asset superior to cash. This trend of corporate and institutional adoption is a key driver of Bitcoin's maturation, lending it a newfound sense of legitimacy and stability that was unimaginable just a few years ago. The current market cycle is thus being defined not by the frenetic energy of individual retail investors, but by the methodical and powerful currents of professional capital.
Taming the Beast: Volatility in the Institutional Age
One of the most significant and welcome consequences of this institutional influx has been the taming of Bitcoin's infamous volatility. For most of its history, Bitcoin's price chart resembled a dramatic mountain range, with breathtaking peaks and terrifying valleys. This volatility was its defining characteristic and its biggest barrier to mainstream acceptance. Institutional capital, however, operates on a different wavelength. With its longer time horizons and more systematic, data-driven approach, it behaves differently from the often emotionally-driven retail market.
While individual investors are more prone to panic-selling during sharp price dips or piling in during euphoric rallies, large institutions are more likely to employ disciplined strategies like dollar-cost averaging. They see price corrections not as a reason to panic, but as a buying opportunity. This behavior provides a stabilizing force, creating a floor during downturns and tempering the irrational exuberance of market tops.
This shift in market dynamics is evident in the flow of funds into the new financial products. These investment vehicles have frequently seen strong net inflows during price corrections, with major asset managers absorbing billions in capital even as retail sentiment soured. This institutional buying pressure acts as a powerful buffer, moderating the extreme price swings that have historically characterized the Bitcoin market.
While Bitcoin's volatility remains higher than that of traditional assets like gold or global equities, its trajectory is one of marked and consistent decline. This decline is a natural consequence of its growing market capitalization. As the total value of the network expands, the relative impact of new capital inflows or outflows is diminished, leading to smoother price action.
Interestingly, Bitcoin's volatility has at times converged with, and even fallen below, that of some mega-cap technology stocks, which themselves can exhibit significant price swings. This convergence is making traditional investors take a closer look, as the risk-reward profile of Bitcoin becomes more palatable and understandable. Historically, investors have been well-compensated for taking on Bitcoin's volatility, with its risk-adjusted returns often outperforming major stock indices over multi-year periods.
From Digital Gold to a Financial Base Layer: An Evolving Narrative
For much of its existence, Bitcoin has been championed as "digital gold." This narrative is powerful and intuitive. Like gold, it has a finite, predictable supply. It is decentralized, meaning no single entity can control it or create more of it at will. And it is censorship-resistant, offering a store of value outside the traditional financial system. This narrative has been a potent driver of adoption, particularly among those seeking a hedge against inflation, currency debasement, and geopolitical uncertainty.
However, the increasing stability brought about by institutional investment is fostering a new and complementary narrative: Bitcoin as a potential medium of exchange and, more broadly, as a foundational settlement layer for the global financial system. Lower volatility is a crucial prerequisite for any asset to function effectively as a currency. When prices are relatively stable, merchants and consumers can transact with confidence, knowing the value of their money will not drastically change overnight.
The development of Layer 2 solutions, most notably the Lightning Network, is a critical piece of this puzzle. These protocols are built on top of the Bitcoin blockchain and are designed to enable faster, cheaper, and more scalable transactions. They address the primary technical hurdles that have hindered Bitcoin's use for everyday payments, such as coffee or groceries. As this technological infrastructure continues to mature and gain adoption, Bitcoin's utility beyond a simple store of value is poised to expand significantly.
Furthermore, Bitcoin's historically low correlation with traditional assets like stocks and bonds makes it an exceptionally valuable tool for portfolio diversification. In a world where asset classes are becoming increasingly interconnected, Bitcoin offers a unique return stream. Adding even a small allocation of Bitcoin to a traditional 60/40 portfolio can potentially enhance returns over the long term without a commensurate increase in overall risk. This diversification benefit is a key part of the thesis for many institutional investors.
Navigating the Market's Pulse: Price, Psychology, and Predictions
As Bitcoin navigates this new institutional era, the question on every investor's mind is: where does the price go from here? The recent surge to new all-time highs above the $123,000 mark has been met with a mix of bullish enthusiasm and cautious optimism. After reaching this peak, the market saw a natural retreat, with bulls pausing for a breath and prices consolidating. The price action has been dynamic, with a fresh increase starting above the $120,000 zone before finding temporary resistance and trading near the $118,500 level. This kind of price discovery, including breaks below short-term bullish trend lines, is characteristic of a market absorbing new information and establishing a new support base.
Technical analysis suggests that the current rally may have further to run. Having decisively broken through key psychological and technical resistance zones, some analysts see a clear path toward $135,000 or even $140,000 in the medium term. The price trading well above key long-term moving averages confirms that the underlying momentum remains strongly bullish.
However, a closer look at market sentiment and on-chain data reveals a more nuanced and perhaps even more bullish picture. Despite the record-breaking prices, the market has yet to enter the state of "extreme greed or euphoria" that has characterized the absolute peaks of previous bull cycles. Key metrics that track the profitability of long-term holders remain below the "euphoria" zone, suggesting that the smart money is not yet rushing to take profits. This could indicate that the current rally, while impressive, is still in its early or middle phases, with more room to grow before reaching a cyclical top. A delay in the full-blown bull market euphoria could ultimately push Bitcoin higher than many expect.
Of course, the market is not a one-way street. The spike to $123,000 was followed by an increase in Bitcoin flowing into exchanges, a potential sign of short-term profit-taking and a cooling-off period. Even large, strategic players may take profits during rallies. The news of Bhutan's sovereign wealth fund strategically unloading a portion of its holdings is a prime example. While these sales can introduce short-term selling pressure, they are also a healthy part of a functioning market. The fact that inflows, even at the peak, were just a fraction of those seen in earlier parts of the year suggests that the selling pressure is not yet overwhelming.
The Sustainability of the Institutional Era: A Critical Analysis
The institutionalization of Bitcoin is undoubtedly a paradigm shift, but its long-term sustainability is not a foregone conclusion. While the current trend is one of increasing adoption and stability, there are several factors that could challenge this new status quo and must be considered by any serious investor.
One potential risk is the concentration of Bitcoin in the hands of a few large institutions. While this brings stability in the short term, it also introduces a potential point of centralization in a decentralized system. If a handful of major asset managers were to simultaneously decide to sell their holdings—perhaps due to a change in their own internal risk models or a major macroeconomic shock—it could trigger a significant market downturn. Such a move would likely be exacerbated by retail investors following the lead of these financial giants.
Regulatory risk also remains a significant and unpredictable concern. While the approval of spot Bitcoin ETFs in the United States was a major step forward, the global regulatory landscape is a complex and evolving patchwork. Any future crackdowns, unfavorable tax treatments, or restrictive regulations in major jurisdictions could dampen institutional enthusiasm and hinder further adoption. The path to full regulatory clarity is likely to be long and fraught with challenges.
Furthermore, the narrative of Bitcoin as an inflation hedge has yet to be definitively proven across all possible economic conditions. While it has performed well during recent periods of high inflation and monetary expansion, its correlation with risk assets means it can also be sensitive to economic downturns and tightening financial conditions. A prolonged period of global recession or stagflation could test its resilience as a store of value in new and unexpected ways.
Conclusion: A Maturing Asset in an Evolving World
Bitcoin has come an immeasurably long way from its obscure beginnings as a niche digital currency for a small community of technologists. The influx of institutional capital has ushered in a new era of stability, accessibility, and legitimacy. The launch and wild success of spot Bitcoin ETFs has been the primary catalyst, providing a regulated and familiar on-ramp for a vast pool of professional money that is reshaping the asset's very DNA.
This institutional embrace is about far more than just price appreciation; it is fundamentally changing the character of Bitcoin. Its volatility, while still present, is on a clear downward trend, making it a more viable contender as both a global store of value and a neutral settlement network. The long-held dream of Bitcoin as a foundational layer of a new, more transparent financial system is slowly but surely taking shape.
However, the road ahead is not without its challenges. The risks of institutional concentration, regulatory uncertainty, and macroeconomic headwinds are real and should not be underestimated. The sustainability of this new era will depend on a delicate interplay of market forces, regulatory developments, and continued technological innovation on its network.
What is clear is that Bitcoin has earned its place on the world's financial stage. It is no longer an outsider looking in, but a maturing asset that is being progressively integrated into the global economic fabric. Whether this institutional era will be a lasting one remains the defining question of our time. But one thing is certain: Bitcoin's journey is far from over, and its evolution will continue to be one of the most compelling and consequential stories in the world of finance for years to come.
15.07.2025 - Bitcoin, DAX, Dow Jones, WTI-Öl - GBE MarktcheckWelcome to a new GBE market-insight
My name is Raphael Dreyer, charting expert at GBE brokers, and this is what you can expect in today's video.
- Bitcoin reaches new all-time high
- DAX remains above 24,000 points
- Dow Jones with momentum towards all-time high?
- WTI oil bounces off the downward trend
I wish you a successful trading day, until the next GBE market check.
Risk warning:
CFDs are complex instruments and carry a high risk of losing money quickly due to leverage. 76.61% of retail investor accounts lose money when trading CFDs with this provider. You should consider whether you understand how CFDs work and whether you can afford to take the risk of losing your money.

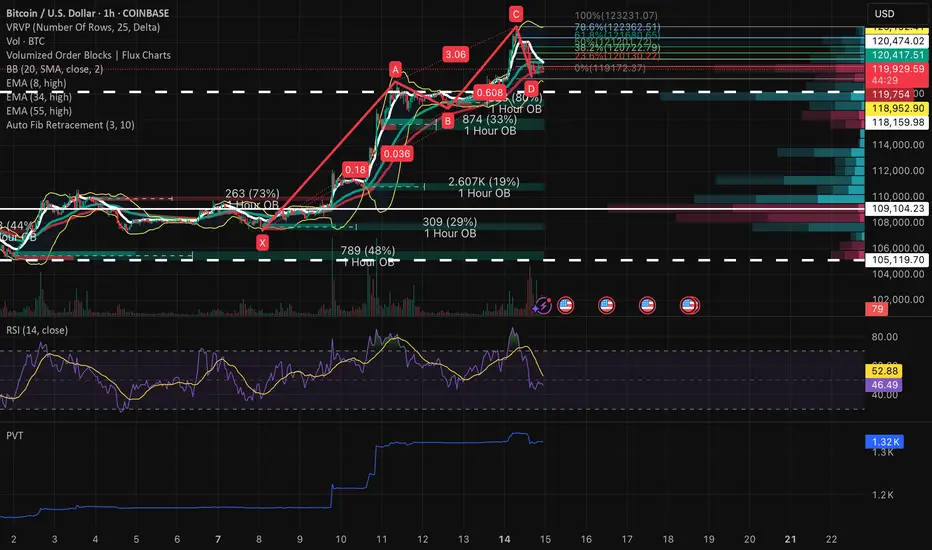
BTCUSD • 1H ABCD Completion at Key Confluence – Long Bias1) Macro → Micro Context
Daily / 4H Trend:
Still a clear up-trend on the daily & 4-hour: higher highs / higher lows above the 8, 34 & 55 EMA ribbon.
The $120 K–$121 K zone houses the largest Volume-by-Price node in two weeks, now acting as near-term support.
1H Context:
X→A: $106 100 → $118 950 impulsive run
A→B: ~15% pullback into $117 000 (≈0.15 XA)
B→C: 3.06× extension to $123 230
C→D: Retrace into $119 900–$120 300, matching 0.618 BC & ~80% XC Fib
2) Structural & Momentum Breakdown
AB=CD & Fib Confluence: D at $119 900–$120 300 aligns perfectly with both 0.618 BC and ~80% XC retracements.
1H Bullish Order Block: $119 900→$119 750
20-period SMA (mid-BB): ≃$120 100
VRVP High-Volume Node: Centered ≃$120 400
RSI (14): Holding 47–50 on the hour, flattening and poised to curl up
PVT: Flat-to-up on the pullback—sign of absorption
Volume: Contracts into D, then a slight uptick on the last 1 h bar
3) Exact Trade Plan
Entry: $119 400 - $120 300
Stop-Loss: $117 300 - $118 000
Take-Profit 1: $121 800 → $122 200
Take-Profit 2: $123 000 → $123 500
Optional “Hype” TP instead of TP 2: $125 000 → $126 500
(for a parabolic push if the upcoming House vote prints strong headlines — targets at 78.6%–100% BC extensions)
Entry Confirmation (any one):
1 h bullish engulfing or inside bar within entry zone
RSI (14) closes back above 50 on the hourly
PVT prints a higher low with renewed buy-side volume