BITCOIN trade ideas
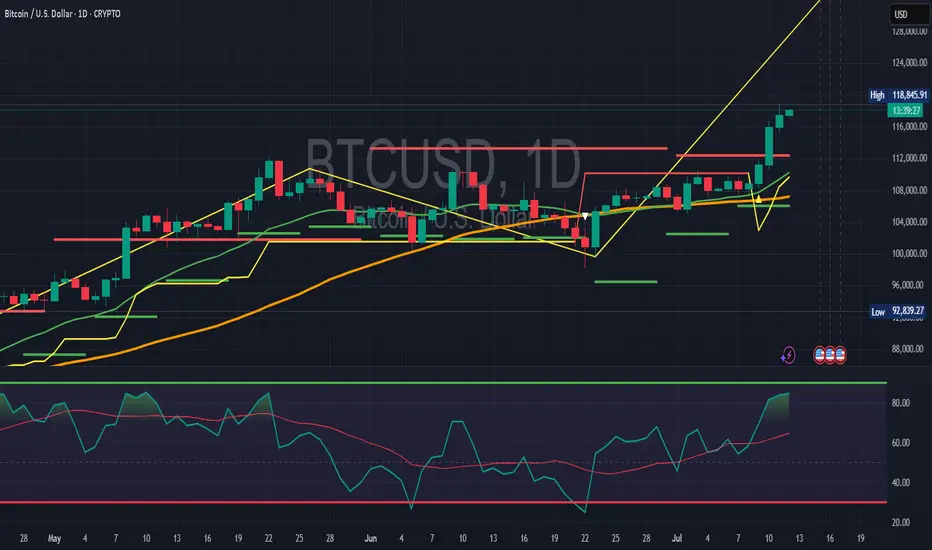
Bitcoin May Continue Rising After Breakout📊 Market Overview:
• Bitcoin recently broke above $118,000, reaching a weekly high of $118,740, fueled by expectations of a Fed rate cut in September and strong ETF inflows into the market
• Katie Stockton from Fairlead Strategies highlights a bullish cup-and-handle pattern, supporting a potential 14% upside toward $134,500
📉 Technical Analysis:
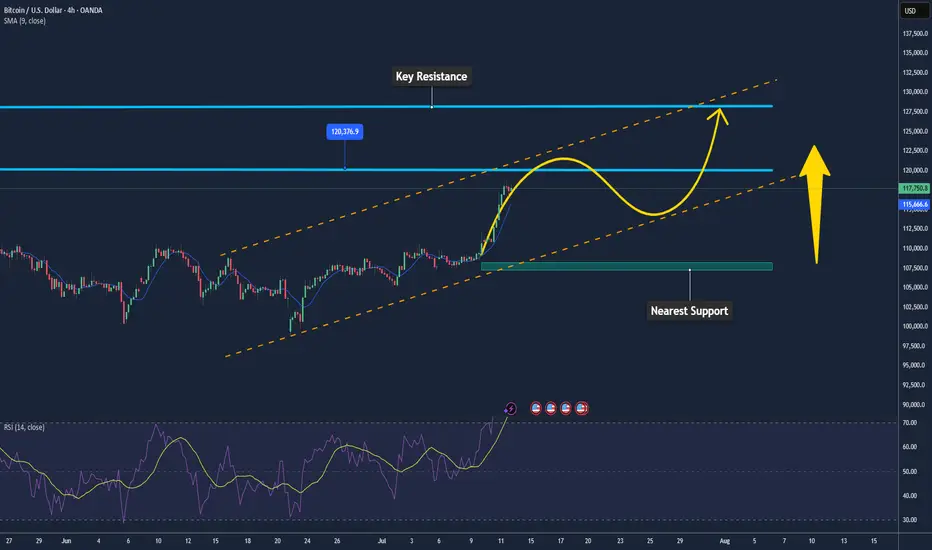
• Key Resistance: $120,000 – $128,500 (based on Fibonacci projection).
• Nearest Support: ~$108,300 – previous resistance turned support, along with ~$107,000 near the 50-day EMA.
• EMA 09: Price is trading above the 9-day EMA, indicating a short-term bullish trend.
• Patterns & Volume:
o A cup-and-handle breakout suggests continued upside potential.
o Rising volume on breakouts reflects strong buying interest.
o MACD is bullish, and RSI is not yet overbought — allowing further room to rise.
📌 Outlook:
Bitcoin may continue to rise in the short term if it holds above the 9-day EMA and avoids a sharp drop below the $108k–110k support zone. A break below this area could trigger a deeper correction toward $100k.
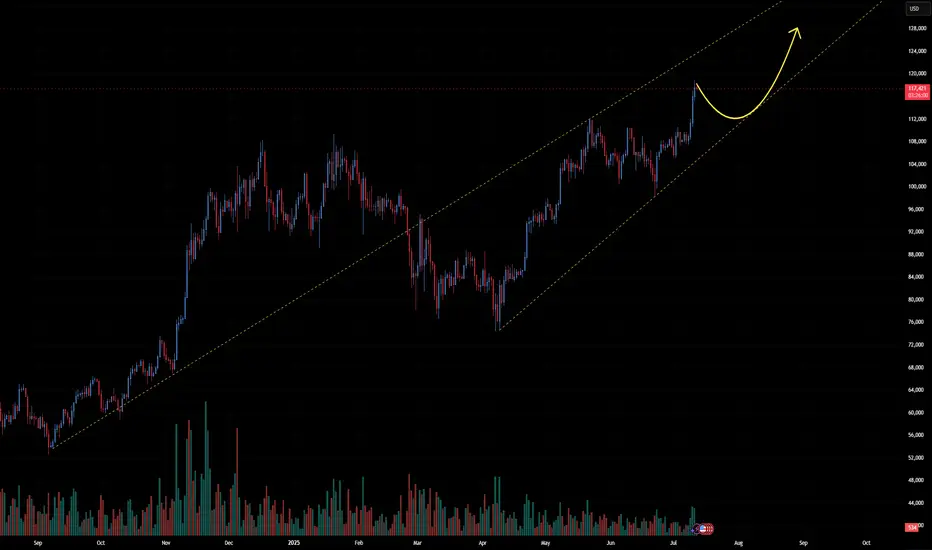
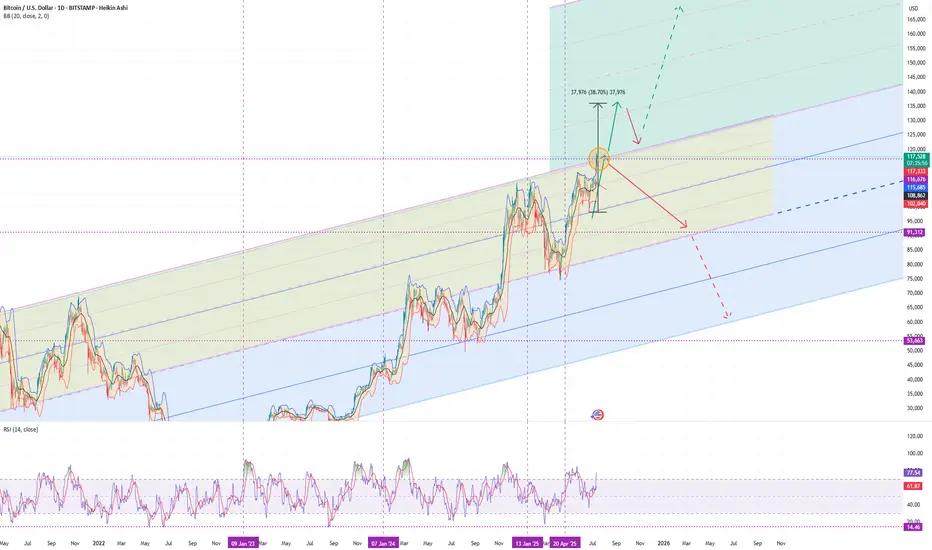
Update on BTC Fan Chart.TradingView wouldn't let me update my last idea, but this fan chart still amazes me.
The breakout has played out very well. The vertical line indicates US Congress budget bill date.
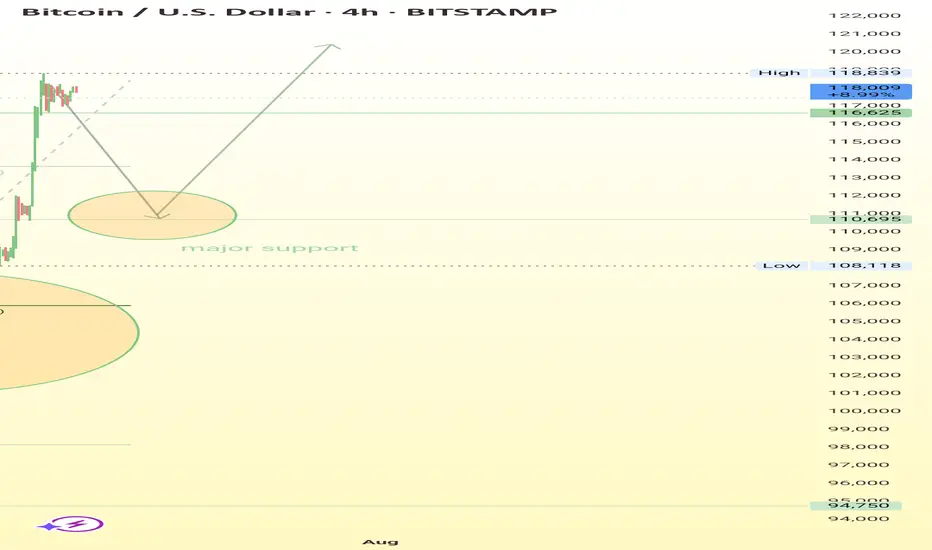
$BTC 🚨 Bitcoin bullishness might be more than hype…
It could be a signal that investors are protecting assets inside liquidity pools, anticipating an interest rate cut soon. 💰
Bitcoin Still in Up-Trend Channel, Bubble Still AheadAs of July 2025 Bitcoin trades near $120 000 and every weekly close since the November 2022 low has stayed inside the same rising log-channel. The channel’s upper rail is ≈ $170 000 today and should reach ≈ $230 000 by December. A decisive breakout requires a weekly close above that rail. In previous cycles the breakout came almost exactly at the prior all-time high, but this time the 2021 ATH of $69 000 was reclaimed while price was still inside the channel. The trigger is therefore less obvious; yet if price finally closes beyond the rail, a new exponential leg is expected to begin.
Two structural shifts explain the delay. First, the channel’s slope keeps flattening: early cycles rose about 0.6 % per day on a log scale, now it is roughly 0.15 %. Second, each order-of-magnitude move demands vastly more capital, so the supply squeeze after the April 2024 halving is taking longer to translate into price.
At past tops growth multiples fell from 36× (2013) to 16× (2017) to 3.5× (2021). Extending that trend points to roughly 1.5–2× from the future breakout price. If the breakout happens near $170 000–230 000 the projected new ATH lands around $250 000–360 000, a range that lines up with the red-orange band on the updated Bitcoin Rainbow Chart.
Historically peaks follow a breakout by 9–13 months and the halving by 16–20 months, placing the most probable time window in Q4 2025. Until the weekly candle settles above the channel roof Bitcoin remains in accumulation mode and the classic blow-off phase is still ahead.
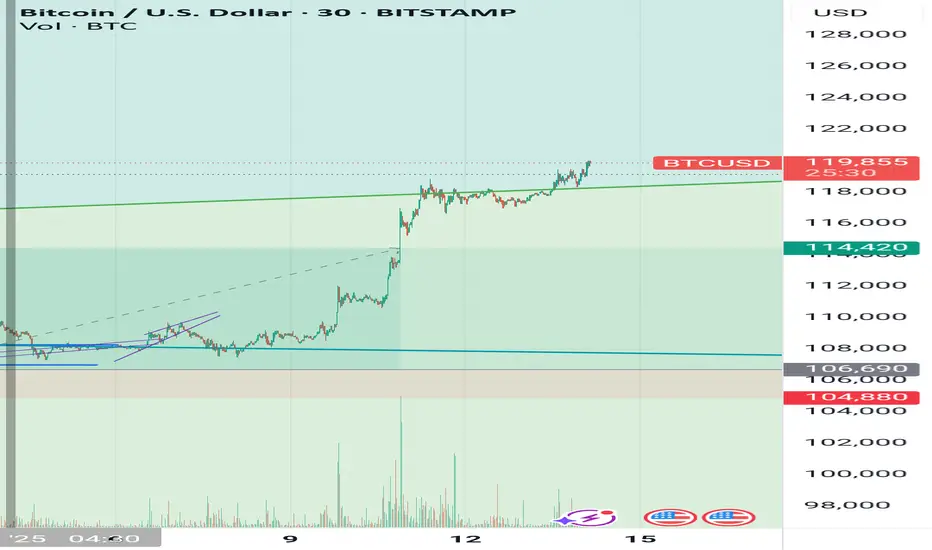
uptrendThe upward trend is expected to advance to the specified resistance level. Then, there is a possibility of a trend change and the correction will begin.
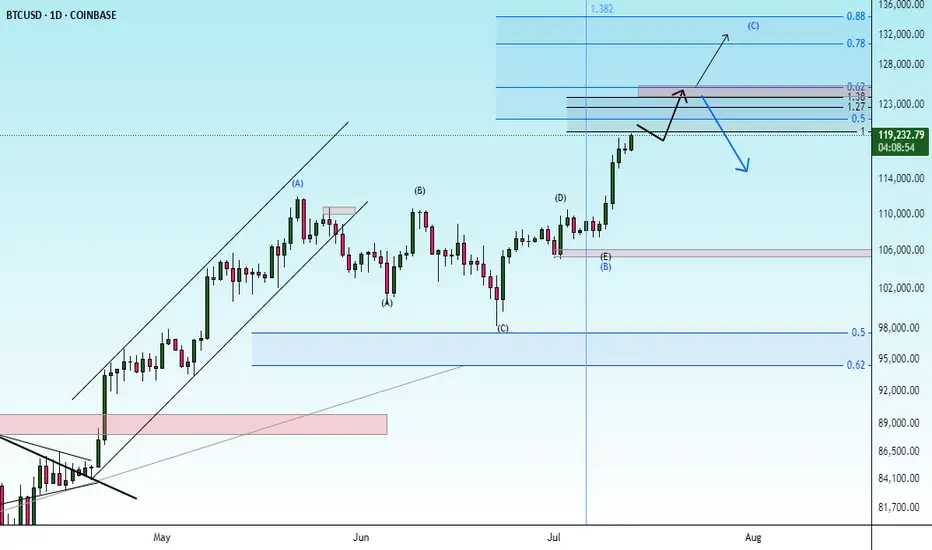
Analysis through chart and Fibonacci.
BTC recently surged, reaching a local high at ~$118,839, showing a sharp upward movement.
Price is currently consolidating just below the recent high.
A horizontal support is marked at $110,695, aligning closely with the 0.236 level.
A larger support zone is marked around $105,902, the 0.618 Fib level — a crucial area for potential bounce.
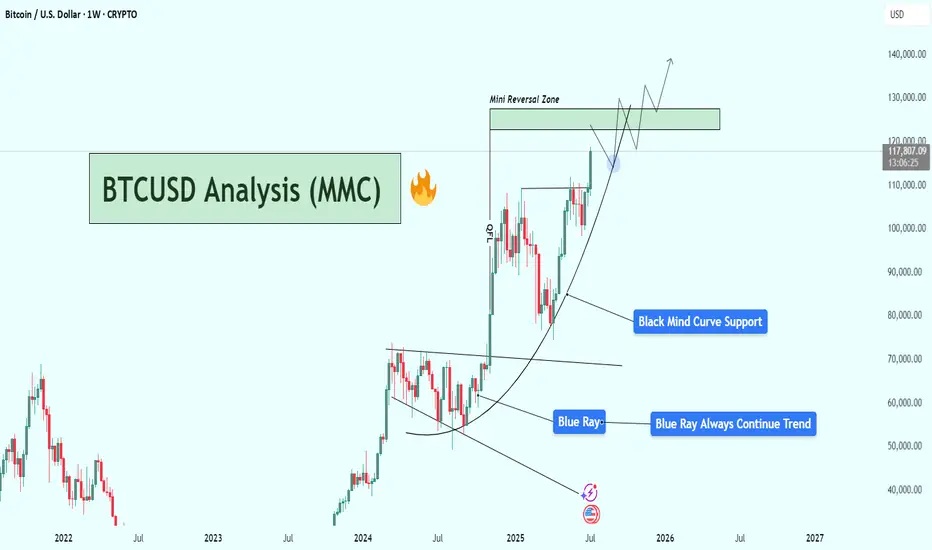
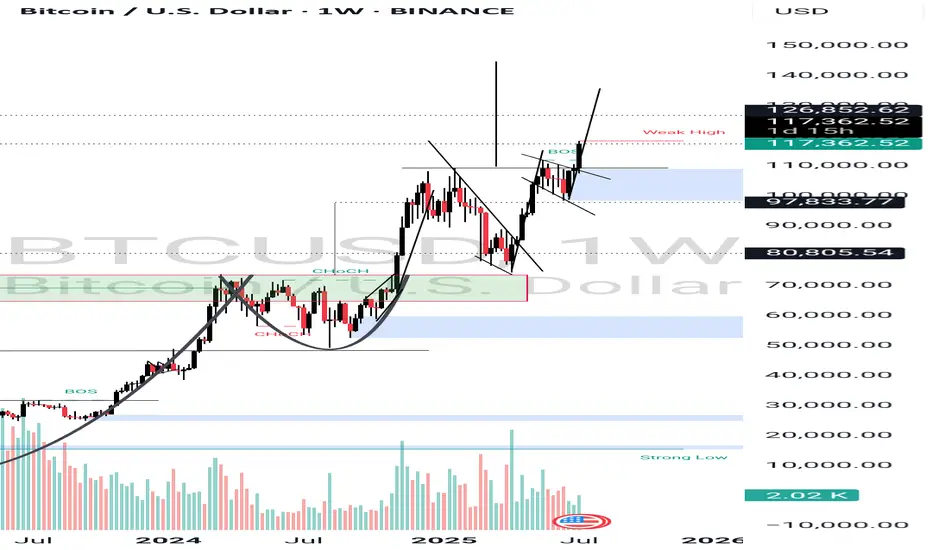
BTCUSD Weekly Analysis : Testing $130K Resistance + Next Target📌 1. Big Picture – Bitcoin is in a Parabolic Uptrend
This chart clearly shows that Bitcoin has shifted from a consolidation phase into a full-blown parabolic rally. That’s not just random growth — it’s an aggressive, momentum-driven market move that usually only happens during major bull cycles.
The curve shown in black — labeled “Black Mind Curve Support” — is your guide here. It's not a simple trendline. It shows how Bitcoin is accelerating upward, and this curve acts as a dynamic support. Every time price dips to it, buyers jump in fast — which shows strong bullish pressure and market confidence.
🔍 2. Blue Ray Broken = Trend Change Confirmed
Earlier, BTC was stuck under the Blue Ray, a long-term resistance trendline. As marked:
“Blue Ray Always Continue Trend”
That means, as long as price stays under it, the market is bearish. But guess what?
BTC broke above it — strongly.
That break confirmed a reversal in long-term structure, and it triggered this massive upward move. This breakout also aligned with a pattern of higher highs and higher lows, further confirming that bulls are now in full control.
🧠 3. Current Situation – Heading Into Mini Reversal Zone
Now BTC is trading around $117,820, and it's approaching the green box labeled Mini Reversal Zone — between $125,000 and $135,000.
Why is this area important?
It’s a psychological zone (big round numbers).
It lines up with historical resistance and previous supply zones.
It’s where smart money might take some profit, so we could see rejection or a short-term pullback here.
🎯 4. Two Scenarios to Watch
✅ Scenario A: Mini Pullback & Retest
BTC hits the Mini Reversal Zone → stalls → pulls back → retests the Black Mind Curve → bounces again.
That’s bullish and normal in a healthy uptrend. If you missed earlier entries, this pullback could be your golden opportunity.
🚀 Scenario B: Breakout of Reversal Zone
If Bitcoin breaks above $135K with strong momentum and closes the weekly candle high, we may see another parabolic rally toward $140K+.
This would mean even stronger buyer interest, possibly driven by FOMO, ETFs, or macro news.
📉 What Could Invalidate the Bullish Move?
Only if BTC:
Breaks below the Black Mind Curve, and
Starts closing weekly candles under $105K–$100K
That would mean the curve is broken, momentum is lost, and we might go into a consolidation or deeper correction.
But for now? No signs of weakness. Trend is strong, volume is rising, and price action is clean.
🧩 Summary of Key Levels
Type Level Notes
Curve Support Dynamic ($105K–$110K) Critical for trend continuation
Mini Reversal Zone $125K – $135K Watch for rejection or breakout
Bullish Target $140K+ If breakout holds above reversal zone
Trend Indicator Black Mind Curve As long as price rides this, bulls are in control
📌 Final Thoughts
This BTC chart isn’t just a random uptrend — it’s a well-structured parabola, powered by strong technical support and clean breakouts. Everything is lining up for a potential monster move, but don’t chase price blindly.
Watch the Mini Reversal Zone closely. If we see rejection, be ready to buy the dip. If we break through with volume — it’s 🚀 time again.
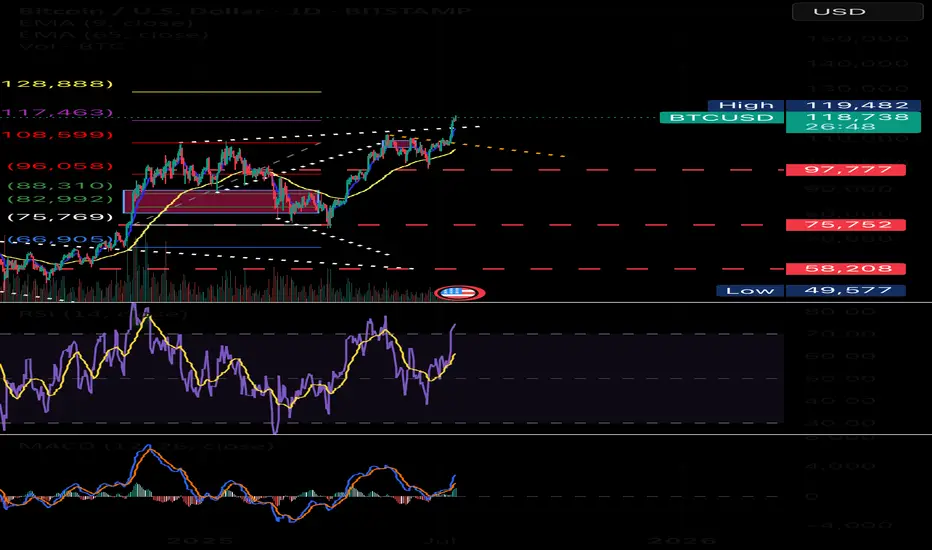
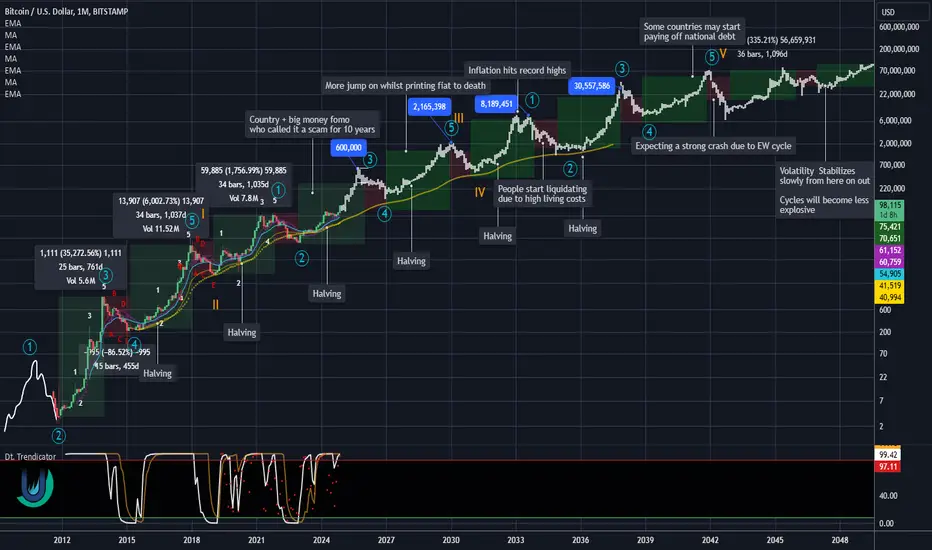
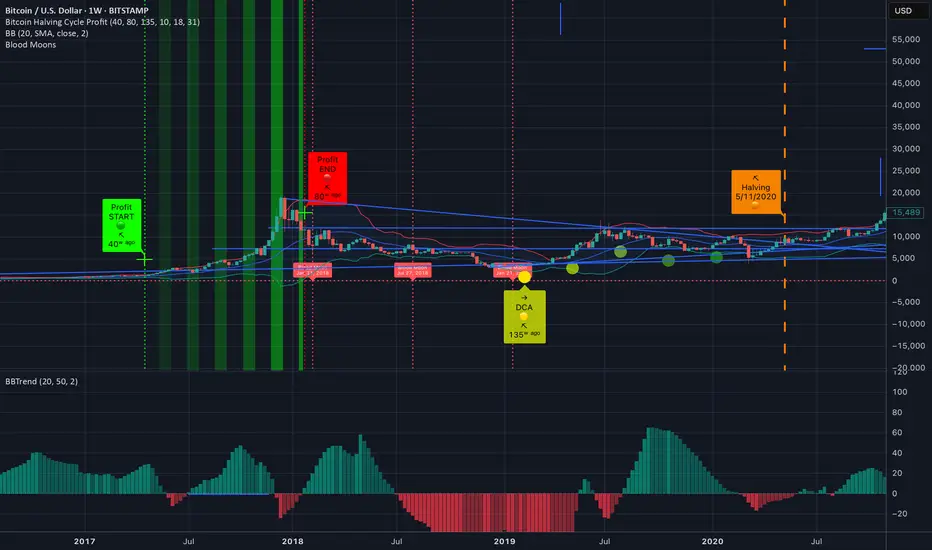
20 year long BTC analysisTaking into account the halvening and the recent bullish news of countries and big companies wanting to establish a BTC reserve. I think we can see some crazy cycles in the future.
These entities are most likely planning to hold for a minimum of 20 years. And countries won't be shy to print some extra dough for it. Some may see it as an opportunity to finally get rid of their national debt.
As long as fiat exists BTC will most likely keep going up. Its that simple.
USD WEAKNESS COULD TRIGGER COMMODITY/CRYPTO SURGEAlphaTrend is an advanced trading indicator that leverages proprietary tools, real-time data, and custom metrics to give traders a competitive edge. Designed for all experience levels, it works instantly—no advanced charting skills required.
ADVANCED and PRO versions are available. (See below)
🔍 How It Works
At the core of AlphaTrend is Dynamic Reversion Bands — a sophisticated real-time system that adapts to price action by automatically adjusting to evolving market conditions.
These bands act like a roadmap, helping traders identify:
Mean reversion trade opportunities
Trend strength
Emotion-driven market conditions (like FOMO)
The system is rooted in Mean Reversion Theory:
If an asset's price deviates significantly from its historical average, it tends to “revert” back to that average over time. Traders can use this behavior to spot potential buying or selling opportunities:
Overbought Conditions: If the price moves too far above the mean, it may signal a pullback—traders might sell or short.
Oversold Conditions: If the price drops well below the mean, it may be undervalued—traders might buy in anticipation of a bounce.
⚪🟡🔴🟡⚪ Dynamic DOTS
AlphaTrend visualizes market overextension through dynamic DOTS:
White DOTS = Average conditions
Yellow DOTS = Above average conditions
Red DOTS = Extreme conditions
The DOTS update in real time as the candle is forming—appearing, disappearing, and shifting color based on current intensity levels. Once the candle closes, however, the DOTS do not repaint. This ensures clarity and confidence in every signal.
This is crucial, as many indicators repaint and revise data after the fact, undermining traders’ trust. With AlphaTrend, once a candle closes, the data remains permanently fixed.
📊 Adaptability and Market Insight
AlphaTrend adapts to any timeframe, but performs best on longer-duration candles, where signals are fewer but more reliable. Multi-interval displays (e.g., 1hr, 4hr, Daily) are highly recommended. That being said it does tend to give strong signals on all time frames even down to 1 min candles.
The tool also integrates several intuitive market overlays:
Auto-generated support and resistance levels
Real-time supply and demand zones
Money flow tracking from institutions and banks
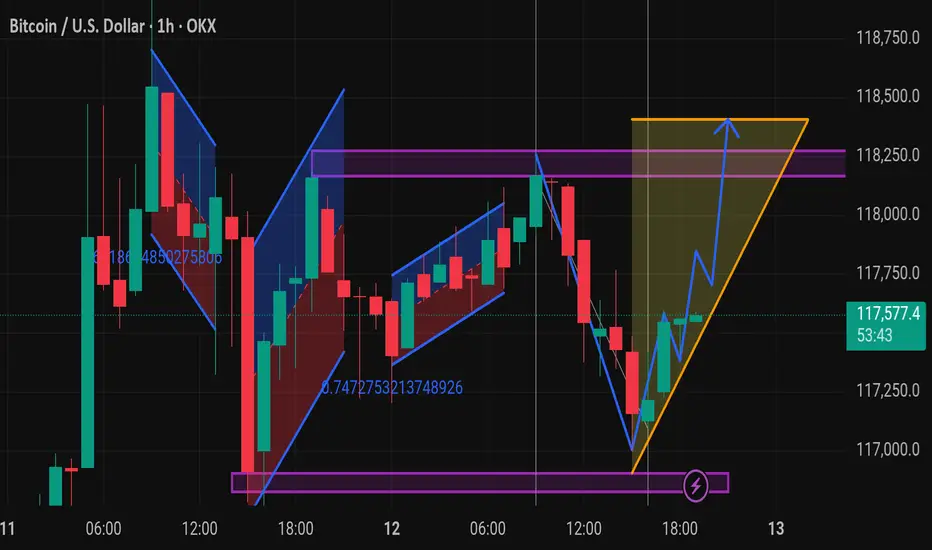
Btcusd techinical analysis.This chart displays the Bitcoin (BTC/USD) 1-hour candlestick chart on OKX, featuring a detailed technical analysis using harmonic patterns and chart structures.
Key Observations:
1. Harmonic Patterns:
Multiple harmonic/flag-like patterns are shown, both bullish and bearish.
These include retracements marked with Fibonacci ratios (e.g., 0.747 and 0.871), suggesting price reversal zones.
2. Support and Resistance:
Several horizontal purple lines indicate key support and resistance levels.
Strong support is visible around the 116,800 – 117,000 range.
Resistance appears near the 118,000 – 118,400 range.
3. Ascending Triangle Formation:
On the far right, an orange ascending triangle has formed, a typically bullish continuation pattern.
The blue arrow suggests a projected breakout to the upside, targeting around 118,400.
4. Bullish Reversal Indication:
A reversal (marked by a ⚡ icon) from the lower support zone around 117,000 seems to have initiated an upward move.
The zigzagging blue path shows a bullish scenario of higher highs and higher lows.
---
Summary:
The chart suggests bullish momentum building with a likely breakout from the ascending triangle pattern, targeting the 118,400 resistance level. Confirmation of the breakout would ideally come with strong volume and a close above 118,000.
Would you like a possible
Bitcoin price increaseAfter the tensions between traders in the United States and the strong price fluctuations in the dollar and other stocks, and after the 3-month increase in gold, this time it will be the turn of digital currencies to increase again and there are signs of their increase in the market. For Bitcoin, two increase targets can be considered: $110,000 - $120,000.
Sasha Charkhchian
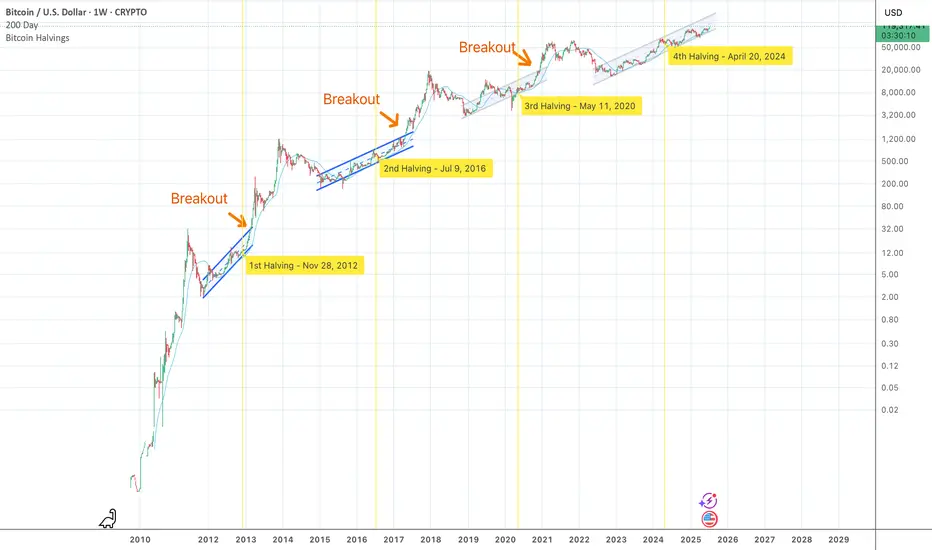
Decisive moments: breakout of longtime trendchannel or down downAs you can see we have been moving around a longtime trendchannel. Could this the needed outbreak? Or are we close to the end of the uptrend? We will know soon.... Anything could happen now. Don't BELIEVE... just look at the signs!
BTC/USD 1H: Uptrend Consolidation - Key Levels to WatchQuick Look at Bitcoin (BTC/USD) on the 1-Hour Chart - Kraken
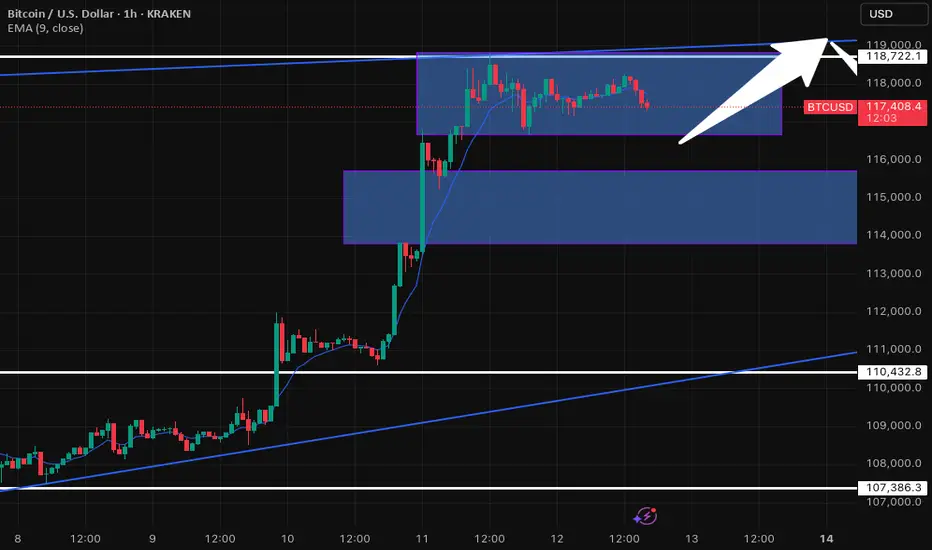
Alright, let's dive into what Bitcoin's doing on the 1-hour chart. We've seen BTC in a pretty solid uptrend lately, cruising nicely within that ascending channel. It recently had a fantastic run, pushing right past the $110,432.8 resistance level – a great sign!
But now, it looks like Bitcoin is taking a breather. It's currently consolidating in that upper blue box, roughly hanging out between $116,000 and $118,000. This kind of sideways movement often means the market is trying to figure out its next big move after a strong push. Are buyers reloading, or are sellers starting to step in? That's the big question.
Here's what I'm keeping an eye on:
On the Upside: The immediate hurdle is the top of this current consolidation range, right around $118,722.1, which also lines up with the upper trendline of our channel. If Bitcoin can break convincingly above that, we could see another leg up – definitely a bullish signal!
On the Downside: If it can't hold this range and starts to dip, the first area of interest for support is that lower blue box, roughly $114,000 to $115,000. That's where I'd expect some buyers to potentially step back in.
Stronger Safety Nets: Don't forget that $110,432.8 level. It was tough resistance before, so it should now act as a pretty strong support if we see a deeper pullback. And, of course, the bottom trendline of our ascending channel and $107,386.3 are there as well.
My Takeaway:
Bitcoin's in a strong position overall, but this consolidation is key. The next big move will tell us a lot. Keep an eye on those breakout or breakdown points – that's where the action will be!
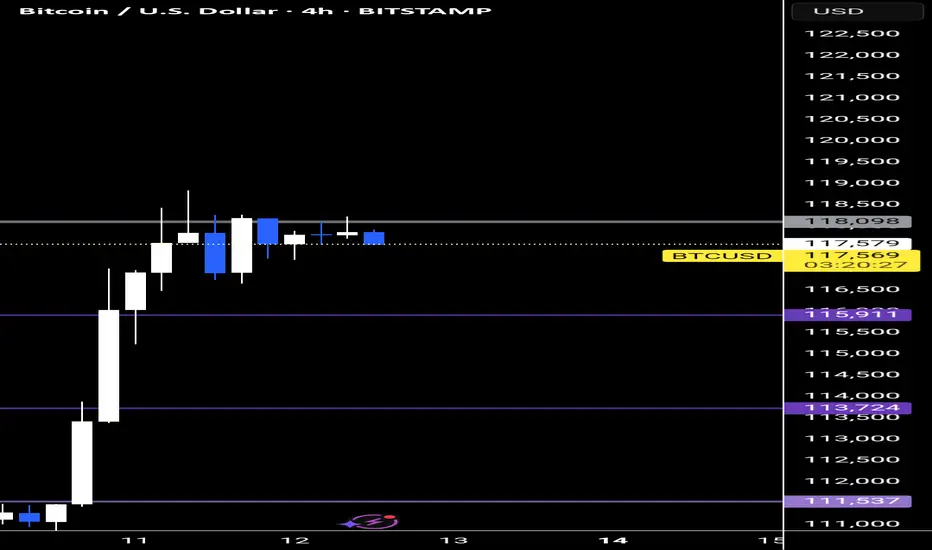
bitcoin down for 8 hrAfter sweep the liquidity above 118098. the price will correct may be to 115911 or more ...
for the next 8 hrs I expect it will reach the 1 hr order block at 115911.
entry : 118098- 117000
tk: 115911 or end of time cycle of 8hr
St: 118198
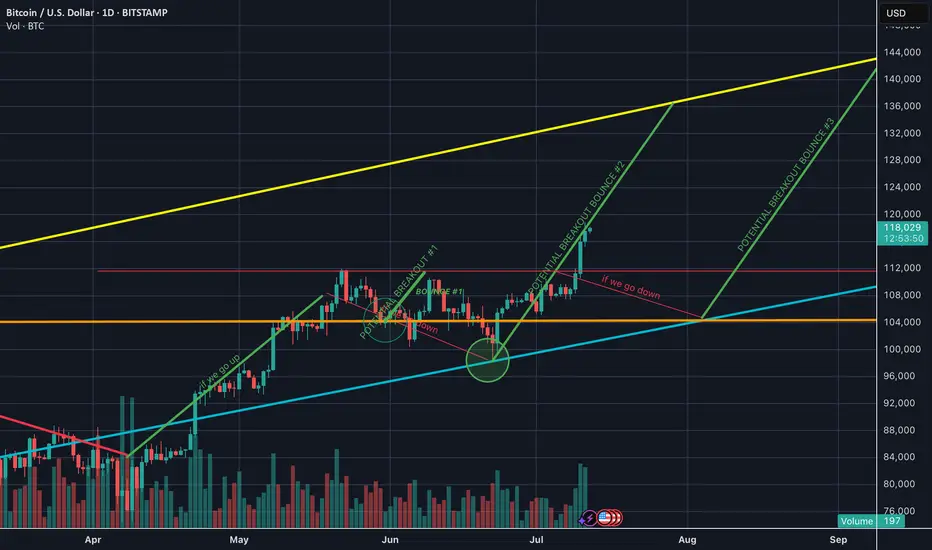
Would you Look at this ... 💁♂️💁♂️💁♂️ Ok, I have only taken 1 course of TA And somehow I am able to draw the perfect trajectory of the Course of BTC. Now the question is how high will we go... Follow for the next Prediction
I had predicted a breakout in bitcoin a few days agoI had predicted a breakout in bitcoin a few days ago, see its result on the chart today
The idea is super clear Bitcoin works with pattern repetition, currently defied the double top pattern and that's just the last solid confirmation needed to break the ice.
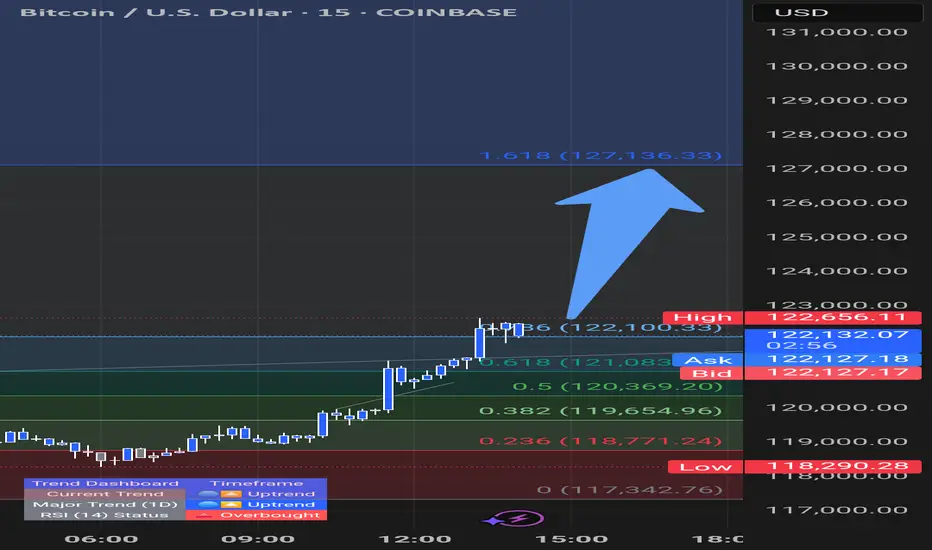
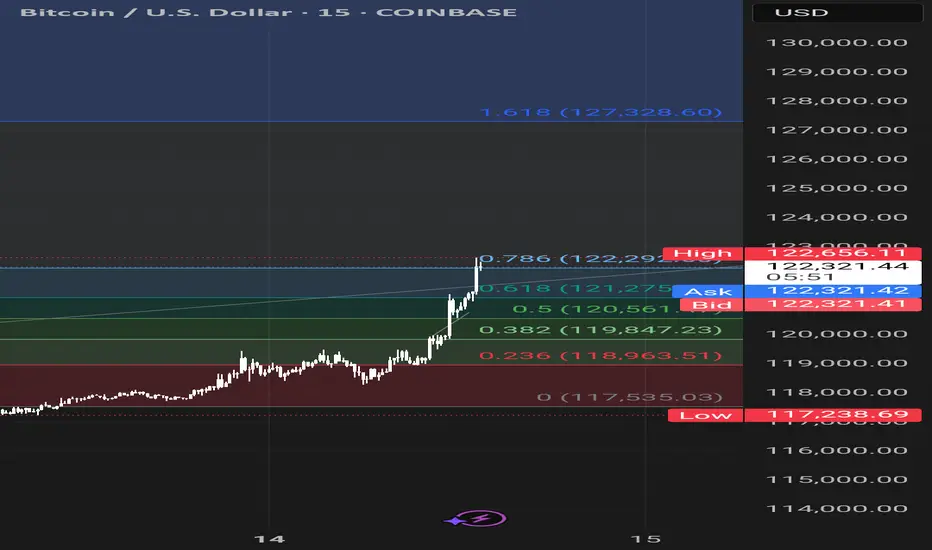
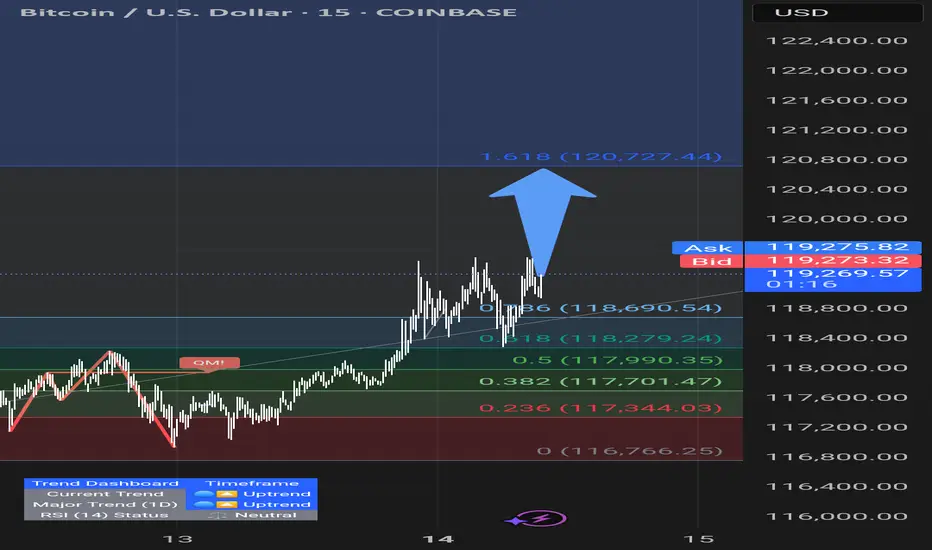
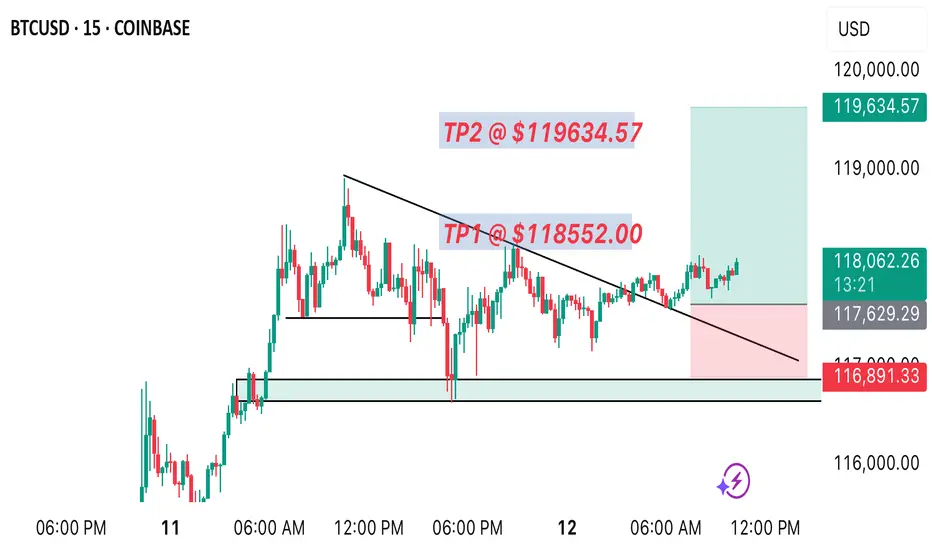
BTCUSD BUY OPPORTUNITY IN M15 TIMEFRAME!Price surged High with strong buy momentum in H4 timeframe and recently traded a new all time high. This provides us with a potential buy opportunity as price currently trades at 117392.00 our target profit is at 119634
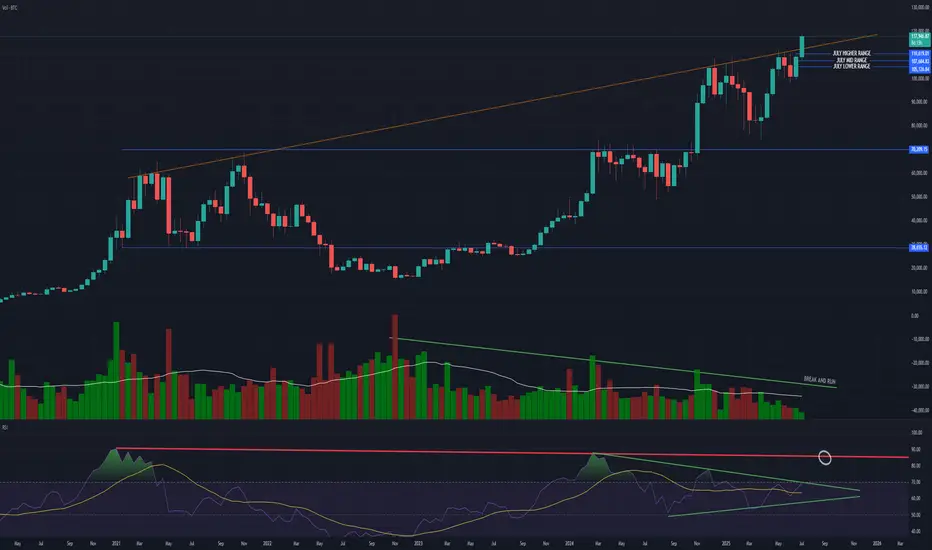
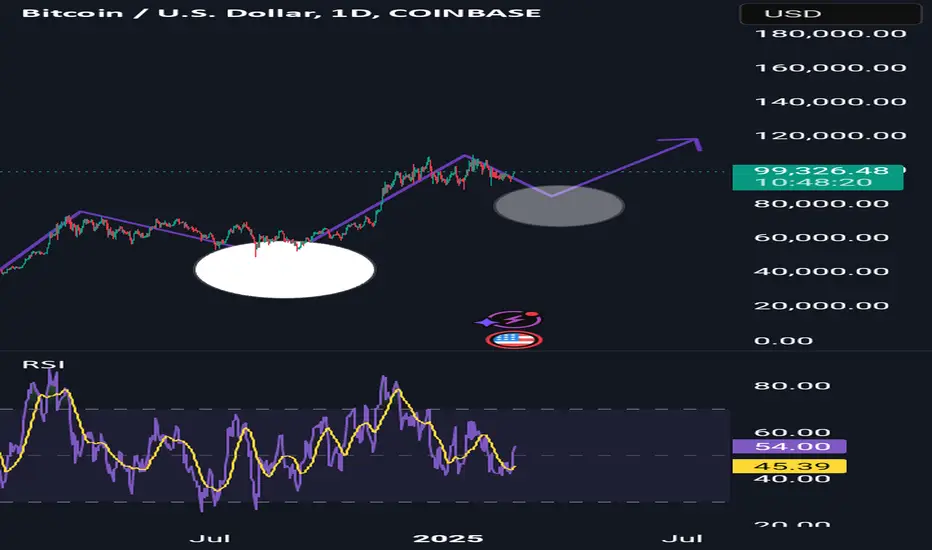
A Path into the TOP2W BTC - RSI is telling us we are at a pause - consolidation with a slight pullback is to be expected
RSI is tightening up and seems like it wants to consolidate a bit, maybe a slight dip down to run back up
The RSI here is not only giving direction its also giving us a possible top for price action into Oversold