BITCOIN trade ideas
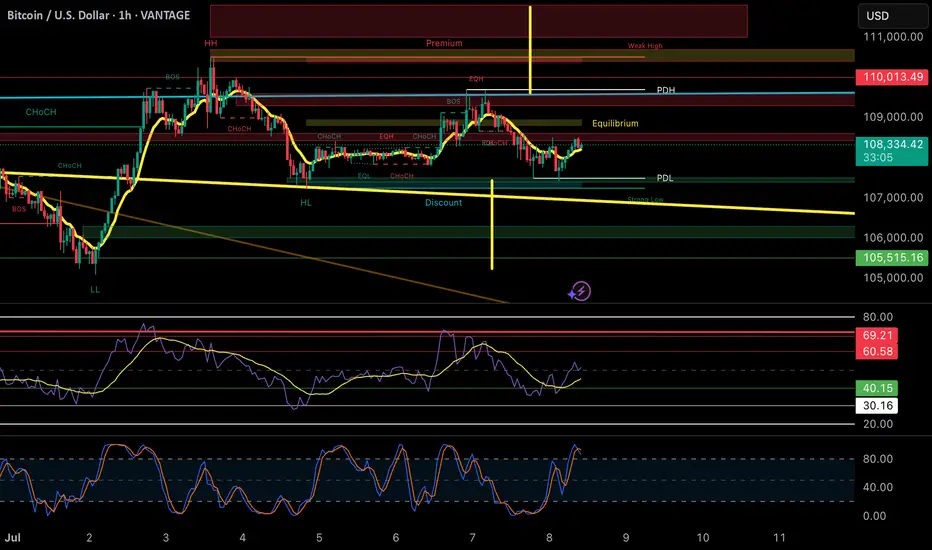
Analyst Highlight: Bitcoin Levels to Watch After new Highs $109KA close-up analysis of BTC's push beyond $109k: Short vs Long Mas, VWAP alignment, and potential retracement zones. Expert-scoped with easy-to-read annotations and key entry/exit gates- perfect for adding to your watchlist.

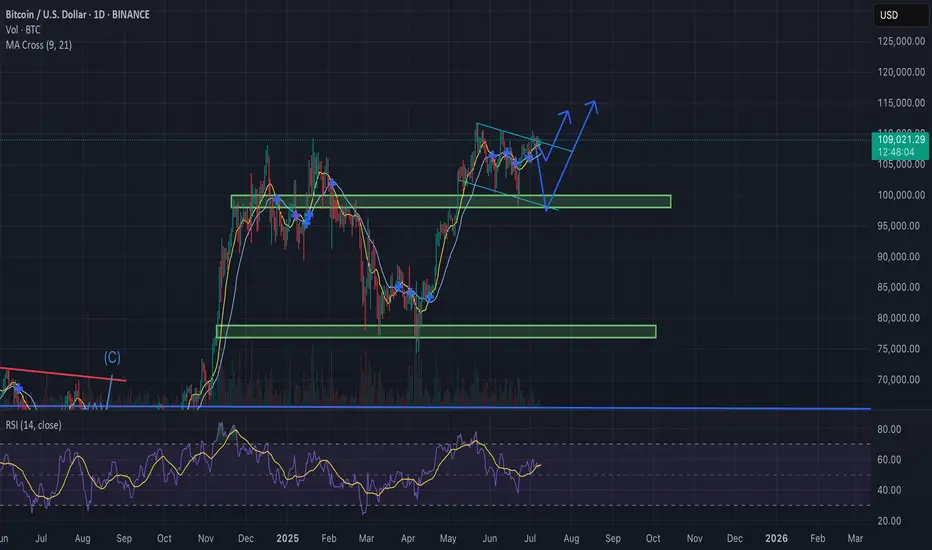
Bitcoin Update – Bullish Falling Wedge in Play?BTC/USD is currently trading near $108.8K, compressing within a falling wedge formation — historically a bullish continuation pattern, especially after a strong uptrend.
Why the Bias Remains Bullish:
Bullish MA Cross: Short-term MAs (9/21) are aligned for upside momentum.
Falling Wedge: Price compressing with lower highs and lows, coiling for a breakout.
RSI Strength: RSI (purple) remains elevated, supporting continued upside pressure.
Fundamental Catalysts:
Trump delays trade war announcements, reducing global uncertainty.
FOMC meeting in late July: Trump pushes for rate cuts, potentially bullish for risk assets like BTC.
If BTC breaks out above the wedge resistance with convincing volume:
Retest likely at ~$110K
Targets : $115K → $120K+
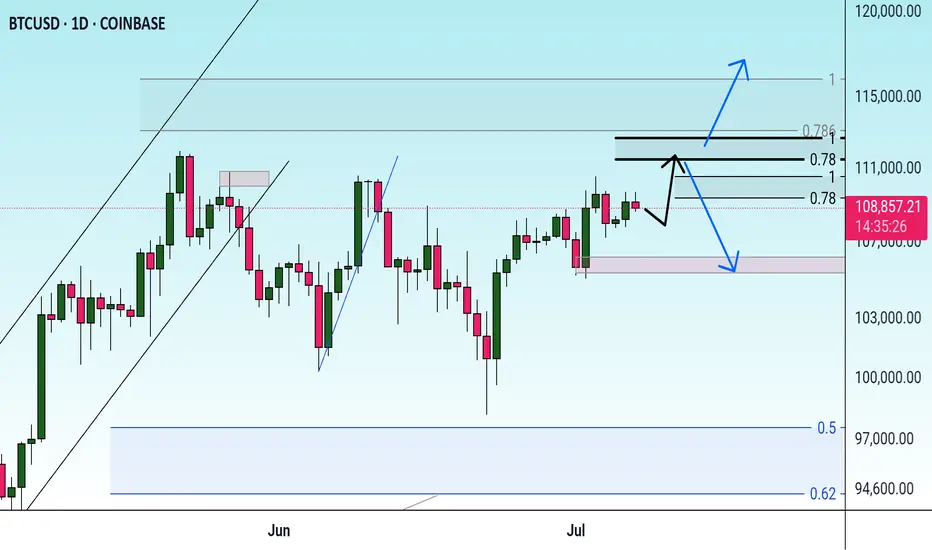
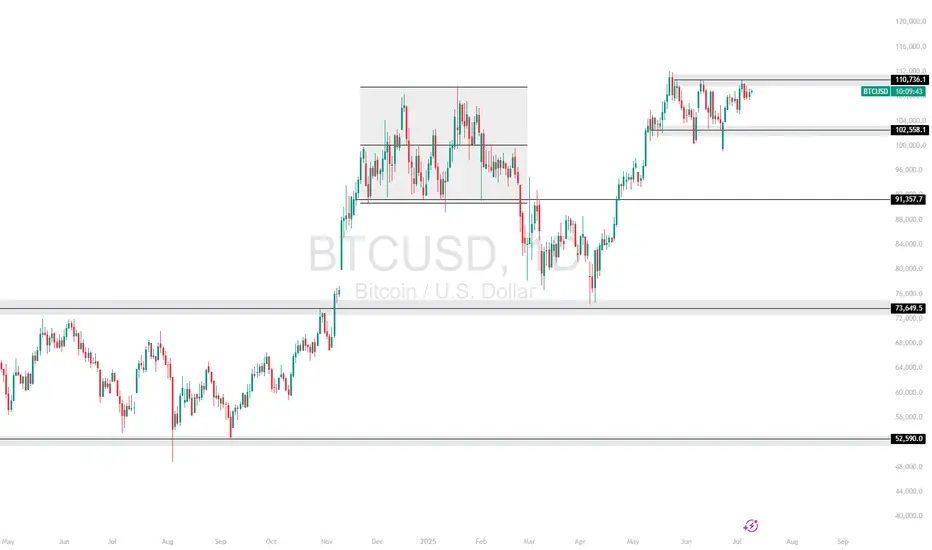
BTCUSD – Range High Retest at 110KBitcoin is consolidating below the 110,736.11 resistance after reclaiming support from the 102,558.1 zone. Price is holding a tight range, building pressure just under key resistance — a breakout above this could spark a move to new highs.
Support at: 102,558.1 🔽 | 91,357.7 🔽
Resistance at: 110,736.1 🔼 (range high)
🔎 Bias:
🔼 Bullish: Break and hold above 110,736.1 opens room for bullish continuation.
🔽 Bearish: A break back below 102,558.1 would suggest a potential shift toward 91,357.7 support.
📛 Disclaimer: This is not financial advice. Trade at your own risk.
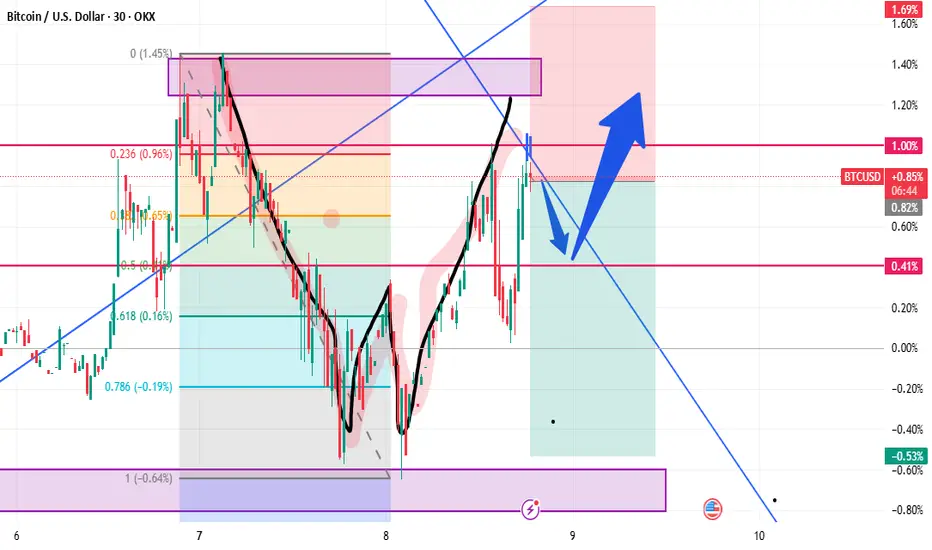
possibility of uptrendIt is expected that the triangle pattern will form according to the specified paths, then there will be a possibility of a trend change and the beginning of the upward trend.
If the price crosses the support area, the continuation of the downward trend will be likely.
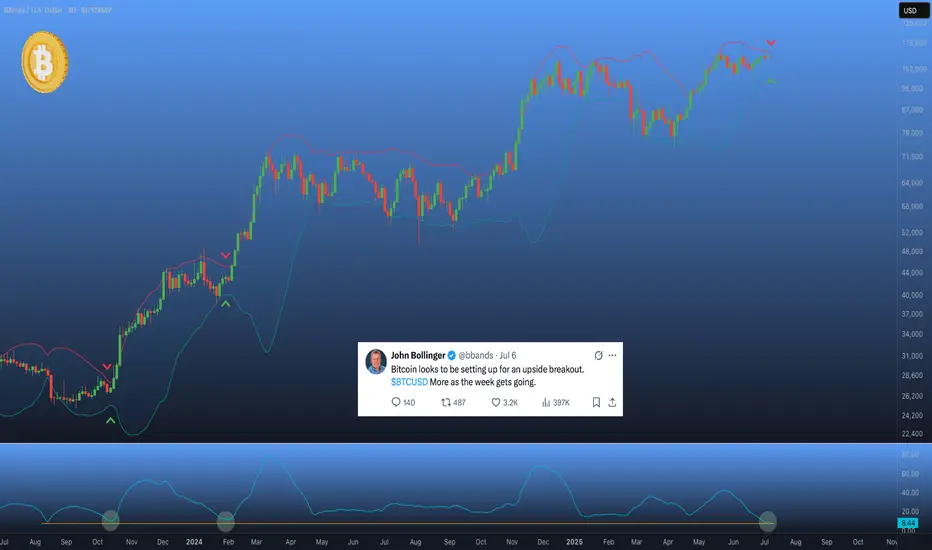
Bitcoin is ready for the breakout ?🤏 On #Bitcoin’s 3D chart, the Bollinger Bands have tightened to record levels — a signal that historically precedes massive moves. 🚀
📉 Volatility has also dropped to levels not seen since late 2024, right before #BTC launched from $26k to $70k.
✖️ Even John Bollinger himself, the creator of the indicator, hinted in his X post that a powerful impulse might be on the way.
Something’s brewing... 👀
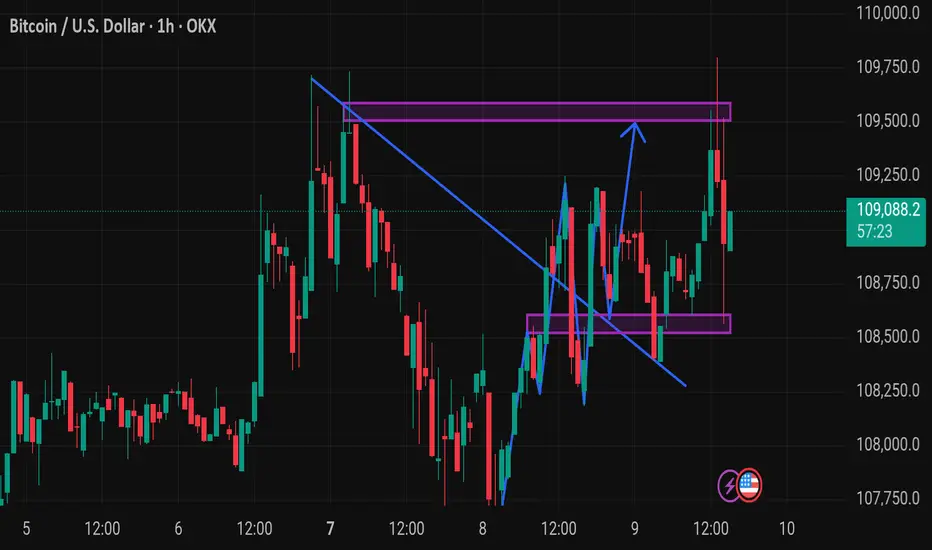
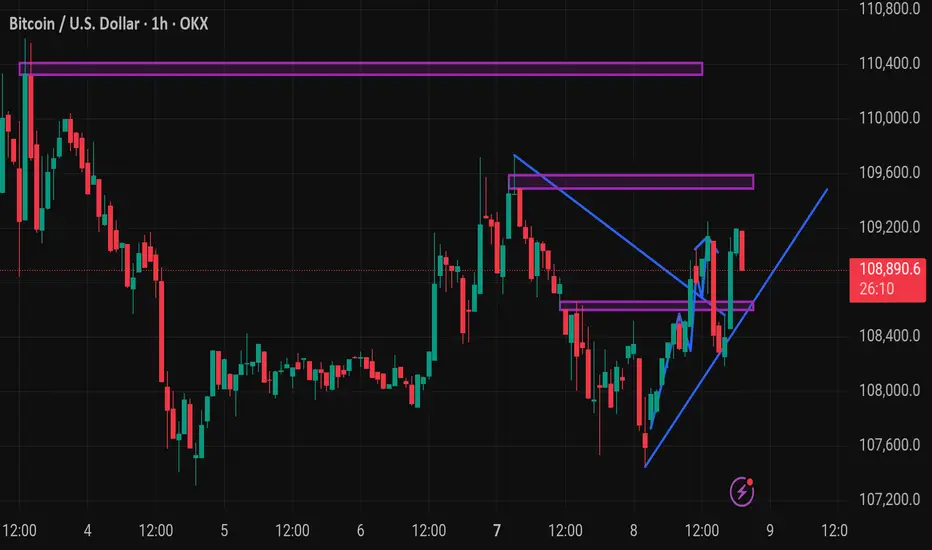
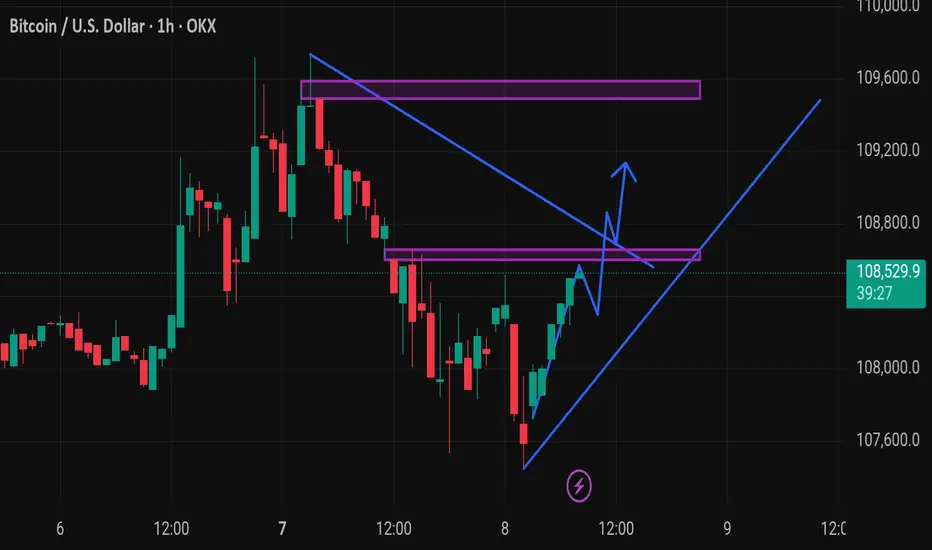
BTCUSD – Quiet Push After the StormBTC plunged from $110K into $105.5K, then ground sideways in a long accumulation zone. Recent breakout took price toward $109.2K, but it stalled and faded slightly. Still holding structure. Bulls want a clean break over $109.5K to challenge $110K again.
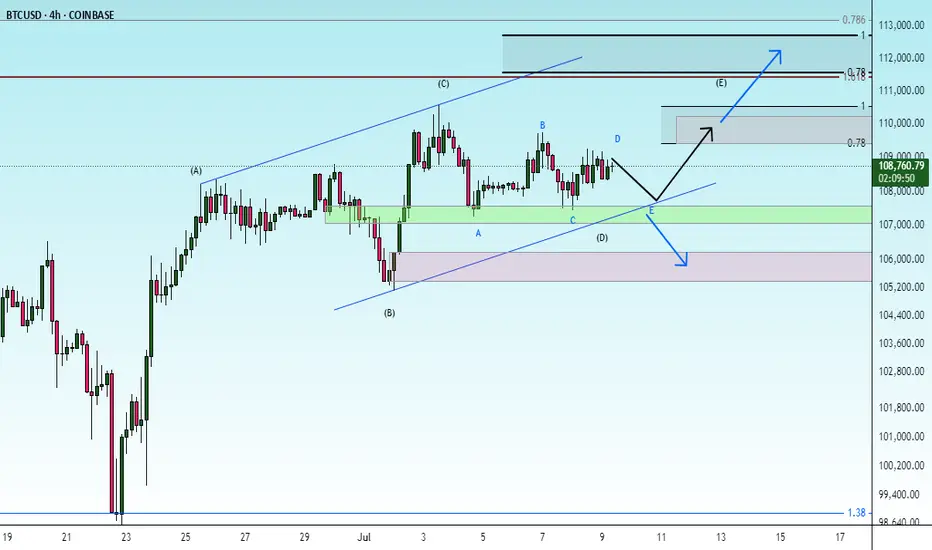
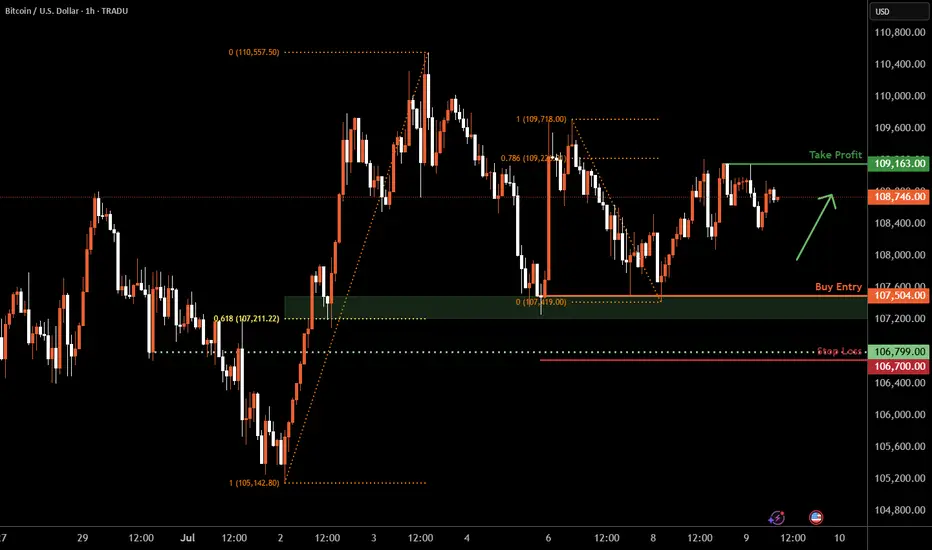
Bitcoin H1 | Potential bounce off a multi-swing-low supportBitcoin (BTC/USD) is falling towards a multi-swing-low support and could potentially bounce off this level to climb higher.
Buy entry is at 107,504.00 which is a multi-swing-low support that aligns closely with the 61.8% Fibonacci retracement.
Stop loss is at 106,700.00 which is a level that lies underneath an overlap support.
Take profit is at 109,163.00 which is a swing-high resistance that aligns with the 78.6% Fibonacci retracement.
High Risk Investment Warning
Trading Forex/CFDs on margin carries a high level of risk and may not be suitable for all investors. Leverage can work against you.
Stratos Markets Limited (tradu.com ):
CFDs are complex instruments and come with a high risk of losing money rapidly due to leverage. 63% of retail investor accounts lose money when trading CFDs with this provider. You should consider whether you understand how CFDs work and whether you can afford to take the high risk of losing your money.
Stratos Europe Ltd (tradu.com ):
CFDs are complex instruments and come with a high risk of losing money rapidly due to leverage. 63% of retail investor accounts lose money when trading CFDs with this provider. You should consider whether you understand how CFDs work and whether you can afford to take the high risk of losing your money.
Stratos Global LLC (tradu.com ):
Losses can exceed deposits.
Please be advised that the information presented on TradingView is provided to Tradu (‘Company’, ‘we’) by a third-party provider (‘TFA Global Pte Ltd’). Please be reminded that you are solely responsible for the trading decisions on your account. There is a very high degree of risk involved in trading. Any information and/or content is intended entirely for research, educational and informational purposes only and does not constitute investment or consultation advice or investment strategy. The information is not tailored to the investment needs of any specific person and therefore does not involve a consideration of any of the investment objectives, financial situation or needs of any viewer that may receive it. Kindly also note that past performance is not a reliable indicator of future results. Actual results may differ materially from those anticipated in forward-looking or past performance statements. We assume no liability as to the accuracy or completeness of any of the information and/or content provided herein and the Company cannot be held responsible for any omission, mistake nor for any loss or damage including without limitation to any loss of profit which may arise from reliance on any information supplied by TFA Global Pte Ltd.
The speaker(s) is neither an employee, agent nor representative of Tradu and is therefore acting independently. The opinions given are their own, constitute general market commentary, and do not constitute the opinion or advice of Tradu or any form of personal or investment advice. Tradu neither endorses nor guarantees offerings of third-party speakers, nor is Tradu responsible for the content, veracity or opinions of third-party speakers, presenters or participants.
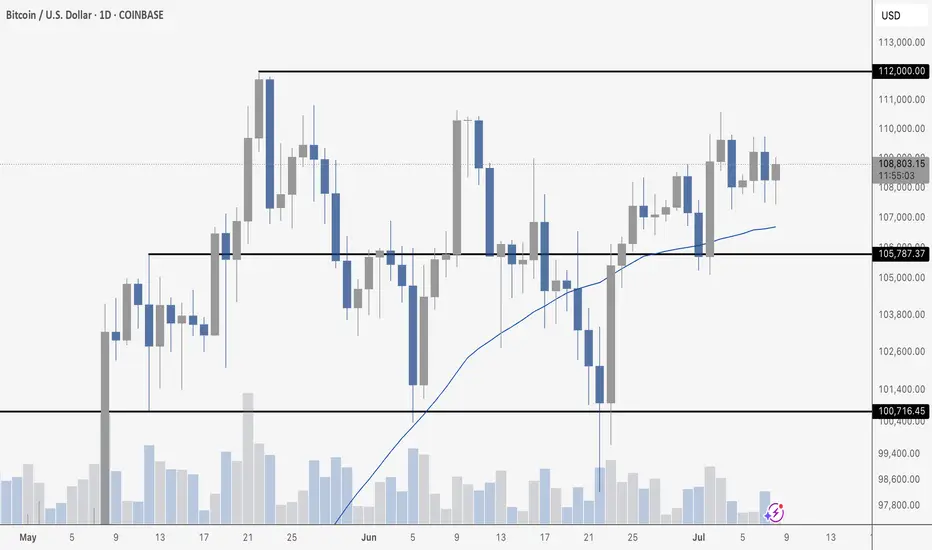
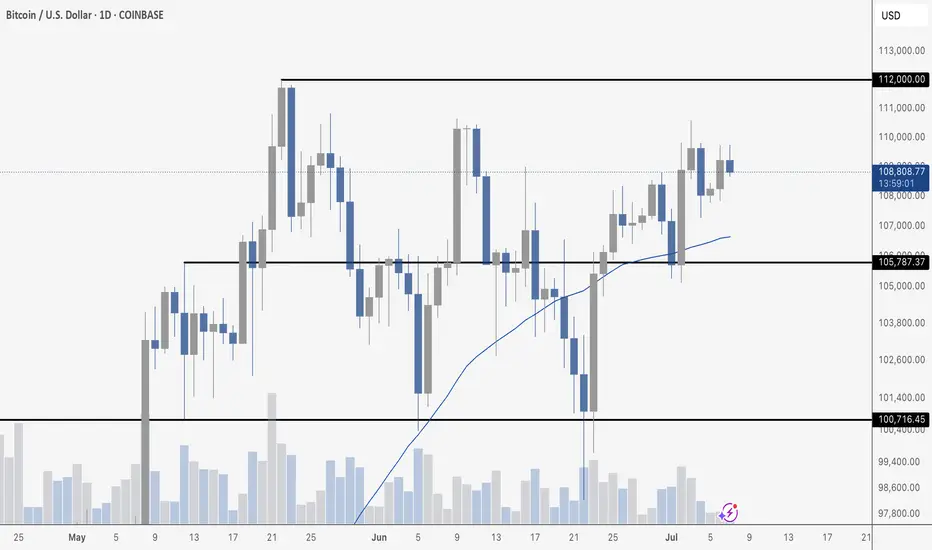
Bitcoin ConsolidatingBitcoin continues to hold strong just below resistance at $112K after a clean reclaim of the $105,787 support zone and the 50-day moving average. Price is consolidating in a tight range, printing higher lows and showing signs of strength as it flirts with a potential breakout.
Volume has tapered off slightly during this sideways action, which is typical in a coiling pattern before a move. If bulls can finally push through $112K with conviction, we’re likely headed for a fresh leg higher. On the flip side, a drop back below the 50 MA and $105K would invalidate the short-term bullish structure.
Until then, it’s just a waiting game inside this range – but the bias leans bullish.
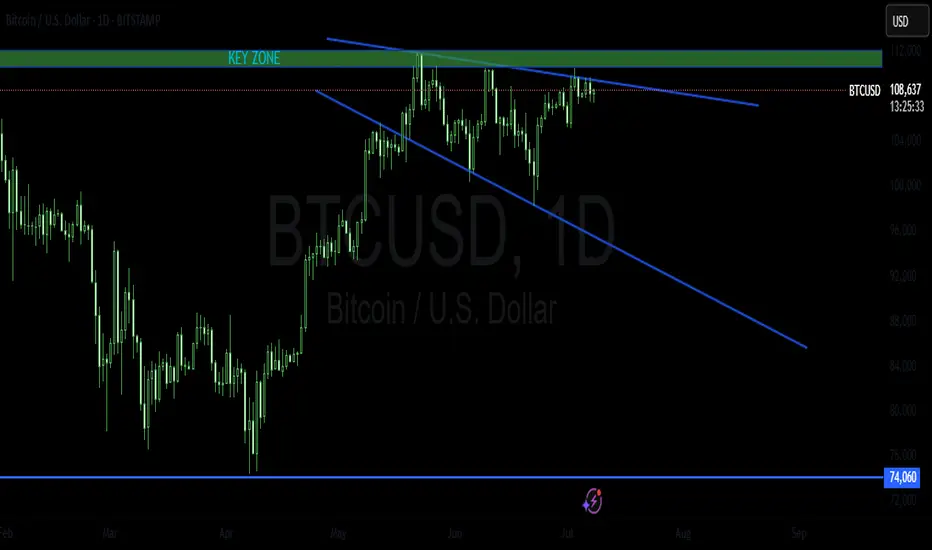
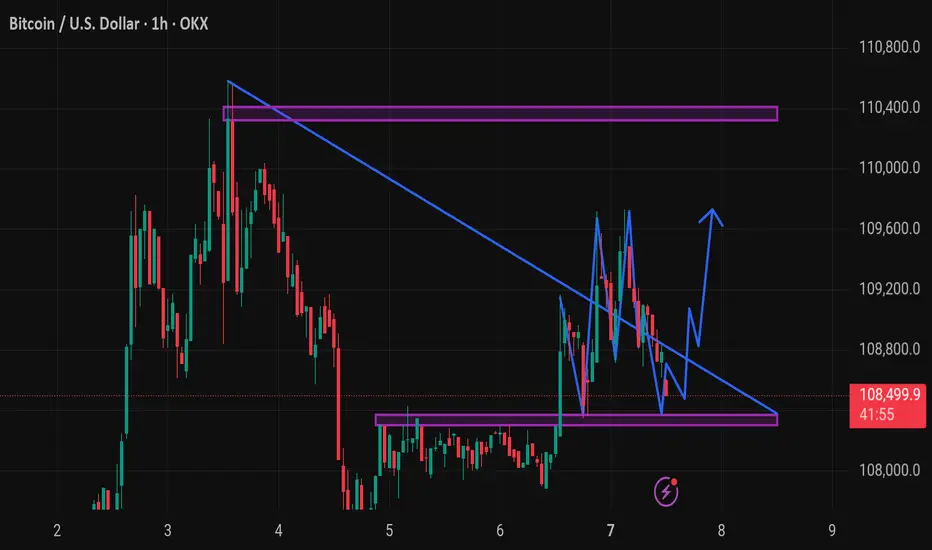
BTCUSD LONG TRADE PLANFollowing a classic technical view. The instrument has been trading in a global bull trend. Recently, it formed a descending expanding wedge pattern next to a key zone which I view as an accumulation.
When to buy ? In my view, I will only buy if breakout of this pattern and break above the key zone.
Please do your own analysis before placing any trades.
Cheers and Happy Trading !!!!
BTC 106/105 before athI seeing a down move towards 106k and 105.5k before we make a new ath (fakeout to 115k) before we start breaking down into bear season
Btcudt techinical analysis.Btcusd techinical analysis next move posibale at h1 time frame.not finchinal advice.
Market ViewWatch
Trade
Manage
Smile
Good morning, service to all of God creature take another level in life of purpose., we all got our role. Make the decision today.

Market ViewWatch
Trade
Manage
Smile
@Odesina Folorunsho Alabi
The scale of interpretation and trade execution is at each individual hands, we got to make the call either right or wrong, take charge.

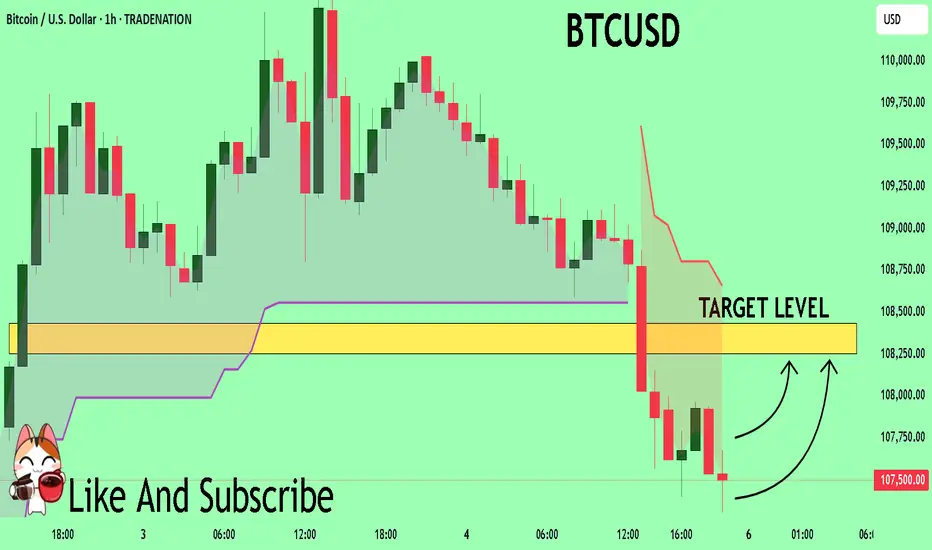
BTCUSD What Next? BUY!
My dear subscribers,
My technical analysis for BTCUSD is below:
The price is coiling around a solid key level - 10750
Bias - Bullish
Technical Indicators: Pivot Points Low anticipates a potential price reversal.
Super trend shows a clear buy, giving a perfect indicators' convergence.
Goal - 10825
About Used Indicators:
By the very nature of the supertrend indicator, it offers firm support and resistance levels for traders to enter and exit trades. Additionally, it also provides signals for setting stop losses
Disclosure: I am part of Trade Nation's Influencer program and receive a monthly fee for using their TradingView charts in my analysis.
———————————
WISH YOU ALL LUCK
Btcusd techinical analysis.Btcusd techinical analysis next move posibale at h1 time frame.not finchinal advice.
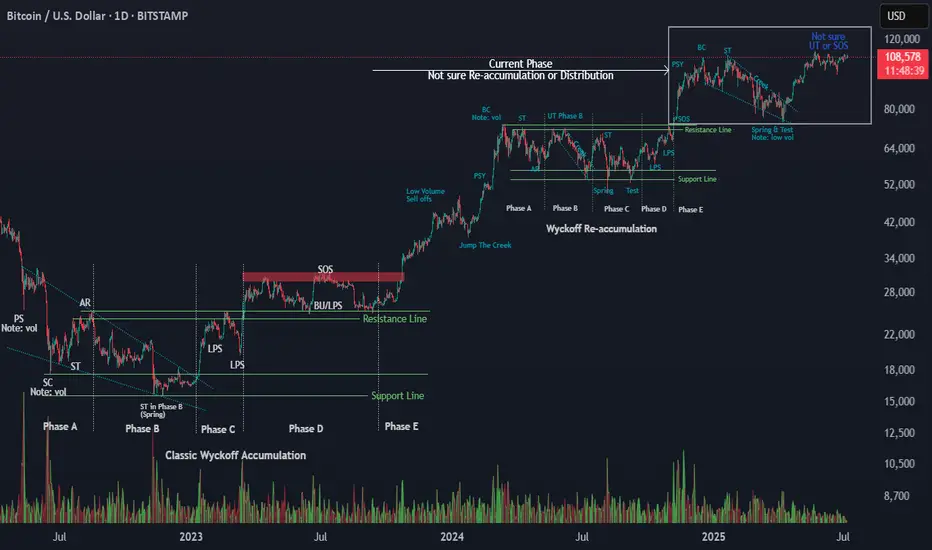
Wyckoff Logic – Test PhaseI won’t say much — the chart speaks for itself.
Based on my ongoing study of Wyckoff methodology, it appears that Bitcoin is currently in the Test phase within a re-accumulation structure. This suggests the Mark-Up phase is not yet complete, and we may still have room for price expansion before the next major distribution.
This is not a prediction, but a reference for structural context using classical Wyckoff logic.
As always, price confirmation and volume behavior will be the key to validate the next move.
Observations:
Strong support zone holding after Spring/Test
Price respecting higher lows
Volume profile supports continuation
Feel free to share your perspective below 👇
#Wyckoff #Bitcoin #BTC #Reaccumulation #MarketStructure #PriceAction #TradingView #CryptoTA
BTC CHOPSBitcoin is quietly grinding higher, holding above the key $105,787 level after reclaiming it with authority. Price is consolidating just under $112,000 resistance, pressing against the top of the range while riding the 50-day moving average like a support rail.
The dip to $100,716 was a trap. Buyers stepped in hard, and price hasn’t looked back. But without a decisive close above $112K, this remains a waiting game. A breakout sends us flying. A rejection brings $105K and $100K back into view. No need to guess - just let the levels speak.
Possibility of correction The uptrend is expected to continue to the specified resistance levels. Then, a trend change and the start of a downtrend are likely. If the price consolidates above the resistance level, the uptrend may continue.