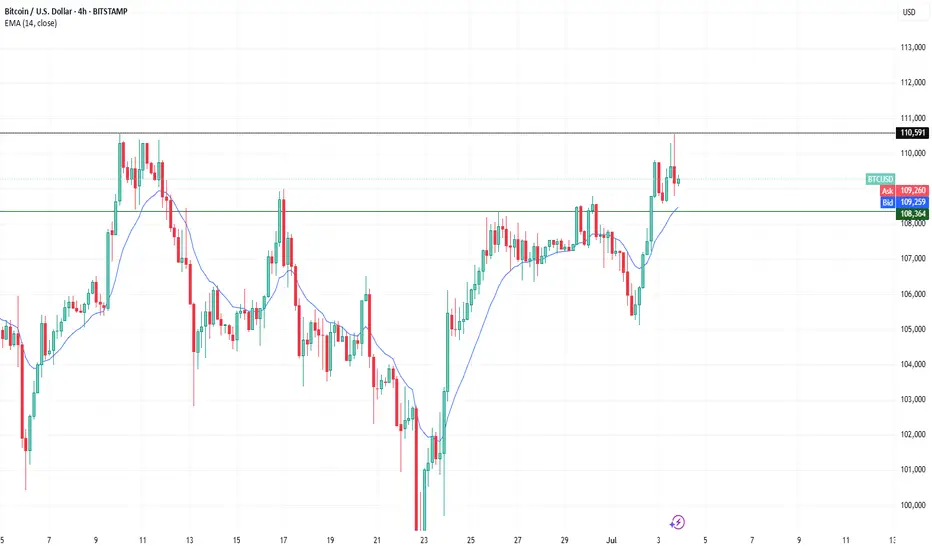
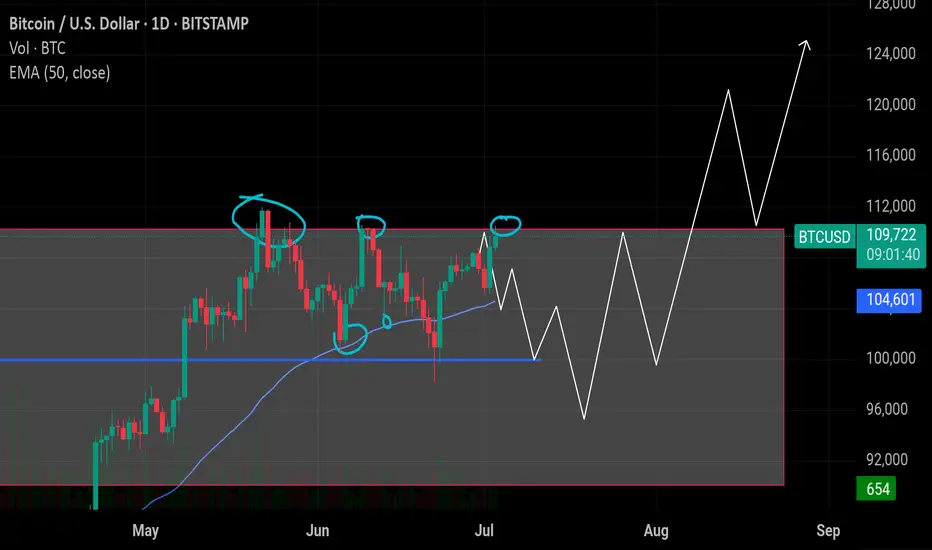
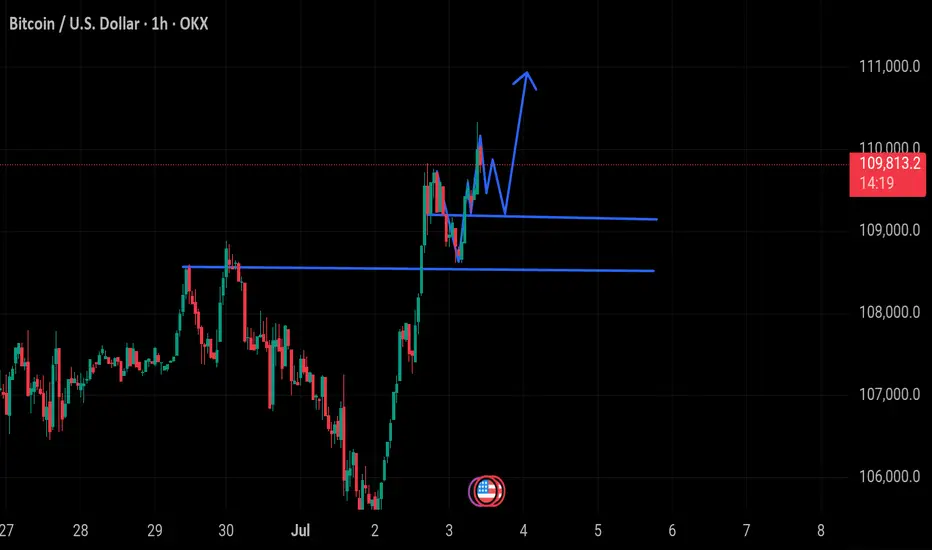
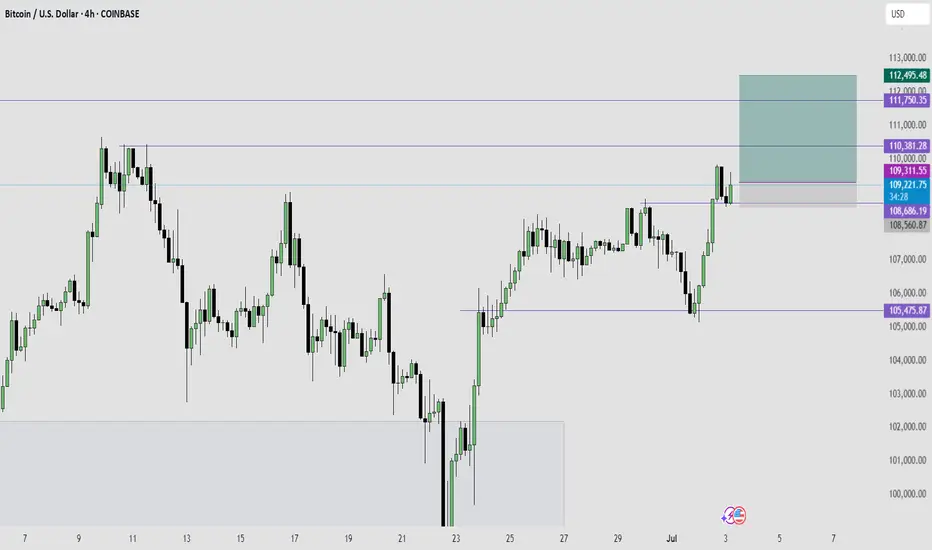
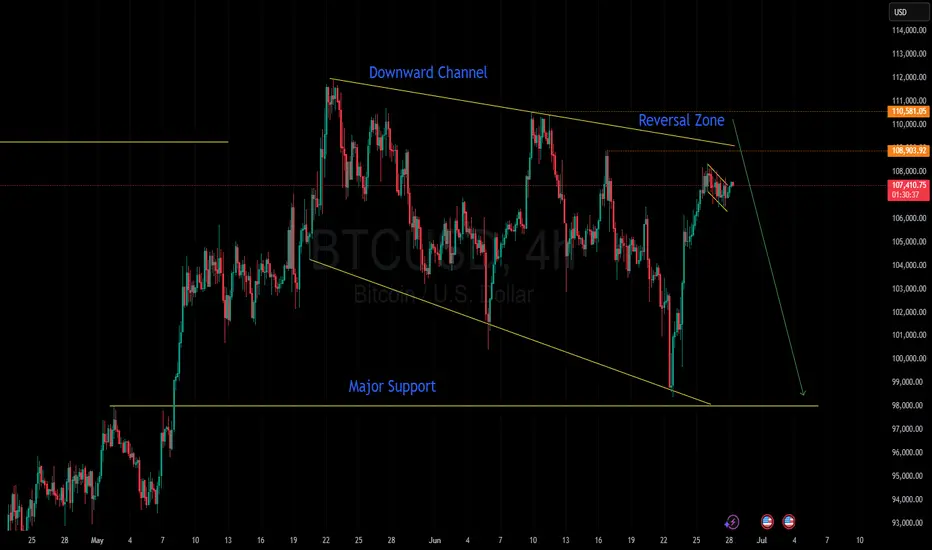
BTC/USD 4H – Key Decision Zone | Trade Plan/BUY & SELL ScenarioBitcoin is at a critical decision point as price hovers around the $109,000 zone on the 4H chart.
After a strong bullish recovery and a clean structure of higher highs, BTC is currently consolidating just below major resistance at $111,893. Price action is squeezing between dynamic EMA14 support and horizontal supply, indicating a potential breakout or breakdown.
Sell if 4H candle closes below $108,500 with body confirmation.
BITCOIN trade ideas
Navigating BTC the Volatile Path to a Potential $117,000 PeakBitcoin at a Crossroads: Navigating the Volatile Path to a Potential $117,000 Peak
Introduction: A Tale of Two Forces
The world of Bitcoin is once again a theater of high drama. After a breathtaking surge that brought the digital asset tantalizingly close to its all-time high, the market now stands at a pivotal crossroads, caught in a tense tug-of-war between powerful bullish undercurrents and formidable macroeconomic headwinds. On one side, a confluence of unprecedented institutional adoption, potent on-chain signals, and a volatile derivatives market suggests an imminent price explosion. Analysts and investors whisper of a short-term upper bound of $117,000, with some seeing a potential tap of $116,000 as early as July amid a ‘perfect storm’ of macro catalysts. A move to this level would represent a significant 6.45% jump from Bitcoin’s recent price, a leap that seems entirely within reach when viewed through the lens of the asset's internal momentum.
Yet, on the other side stands the unyielding wall of global economic reality. Bitcoin’s recent attempt to decisively conquer the $110,000 level was swiftly reversed as strong U.S. jobs data and other factors tempered expectations of a near-term Federal Reserve rate cut. This macroeconomic reality has cast a long shadow over risk assets, including Bitcoin, creating significant resistance at the previous all-time high of around $112,000. Analysts point to an absence of new, retail-driven buyers and the kind of "FOMO-driven greed" that characterized previous bull runs as a key factor pinning the price down.
This creates a fascinating and high-stakes dichotomy. The very structure of the Bitcoin market has undergone a "paradigm shift," with institutional exchange-traded funds (ETFs) providing a steady, relentless stream of demand. At the same time, the asset remains tethered to the decisions of central bankers and the health of the global economy. This article will delve into the intricate layers of this conflict, exploring the powerful bull case built on on-chain data and market structure, the sobering macroeconomic headwinds, the psychological barrier of the all-time high, and the long-term predictions that see Bitcoin potentially reaching $200,000. As the market braces for pivotal events like the upcoming Jackson Hole Economic Symposium, the question on every investor's mind is which of these two powerful forces will ultimately dictate Bitcoin's next monumental move.
The Bull Case: A Cauldron of On-Chain and Derivatives Strength
Bitcoin’s impressive rally was not a random speculative whim; it was underpinned by a bedrock of strong on-chain and technical signals that paint a compelling picture of underlying market health and explosive potential. These indicators, which provide a transparent view into the blockchain’s activity, suggest that the current price action is just the beginning.
On-Chain Analysis: The Blockchain's Transparent Ledger
On-chain analysis is the practice of examining the public and immutable data on a blockchain to understand the behavior of network participants. Unlike traditional financial markets, where investor actions are opaque, Bitcoin’s ledger allows for a granular assessment of transaction volumes, wallet balances, and investor profitability, offering a data-driven glimpse into market sentiment.
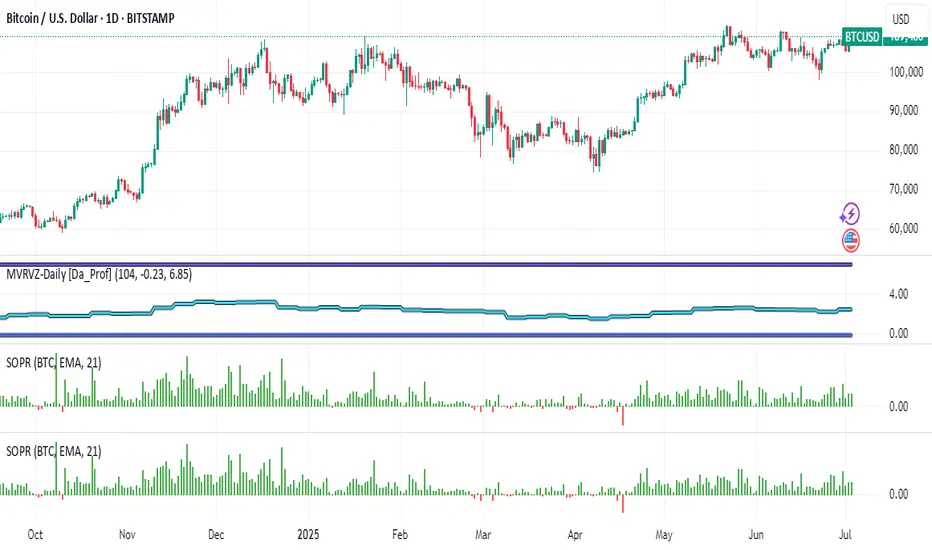
Two of the most powerful on-chain metrics in this context are the Market Value to Realized Value (MVRV) ratio and the Spent Output Profit Ratio (SOPR).
The MVRV ratio is a fundamental valuation tool that compares Bitcoin's total market capitalization to its "realized capitalization." While market cap is the current price multiplied by all coins in circulation, realized cap values each coin at the price it was last moved on-chain. Essentially, MVRV compares the current market price to the average cost basis of all investors. A high MVRV ratio suggests the market is overheated, while a ratio below 1.0 signifies that the average investor is underwater, a condition often seen at market bottoms.
The Spent Output Profit Ratio (SOPR) offers a more immediate look at market behavior by analyzing the profitability of transactions occurring on the network. It is calculated by dividing the sale price of a Bitcoin by the price it was last acquired.
• When SOPR is greater than 1, it means that, on average, coins being sold are in profit.
• When SOPR is less than 1, it means coins are being sold at a loss.
• A SOPR value of 1 acts as a critical psychological level. In bull markets, the market often "bounces" off this line, as investors are reluctant to sell at a loss, creating strong support.
The Derivatives Market: Funding Rates and the Looming Short Squeeze
Beyond the blockchain itself, the cryptocurrency derivatives market provides another layer of bullish sentiment. This market is dominated by perpetual futures contracts, which use a funding rate mechanism to stay tethered to the spot price.
• Positive Funding Rate: When the futures price is higher than the spot price, longs pay shorts, indicating dominant bullish sentiment.
• Negative Funding Rate: When the spot price is higher than the futures price, shorts pay longs, indicating dominant bearish sentiment.
Paradoxically, a deeply negative funding rate can be an extremely bullish contrarian indicator. A crucial historical precedent exists: Bitcoin price rallied 80% the last time BTC funding rates flipped red. When funding rates are negative, it means a large number of traders are shorting the market. If the price begins to rise against them, these short sellers must buy back Bitcoin to close their positions and limit their losses.
This forced buying can trigger a "short squeeze." A large cluster of potential short liquidations has been identified near the $111,320 level, with an estimated $520.31 million in leveraged positions at risk. If the price can push through this zone, it could trigger a cascade of liquidations, providing the fuel to accelerate Bitcoin’s next leg higher into price discovery. This mechanism represents one of the most powerful potential catalysts for a rapid move toward the $116K-$117K target.
The Macroeconomic Maelstrom: A "Perfect Storm" of Headwinds
While Bitcoin’s internal metrics flash green, its path is being obstructed by a formidable storm of macroeconomic factors. In today's interconnected financial world, no asset is immune to the policies of central banks. The recent reversal from the push beyond $110,000 is a stark reminder of this reality, as markets began to discount the odds of the Federal Reserve lowering interest rates.
The Federal Reserve and Interest Rate Jitters
For the past several years, the price of Bitcoin has been highly correlated with monetary policy. A policy of low interest rates generally creates a favorable environment for assets like Bitcoin by lowering the opportunity cost of holding them compared to bonds or savings accounts. Conversely, a period of monetary tightening—characterized by higher interest rates—has a negative effect on Bitcoin's price.
The market's sensitivity to this was on full display when strong U.S. economic data reinforced the case for keeping rates "higher for longer" to contain inflation. This immediately took the wind out of Bitcoin’s sails and halted the rally. An unexpected rate cut, however, could send Bitcoin back toward its all-time high of $112,000.
All Eyes on Jackson Hole
This brings into focus the immense importance of the Jackson Hole Economic Symposium. This annual conference is a crucial event where central bankers from around the globe discuss pressing economic issues and signal future policy directions. Speeches from key figures, particularly the Federal Reserve Chair, are scrutinized by global markets for clues about the future of monetary policy.
The anticipation surrounding the event highlights its high stakes for risk assets. Market participants will be listening for any hint of a dovish pivot (a signal that rate cuts are back on the table) or a hawkish stance (a reinforcement of the "higher for longer" narrative).
• A dovish signal could be the catalyst that reignites Bitcoin's rally by weakening the dollar and sending risk assets soaring.
• A hawkish signal, on the other hand, could reinforce the current headwinds, potentially leading to a deeper correction for Bitcoin.
The Great Wall of $112K: Why All-Time Highs Are Hard to Break
Every seasoned market participant knows that previous all-time highs (ATHs) are not just numbers on a chart; they are formidable psychological barriers. For Bitcoin, the level around $112,000 represents this wall. Breaking through it requires immense momentum, and the current struggle to do so is explained by a critical missing ingredient: widespread, retail-driven Fear of Missing Out (FOMO).
The Psychology of an All-Time High
An ATH represents a point of maximum financial opportunity and maximum regret. This creates a powerful and complex dynamic:
1. Profit-Taking: Long-term holders and traders who bought at lower prices see the ATH as a prime opportunity to realize their gains.
2. Break-Even Selling: Investors who bought at or near the previous peak may be eager to sell as soon as their position returns to break-even.
3. Hesitation from New Buyers: For new investors, buying at an all-time high feels inherently risky, leading to hesitation.
Overcoming this selling pressure requires a massive wave of new demand, a force often fueled by pure, unadulterated FOMO.
The Absence of FOMO-Driven Greed
FOMO, or the "Fear of Missing Out," is the force that turns a rally into a parabolic ascent, characterized by a surge in retail interest and media saturation. Analysts suggest that a key reason Bitcoin can’t break the $112K all-time high is the absence of new buyers and FOMO-driven greed. While there have been spikes in retail enthusiasm, the kind of euphoric mania seen at the peak of previous cycles has yet to fully materialize in 2025. Without that surge of irrational exuberance, there may not be enough buying pressure to absorb the natural selling that occurs at an all-time high, creating a stalemate.
The Paradigm Shift: How Institutional ETFs Changed the Game
While the lack of retail FOMO explains the resistance at the all-time high, the very reason Bitcoin reached this level so quickly is due to a fundamental, game-changing development: the approval and launch of spot Bitcoin Exchange-Traded Funds (ETFs) in the United States. This event represents a true "paradigm shift" in market structure, providing a powerful counterbalance to the whims of retail sentiment.
A spot Bitcoin ETF directly holds Bitcoin and allows investors to gain exposure through traditional brokerage accounts, dramatically simplifying the investment process. This has had a revolutionary impact:
1. Accessibility and Legitimacy: ETFs have democratized access to Bitcoin for a massive new audience and conferred a new level of legitimacy on the asset class.
2. Unlocking Institutional Capital: Most importantly, ETFs created a regulated pathway for institutional investors to allocate capital to Bitcoin.
The impact has been staggering, with massive ETF inflows directly fueling Bitcoin's price appreciation. In a recent two-month period, for instance, U.S.-based spot Bitcoin ETFs recorded nearly $10 billion in inflows. This is not the fickle demand of a retail FOMO cycle; it is the steady, calculated allocation of capital from major financial players, providing a strong floor for the price.
Gazing into the Crystal Ball: Near and Long-Term Price Horizons
With these conflicting forces shaping the market, analysts are looking at both short-term technical targets and long-term fundamental models to chart a potential path forward.
Short-Term Targets: The Path to $117,000
The immediate upper bound for Bitcoin is pegged by many analysts at $117,000, with some suggesting a move to $116K in July is possible. This target is derived from a combination of technical analysis, historical seasonal trends, and the potential for a short squeeze. A decisive break above the $112,000 all-time high would clear the path for a rapid move toward this level.
The Long-Term Vision: A $200,000 Call
Looking further ahead, some of the most bullish predictions from institutional players call for Bitcoin to hit $200,000 by the end of 2025. This forecast is not based on short-term chart patterns but on a fundamental assessment of supply and demand in this new era. The reasoning is that there is simply too much institutional demand to keep prices flat for long, a trend driven by the continued success of spot Bitcoin ETFs and growing regulatory clarity.
Interestingly, this bullish institutional sentiment for Bitcoin is not always extended to other major cryptocurrencies. Some outlooks are less confident that assets like Ethereum (ETH) and Solana (SOL) will hit new all-time highs this year. Challenges such as network reliability issues and the lack of similar institutional products are cited as reasons for a more tempered outlook on these other assets. This suggests a potential future where Bitcoin's performance decouples from the broader altcoin market, driven primarily by its unique status as an institutional-grade digital asset.
Conclusion: The Great Tension and the Path Forward
Bitcoin's current market position is one of profound tension. In the world of its own blockchain and market structure, the signals are bullish. A new era of institutional demand, evidenced by billions flowing into spot ETFs, has created a paradigm shift. This is reinforced by a derivatives market primed for a potential short squeeze.
However, Bitcoin does not exist in a vacuum. It is also a participant in the broader financial ecosystem, where a hawkish Federal Reserve has put a damper on risk-on sentiment. This macroeconomic resistance is amplified by the psychological barrier of the all-time high, where natural profit-taking meets the absence of the retail-driven FOMO that defined past cycles.
The resolution of this conflict will define the next chapter for Bitcoin. A catalyst could come from the Jackson Hole Symposium, a sudden acceleration in ETF inflows, or a shift in the macroeconomic landscape. What is certain is that Bitcoin is no longer just a retail phenomenon; it is a maturing asset on the global stage, navigating a complex interplay of internal strength and external pressures. Whether it reaches $117,000 in the coming months or faces a setback, its journey will be a masterclass in the collision of technology, finance, and human psychology.
BTC Falling wedgeBtc formed a falling wedge pattern and also tested the Resistance become support, and also in the major trend has broken the trendline.
$BTC is testing the key $110K resistance — a daily close above iCRYPTOCAP:BTC is testing the key $110K resistance — a daily close above it could trigger a breakout toward $115K–$120K. If rejected, a dip to $105K–$100K offers a strong long opportunity. Bullish structure holds unless price breaks below $99K.
BITCOINSpeculators are net short on BTC (bearish sentiment).
The short position has increased slightly, indicating growing bearishness.
✅ Bias Summary:
BTC Bias: Bearish and increasing in bearish momentum.
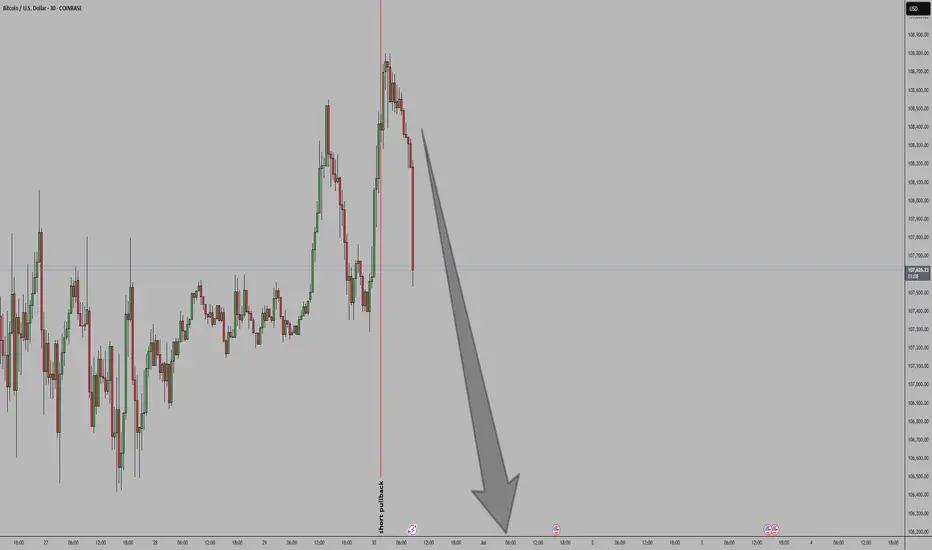
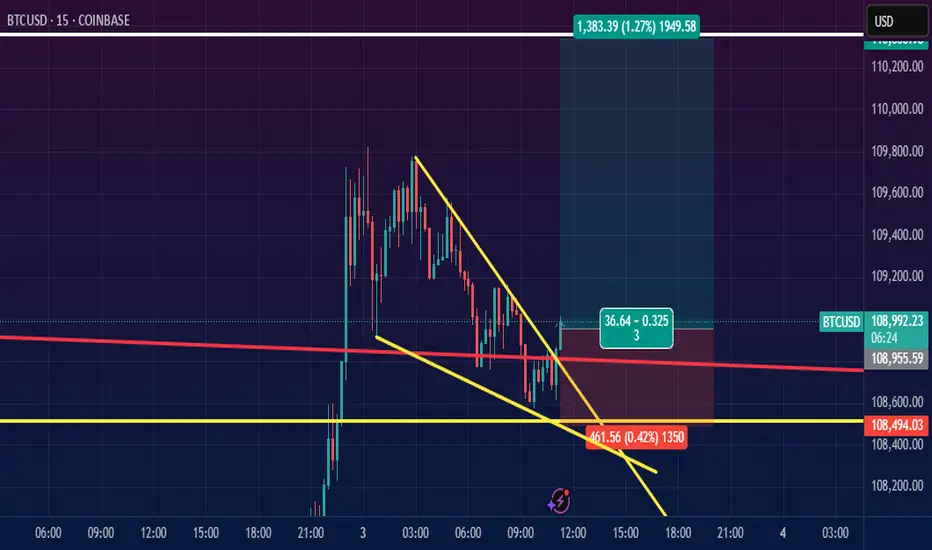
BTCUSD 7/3/2025Come Tap into the mind of SnipeGoat, as he gives you a Wonderful update to his 7/1/2025 call-out which PLAYED OUT PERFECTLY!!!! If you are not convinced by now, what are you doing...
_SnipeGoat_
_TheeCandleReadingGURU_
#PriceAction #MarketStructure #TechnicalAnalysis #Bearish #Bullish #Bitcoin #Crypto #BTCUSD #Forex #NakedChartReader #ZEROindicators #PreciseLevels #ProperTiming #PerfectDirection #ScalpingTrader #IntradayTrader #DayTrader #SwingTrader #PositionalTrader #HighLevelTrader #MambaMentality #GodMode #UltraInstinct #TheeBibleStrategy

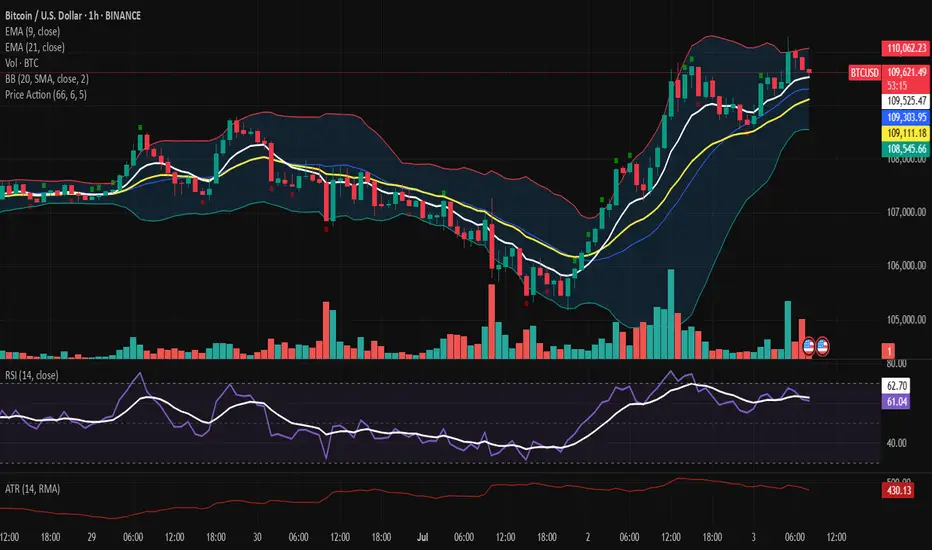
Bitcoin Between Strength and Suspension Tactical Inflow Anomaly.⊣
⟁ BTC/USD – BINANCE - (CHART: 1H) – (Jul 03, 2025).
◇ Analysis Price: $109,716.55.
⊣
⨀ I. Temporal Axis – Strategic Interval – (1H):
▦ EMA 9 – ($109,510.76):
∴ Price remains above EMA9, sustaining the short-term bullish impulse;
∴ The EMA 9 is ascending with consistent candle-body support across recent sessions.
✴ Conclusion: Tactical momentum persists as long as price holds above EMA9 on closing basis.
⊢
▦ EMA 21 – ($109,064.37):
∴ EMA 21 serves as dynamic support, unbroken since the July 2nd surge;
∴ Distance between EMA9 and EMA21 confirms preserved trend integrity.
✴ Conclusion: No structural weakness observed; trend foundation remains intact under current volatility.
⊢
▦ Volume – (Visual estimation, TradingView):
∴ Volume surged during July 2 rally; subsequent bars show diminishing interest;
∴ Last high-volume candle aligns with recent local top attempt.
✴ Conclusion: Buyer aggression is fading. Volume must return for any continuation to be credible.
⊢
▦ Bollinger Bands (20, 2.0) – (Upper: $110,050.15 / Lower: $108,545.25):
∴ Price recently tapped upper band and pulled back slightly without breakdown;
∴ Bands are widening after expansion, indicating active volatility but no climax.
✴ Conclusion: System operates in elevated volatility regime, with breakout potential still valid if supported.
⊢
▦ Price Action (66, 6, 5) – (Visual structure, local range):
∴ Price formed a clean higher low and higher high sequence starting July 2nd, confirming bullish microstructure;
∴ Current candles show upper wick formation at ~$110,050, indicating rejection and absorption at resistance.
✴ Conclusion: Uptrend structure is valid but approaching short-term exhaustion. If support holds at $109,100–108,900, continuation remains viable.
⊢
▦ RSI + EMA9 – (RSI: 62.69 / EMA: 63.27):
∴ RSI dipped below its own EMA9, indicating weakening strength in recent hours;
∴ RSI remains above 60, preserving bullish territory but signaling caution.
✴ Conclusion: Early-stage exhaustion detected. Zone of hesitation active.
⊢
▦ ATR (14, RMA) – (447.69):
∴ Average volatility is still elevated relative to June baseline;
∴ Slight decline in ATR may suggest slowing force behind directional moves.
✴ Conclusion: Tactical volatility is active but not expanding. Suitable for traps or distribution setups.
⊢
🜎 Strategic Insight – Technical Oracle:
∴ The structural setup holds a bullish bias with dynamic supports (EMA9/EMA21) intact;
∴ Bollinger expansion and RSI positioning signal a zone of heightened interest, but the fading volume and early RSI crossover inject caution;
∴ This is a tactically suspended state where continuation is possible but dependent on incoming confirmation volume.
⊢
⟁ II. ARCANVM SIGNAL - (Bitcoin Inflow +5,000):
∴ Current Hourly Inflow: 20,788.10 BTC;
∴ Structural Threshold (30EMA): ~3,200 BTC;
∴ Trigger Threshold: ≥ 5,000 BTC.
✴ Conclusion and Interpretation: This event constitutes a critical liquidity anomaly under the Silent Sentinel Protocol. While it does not inherently dictate trend direction, its magnitude-6.5x above the structural average-configures:
∴ A probable institutional move for redistribution or liquidity unlocking;
∴ Elevated risk for short-term distortion events, particularly across the H1–H4 timeframes;
∴ An urgent need to monitor subsequent Netflow, to confirm whether real outflow pressure follows.
⊢
∫ III. On-Chain Intelligence – (Source: CryptoQuant):
▦ Exchange Netflow Total - (All Exchanges):
∴ Current: +555 Bitcoin net inflow;
∴ The ARCANVM inflow (+20,788 Bitcoin) has not been fully absorbed or reversed.
✴ Conclusion: Some liquidity remains inside exchanges. Potential for redistribution or silent preparation.
⊢
▦ Exchange Reserve - (All Exchanges):
∴ Continuously declining; current: ~2.44M Bitcoin;
∴ The inflow did not shift the macro trend of reserve depletion.
✴ Conclusion: Structural scarcity preserved. Inflow likely tactical and non-systemic.
⊢
▦ Futures Perpetual Funding Rate 7D-SMA - (All Exchanges):
∴ Holding near 0.01% – neutral bias;
∴ No evidence of directional crowding in perpetuals.
✴ Conclusion: Perpetual markets in tactical balance. Spot-driven price action dominates.
⊢
🜎 Strategic Insight – On-Chain Oracle:
∴ Despite the aggressive ARCANVM signal, the absence of structural reversals in reserves and neutral derivatives positioning confirms the move is non-structural.
∴ Markets remain in equilibrium.
∴ No emergent directional force-just silent posture-shifting.
⊢
⧈ Codicillus Silentii – Strategic Note:
∴ This is a state of tactical ambiguity. Breakout or failure depends on external triggers, as neither volume nor derivatives offer decisive guidance.
∴ The structure listens, not speaks.
⊢
▦ Tactical Range Caution:
∴ Resistance Watch Level: $110,050;
∴ Tactical Support: $109,100;
∴ Structural Alert Level: $108,400.
⊢
𓂀 Stoic-Structural Interpretation:
∴ Structurally Bullish – Tactically Suspended;
⊢
⧉
⚜️ Magister Arcanvm – Vox Primordialis!
𓂀 Wisdom begins in silence. Precision unfolds in strategy.
⧉
⊢
Btcudt techinical analysis.Btcusdt techinical analysis next move posibale at h1 time frame.not finchinal advice.
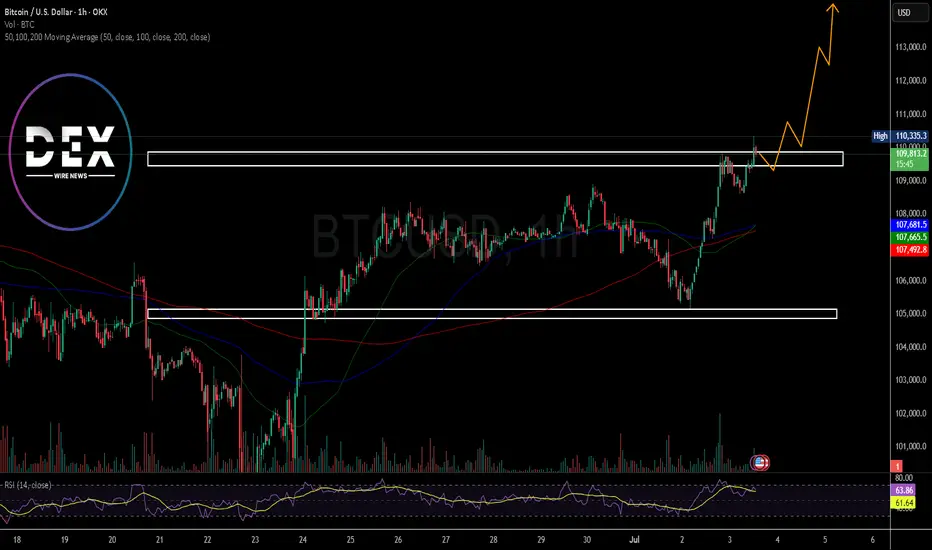
Breaking: Bitcoin Just Broke the $110k Resistant Next Top $115kThe price of the first crypto currency ever created saw a noteworthy uptick to reclaim the $110k price point however, the move was short-lived as the asset retraced to $109k mark but present price chart depicts a move to the $115k resistant point in the short term.
With the Relative strength index (RSI) at 63, Bitcoin might be inches away from claiming the $115k pivot amidst build up momentum and institutional adoption. further bullish metrics include the asset trading above the 50, 100 and 200-day Moving Averages (MA) respectfully.
Btcusdt techinical analysis.Btcusdt techinical analysis target successfully achived at h1 time frame.
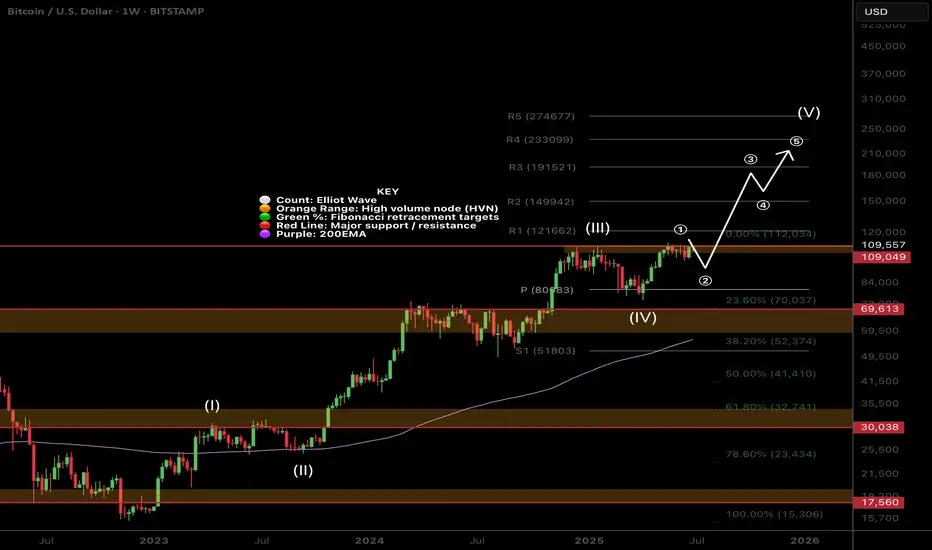
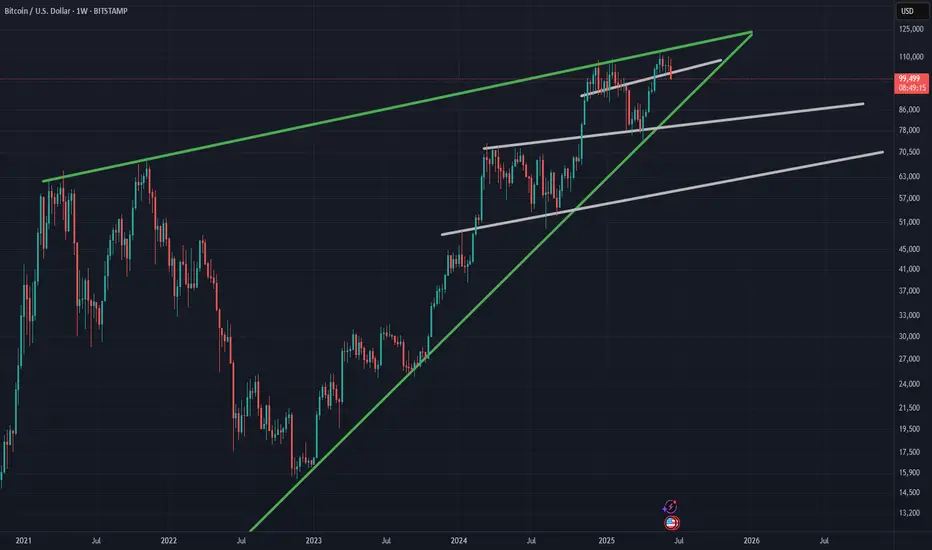
$BTC Weekly Continues to follow the script!BTC appears to have completed a shallow wave 2 retracement showing investor excitement and demand - They just can't wait to buy some!
New all time highs are expected this week (perhaps today) once the High Volume Node resistance we are currently at is overcome (obviously).
Wave 3 has an expected target of the R3 pivot $190k but i am expecting price to overextend this cycle to at least the R4 pivot at $233k.
Safe trading
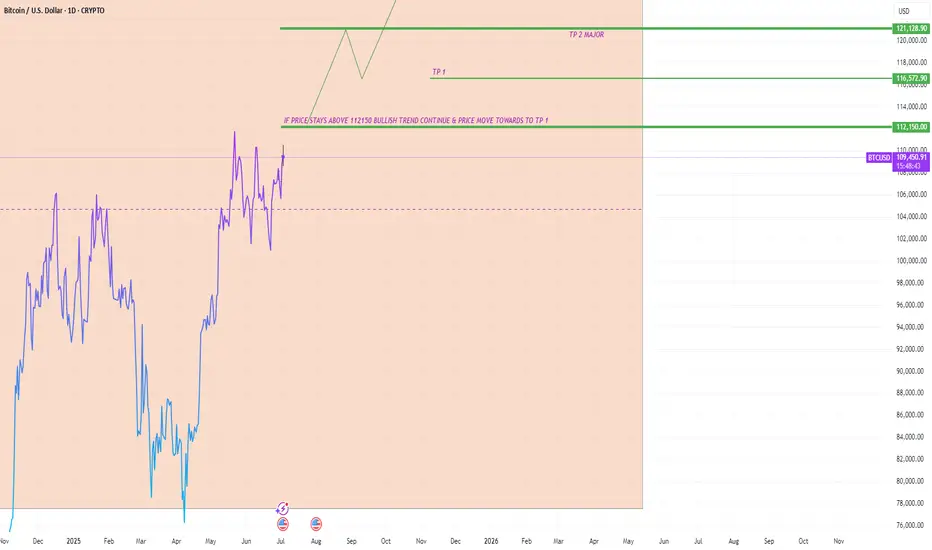
BTCUSD Trade Setup Idea on 1D Timeframe - Bullish MomentumBitcoin (BTCUSD) is currently trading at $109,348, showing strong bullish momentum on the 1H chart. The recent breakout from consolidation signals potential continuation, provided key resistance levels are breached and held.
Must Consider Analysis Timeframe : 1Day.
Strictly follow the trading rules for Entry..... only on Retracement.
SL on Previous or Close swing low.
🔍 Key Levels to Watch:
Bullish Continuation Confirmation: If price sustains above 112,150, we expect bullish momentum to accelerate.
Target 1 (TP1): 112,150 – Key breakout level that may act as support once reclaimed.
Target 2 (TP2 - Major): 121,128 – Long-term resistance and major profit-taking zone.
📊 Trade Logic:
A confirmed breakout and hold above 112,150 indicates strong buyer interest and could drive price toward 116,572 and 121,128.
The trend remains bullish as long as price holds above the breakout structure.
REMEMBER:- RESPECT THE LEVELS, LELEVLS RESPECT YOU THEN.
💡 Strategy: Monitor for retests and bullish candle confirmations above 112,150 to add or enter long positions with proper risk management.
! Disclaimer & Important Note:
This analysis is for educational and informational purposes only. It does not constitute financial advice or a recommendation to buy or sell any financial instrument. All trading involves risk. We are not responsible for any kind of loss incurred, whether financial, emotional, or otherwise. Always do your own research and consult with a licensed financial advisor before making any trading decisions.
Trading involves significant risk, and you should never invest more than you can afford to lose. Past performance is not indicative of future results.
The trade idea shared above reflects personal market interpretation and is subject to change based on new market conditions.
Posted by: THEPATELCRYPTO, 45Degree
Stay safe. Trade smart.
Follow for more ideas!
📍Posted by: THEPATELCRYPTO, 45Degree
📈 Stay safe. Trade smart.
🔔 Follow for more ideas!
BTC LONG TRADE IDEAThis is a bullish trend continuation trade idea on BTC.
Trend across all higher time frame is bullish.
major ouchieUS involvement in the middle east just might spell the end for the bull portion of this current halving cycle
this structure is looking very precarious
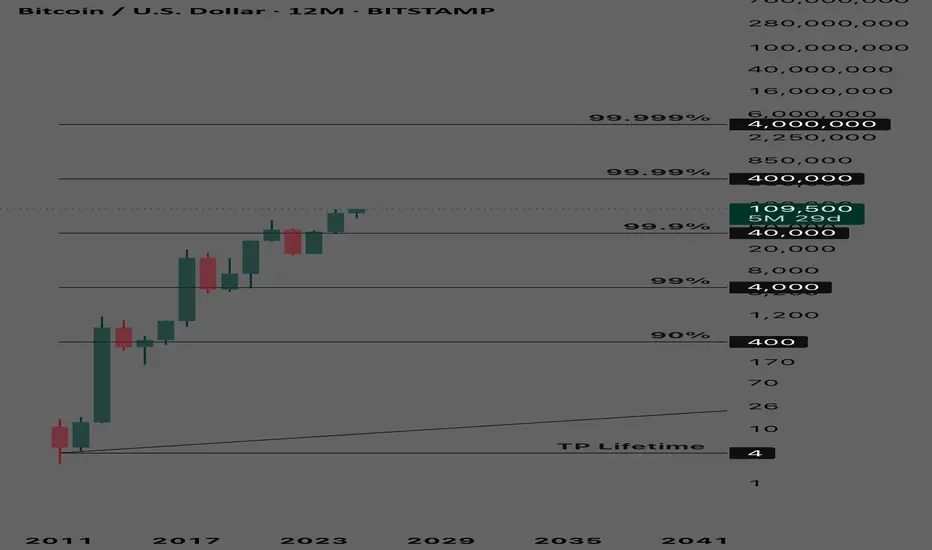
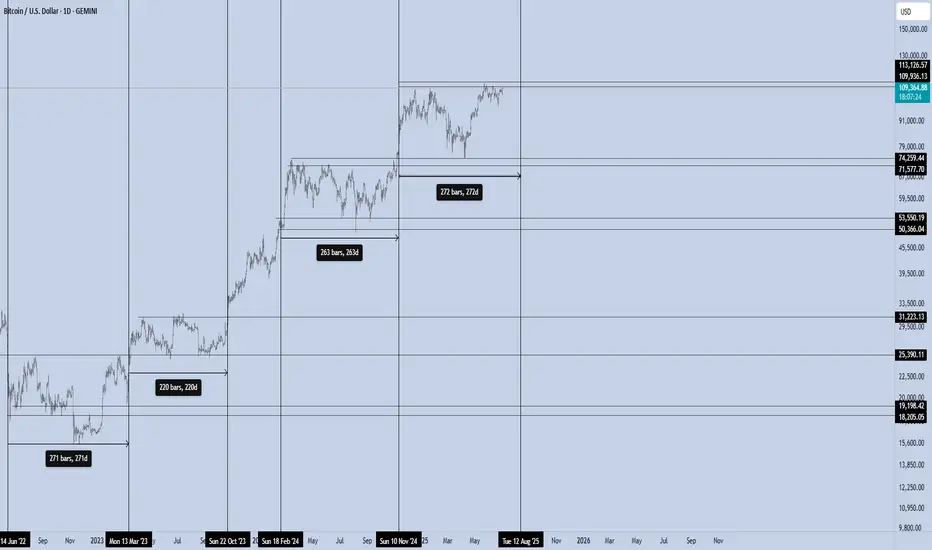
Bitcoin – The 270/100 CycleBitcoin isn’t just trading. It’s pulsing — in cycles that reward those who understand timing as much as price.
Over the last two years, BTC has shown a repeating pattern with surgical precision:
Range Phase:
Each macro consolidation lasts ~220 to 270 days, where price builds structure, absorbs supply, and prepares for its next expansion. This is the quiet phase — the zone where conviction is tested, and weak hands exit.
Impulse Phase:
What follows is a ~100-day vertical leg, where BTC surges between +50% to +80%, targeting the next macro resistance. We’ve seen this repeatedly:
Accumulate → Expand → Re-accumulate → Expand.
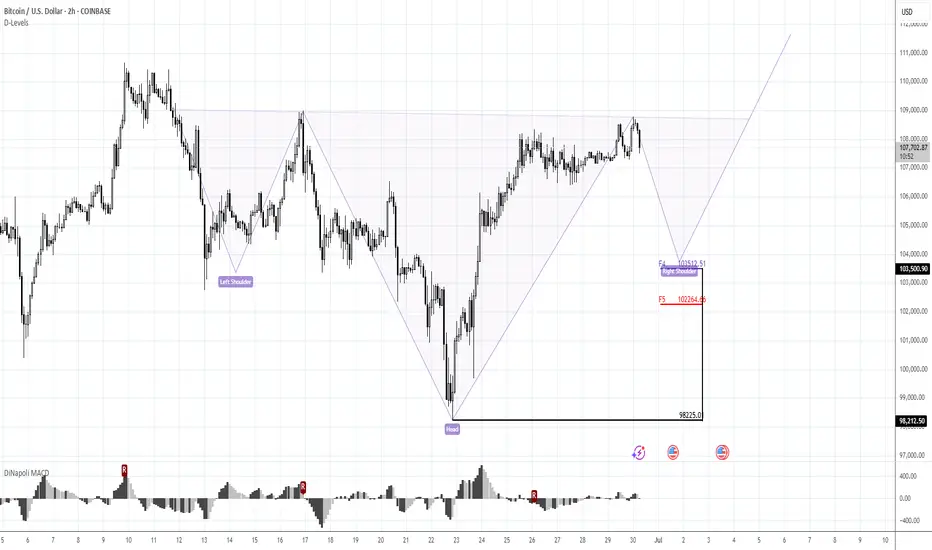
Wait for something more reliableMorning folks,
Since our last update action was anemic. Nothing has changed seriously. BTC was able to show just minor upside action. Based on current performance, I do not want to take long position right here and prefer to wait for something more reliable. Because BTC action stands rather different from the one that we expected to see.
For example it might be H&S pattern on 1H chart. Thus, an area around 103K seems the one that we will keep an eye on.
Bitcoin’s not done dropping. Selling pressure’s still on!Welcome aboard ✌️
In order for Bitcoin to climb higher, we first need a deeper correction.
Right now, price is stuck inside a channel — and it’ll take stronger momentum to break out.
🔻 So for now, I’m expecting further downside. Stick with me and don’t miss this bearish wave!
BINANCE:BTCUSD OANDA:BTCUSD
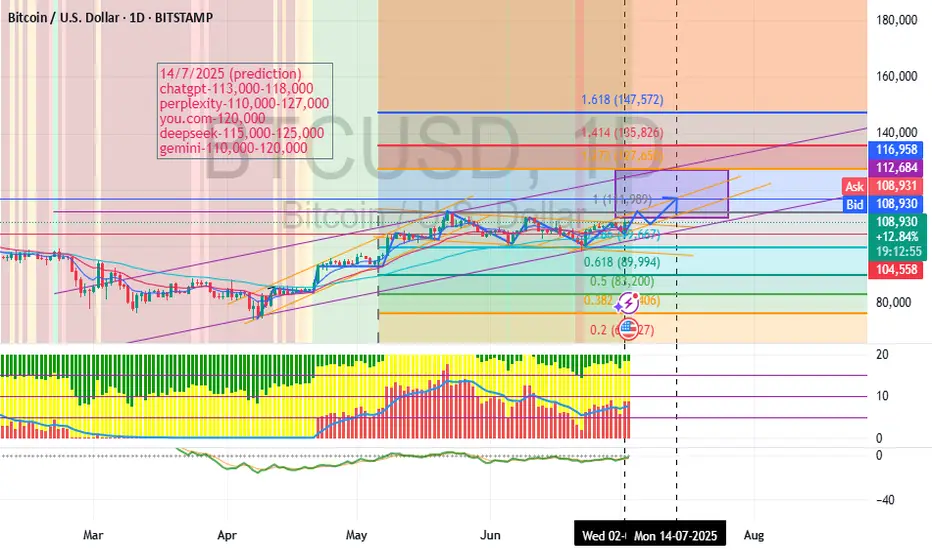
14//7/2025 bitcoin predictionThis is my prediction of bitcoin it will reach at the price of $116,958 on 14/7/2025 and as you seen ive compiled all the ai prediction of the price at the same date.
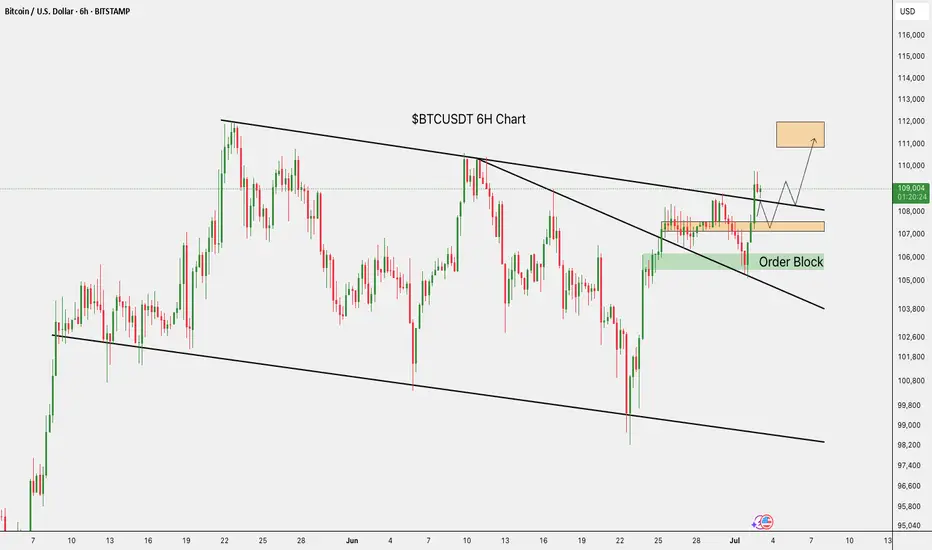
$BTC/USDT 6H Update BTC has broken out and is now retesting the breakout zone.
If this level holds, we could see a push toward $111K–$112K.
Key support remains around $108K.
DYRO, NFA
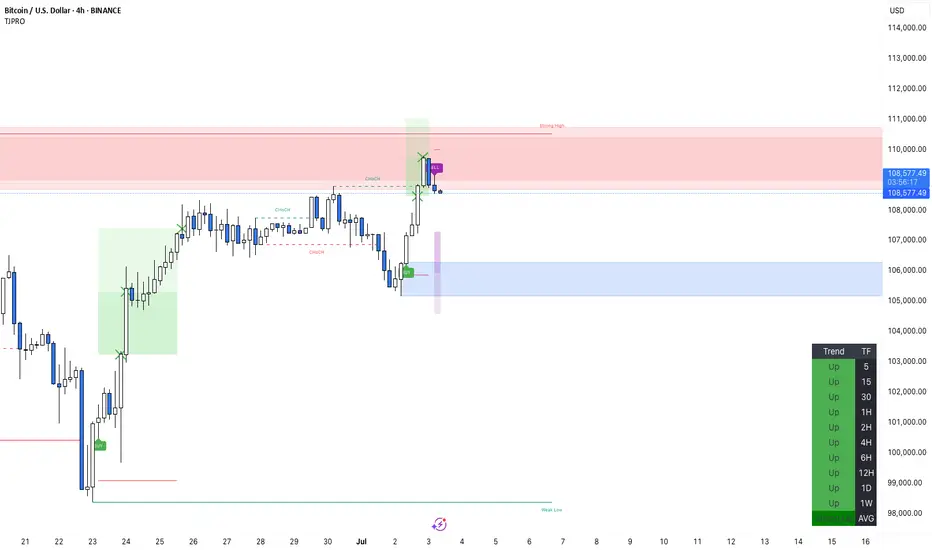
BTCUSD potential Bearish movement after showing rejectionSELL Signal: Activated at 108645.34, after price reacted from the supply zone and showed signs of weakness, suggesting a potential short-term reversal.
TP Zones:
TP1: 107293.03
TP2: 105940.72
Final TP: 104588.42
This setup offers a potential profit range of approximately +1,352 to +4,057 pips from entry.
Market Structure:
Following a previous bullish move, price tapped into the higher timeframe supply zone and now shows signs of exhaustion. This SELL signal suggests a possible correction or deeper move into the demand below, with a clean risk-to-reward structure. The SL is positioned above recent highs, giving this setup room to play out.
Remember to manage your trades carefully and ensure this setup fits your overall strategy. Stay sharp and trade responsibly!
The Right Bitcoin ChannelHello TV Community,
I am back with this and more insightful charts coming soon.
This chart was first published back in 2020 (linked below) and this is an update to BTC's trajectory over the past few years.
This chart demonstrates that BTC's price action has been steadily following the mid 50% of my "right" channel (see idea linked below to understand what I mean by "right channel"). The last time BTC's price broke out of the mid 50% range was back in December 2017's high.
The most up to date volume profile indicates that the majority of the trading volume was pre-2017. The MACD indicator is a great example of BTC's highly volatillity since the Dec 2017 high.
If BTC's price breaks into the bottom 25% of the channel, I would expect a touch of the lower end of this channel. If the price bounces off the lower end of the mid 50% of this channel, we can expect higher highs in the not too distant future.
'Til next time.
__________________________________
I let my charts do the talkin'.
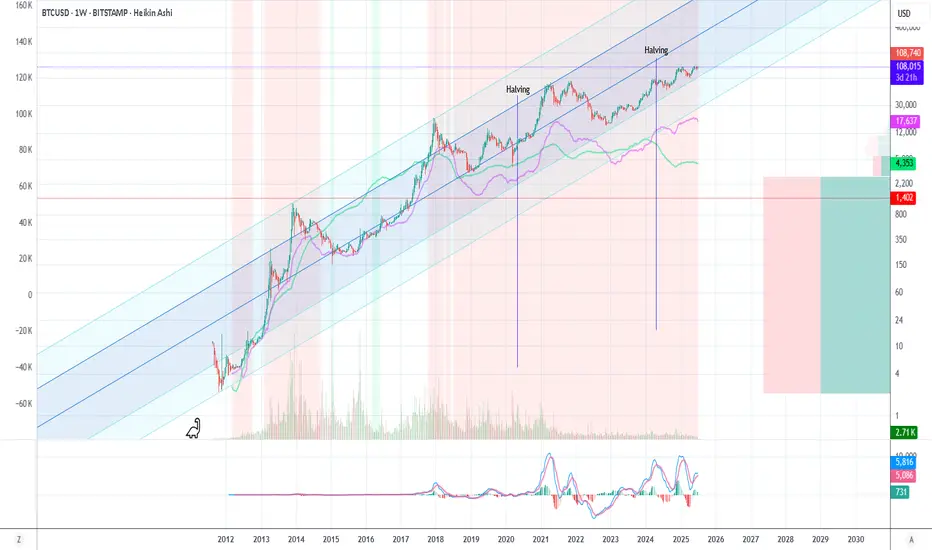
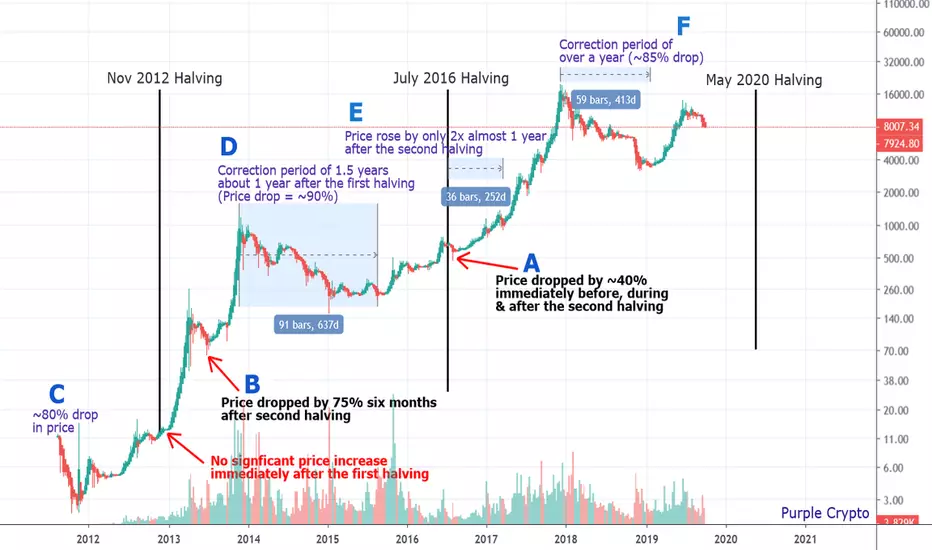
Bitcoin Halving DemystifiedI was recently asked of my opinion on how I could possibly come up with a Papa Bear Projection Chart where the correction period takes over a year long - one that takes us well into next year, and into and over the next Bitcoin halving date of May 2020. I figured it would be easier to simply print a chart for reference.
A picture speaks a thousand words. Here's a history of Bitcoin halvings - all two of them.
A. The first and the only point pertinent to the question that was asked of me is point A - the second BTC halving which occurred in July 2016 where the price of Bitcoin dropped ~40% immediately BEFORE, DURING and AFTER it.
Need I say more? The rest of this post is for educational purposes.
B. Here, the price dropped by 75% six months after the first halving (that should have said first on the chart).
C. A drop in price of approximately 80% in its early days (11.85 to 2.22) and one year before the first halving.
D. A correction period of over 1.5 years where the price dropped by about 90% between the two halvings (1163 to 152).
E. The price rose by 100% one year after the second halving. As an analogy, in today's terms, it would rise from 3000 to 6000 or 8000 to 16000 one year after the next halving (I'm not saying this is what will happen).
F. A correction period of over a year where the price dropped by ~85% (~20000 to ~3000).
Bitcoin has had more elongated correction periods and FAR MORE drops in price than it has had halvings. A third correction period of over a year or another drop in price is neither an abnormality nor a deviation from the "norm".
I guess the only reason I can think of as to why people think my projection seems so absolutely absurd is because they be dreamin' of owning Maseratis and Mansions and they be wantin' it now.
Do I think halvings have anything to do with the price of Bitcoin (all one of the two halvings which had no significant correlation, where the price did not increase immediately after the halving and only increased months later in line with the trend it was in prior to the halving)? None whatsoever.
Do I expect the price of Bitcoin to increase in the future? Yes, but only after it corrects.
What is clear from this chart is that BTC, just like any other stock or crypto, goes through cycles.
I can't predict when the corrections will end but I can forecast where it will likely finish based on its cycle and technical analysis, and that is what I am most concerned with at Purple Crypto Premium.
Adios amigos.
What goes up must come down.
My Secret Papa Bear Chart
It Played Out Like a Beautiful Melody
Are We Ready for the Crash?
Are We There Yet?
What If It Goes Down? Future Projection
___________________________
There's only one person you need to follow when it comes to crypto.