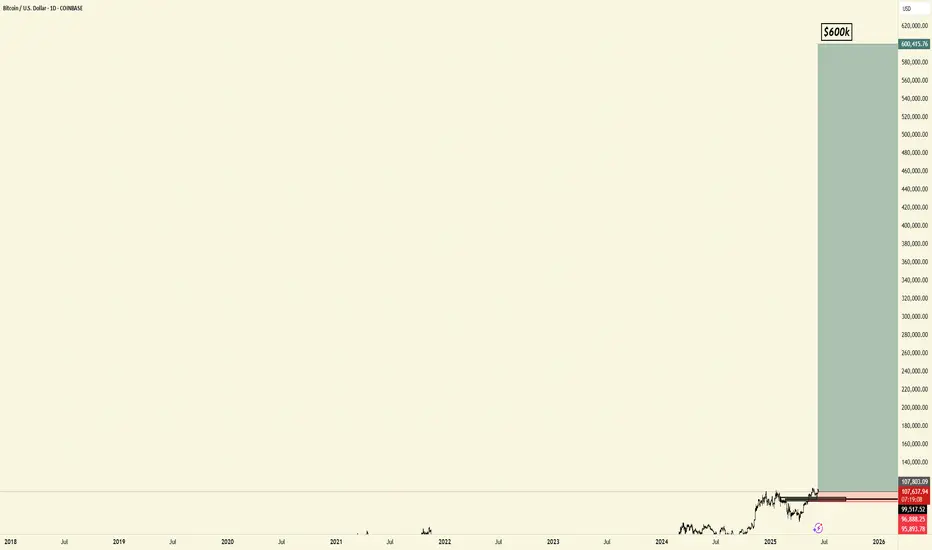
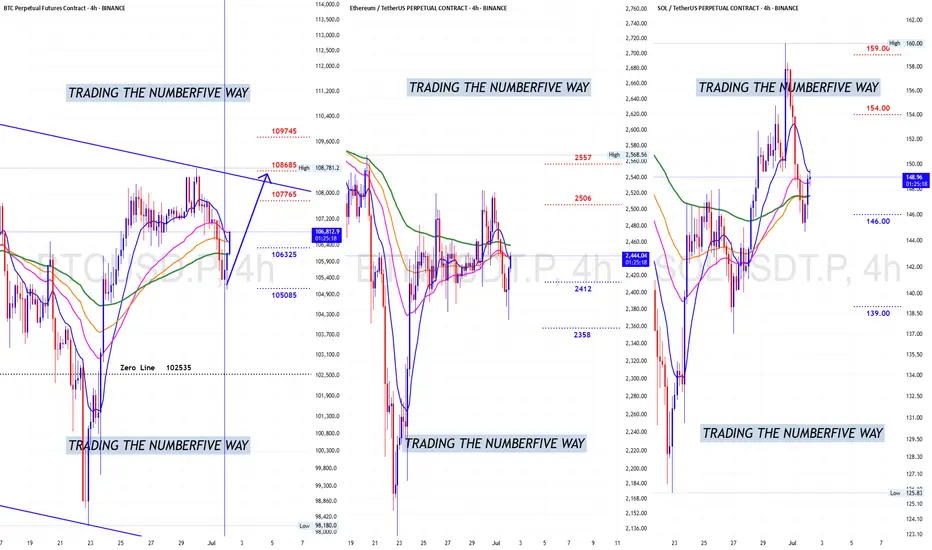
Bitcoin long $600k- long Bitcoin targeting $10-12T market cap by 2028
- acceleration of companies accumulating Bitcoin + continuation of Saylor & Strategy's ongoing TWAP
- notable uptick in global concerns w/ having access to non-sovereign store of wealth not affected by government intervention + over-reliance on USD + US Debt
- Gold's current market cap: $23T. Bitcoin is incredibly more useful as a SOV that's transferable easily across nation states & easier to transact with between parties anywhere globally
- currently holding $100k support after selling off to ~$75k during tariff fears + austerity with DOGE + macro higher low from last year and held support from November election
- including improved crypto regulatory environment otw soon + general sentiment around crypto a lot more positive
BITCOIN trade ideas
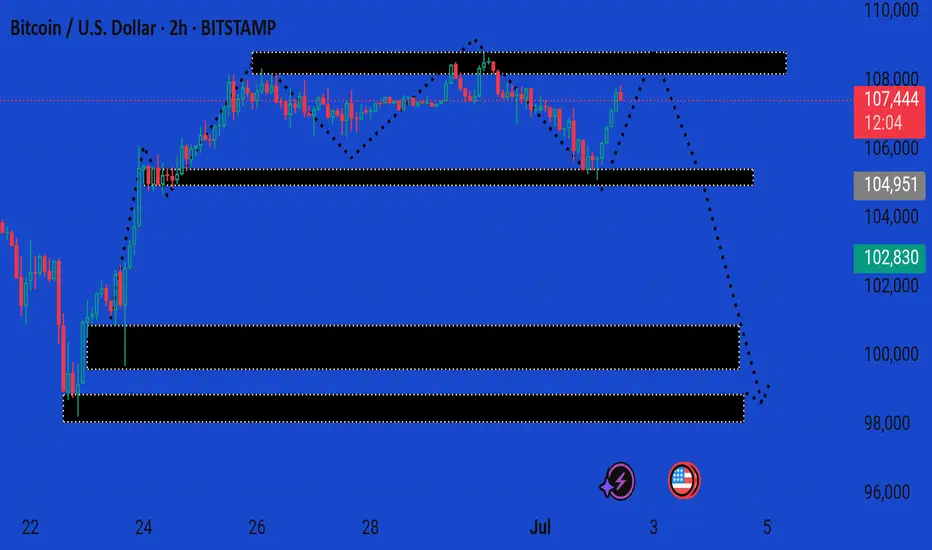
BTCUSD UPDATE MARKET This is a 2-hour BTC/USD (Bitcoin to US Dollar) chart showing a bearish projection after a consolidation phase. Here's a breakdown of the analysis:
---
🔍 Current Price:
107,549 USD
Up +1.74%, suggesting a recent bullish push — likely a short-term rally.
---
🧠 Technical Zones & Forecast:
1. Resistance Zone (~107,500–109,000):
This area has been tested multiple times.
The dotted arrow from this level suggests a projected reversal, possibly forming a lower high.
2. First Demand/Support Zone (~104,800–105,200):
Shallow support. If broken, it may confirm the start of a deeper correction.
3. Second Demand Zone (~101,500–102,800):
More robust support.
Could serve as a bounce zone or long-entry area.
4. Third Major Demand Zone (~97,500–99,000):
Strong long-term support; a bearish target if momentum increases.
---
🧭 Directional Bias:
The dotted line shows a bearish trajectory with targets at 104.9k, 102.8k, and potentially 99k.
The price action reflects a distribution range at the top, hinting at potential markdown phase starting soon.
---
✅ Conclusion:
Short-term bullish, but showing signs of weakness near resistance.
Watch for rejection around 108k–109k to confirm the bearish move.
Breakdown below 104.9k would accelerate downside toward 102.8k and 99k.
Let me know if you'd like entry/exit signals or stop-loss suggestions based on this outlook.
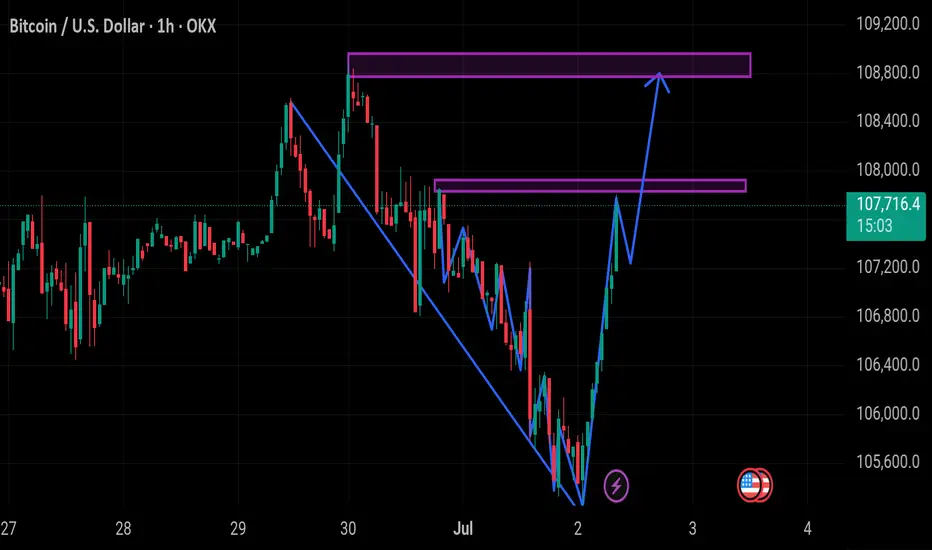
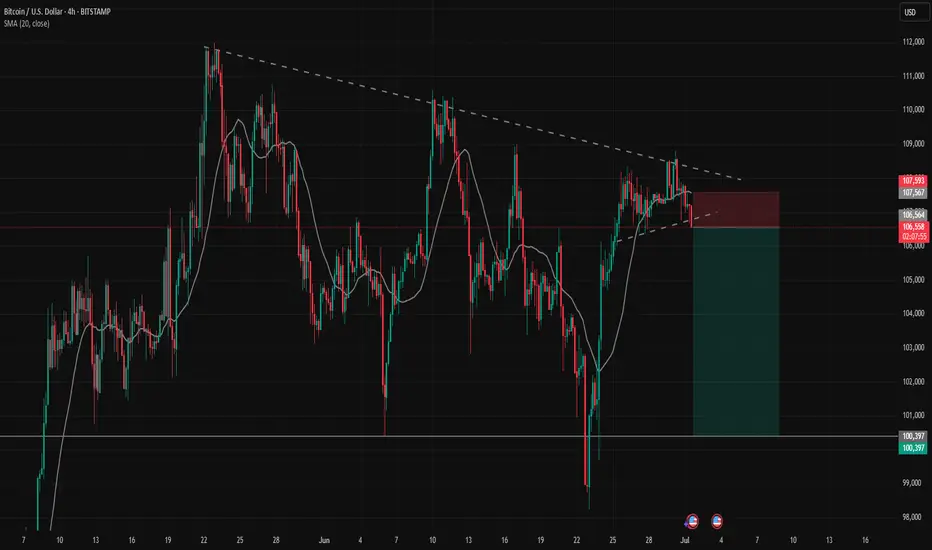
108400 Breakout Level – Bullish Above, Bearish BelowWatching 108400 closely as a key breakout level.
Above 108400: Momentum shifts bullish – potential for upward continuation.
Below 108400: Bias remains bearish – risk of further downside.

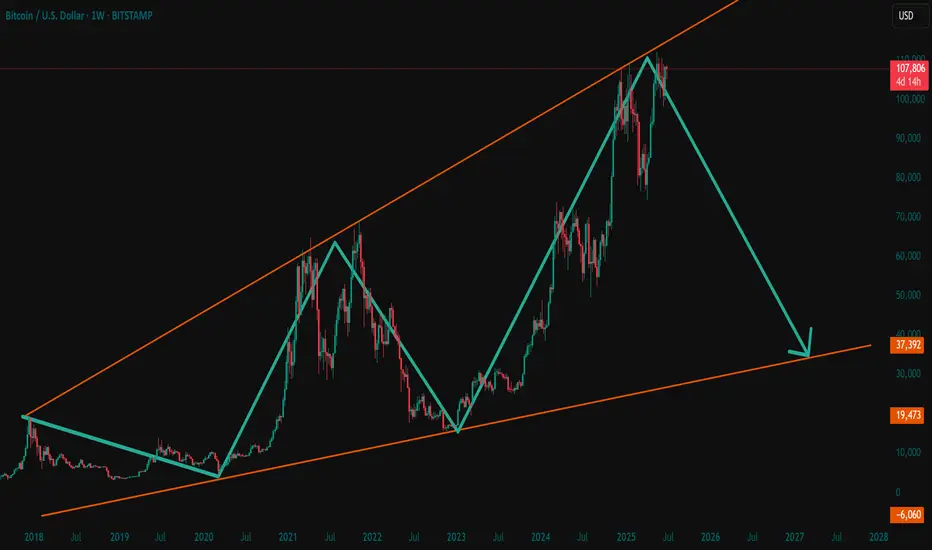
Bitcoin Faces Impending Drop to Mid-30,000sAs of July 02, 2025, Bitcoin’s price chart, crafted by "RoadToAMillionClub" on TradingView, paints a concerning picture. Currently hovering at $107,831, the cryptocurrency appears to be teetering at the edge of its upper channel, signaling potential trouble ahead. The recent 0.51% dip may be just the beginning of a more significant decline.
The long-term upward trend, marked by a supportive orange line since 2018, has been a beacon for bulls. However, the green trend line projecting a drop toward the mid-30,000s range, around $37,932, suggests a looming correction. This level, a historical support zone, could become the next battleground as selling pressure mounts.
Market indicators point to overextension, with the price hitting a 4-day and 14-day high of $107,831 before the recent pullback. The speculative fervor that drove Bitcoin to these heights seems to be waning, increasing the likelihood of a bearish turn. Investors should brace for volatility, as the cryptocurrency may struggle to maintain its current altitude, potentially sliding toward the mid-30,000s in the coming months.
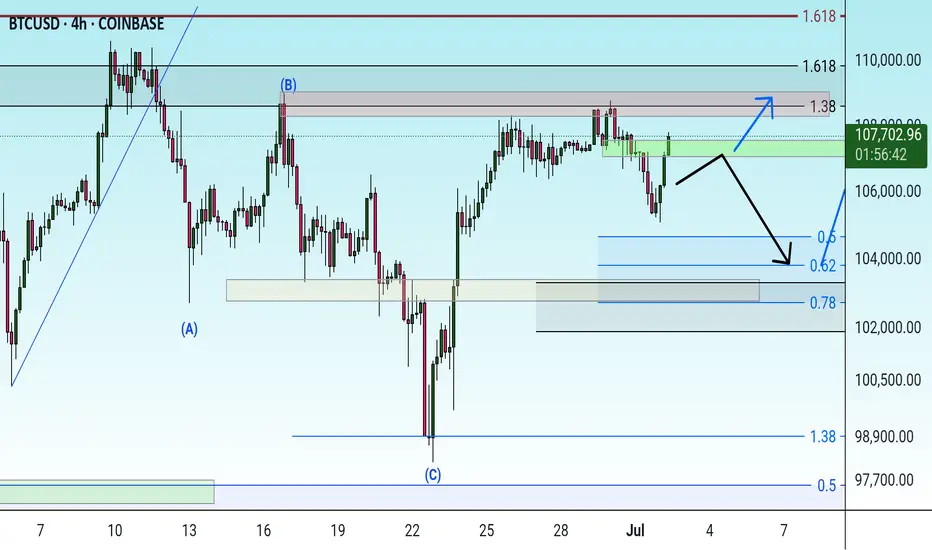
Possibility of uptrend A trend change is expected to form at the green resistance area and we will see the beginning of a downtrend. If the price breaks through the resistance area, a continuation of the uptrend to the previous high is likely.
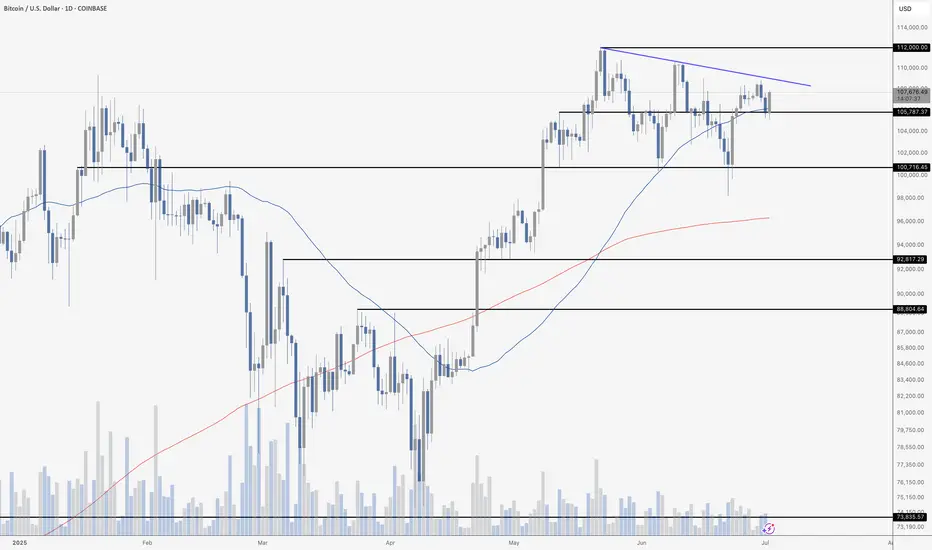
BTC BOUNCESBitcoin just pulled off a clean bounce off support, landing perfectly on the 50-day moving average around $105,800 – a level that’s repeatedly proven its importance. The move came with a solid +2% daily candle, reclaiming lost ground and putting the bulls back in control for now. Price is still trapped under the descending trendline just below $112,000, which has capped every breakout attempt over the past month, but momentum is shifting. As long as BTC stays above that support zone and keeps printing higher lows, the structure looks bullish. A breakout above that trendline would likely send us flying – but fall back below $105,800, and we’re probably retesting $100,700. For now, the bounce looks strong, the trend is intact, and the ball’s back in the bulls’ court.
Bitcoin summer of fun...If we are in a continuation pattern, and Bitcoin breaks the neckline soon.
We could be on the cusp of a very interesting and strong few months of price action.
Continuation upward sloping #inverseheadandshoudlers

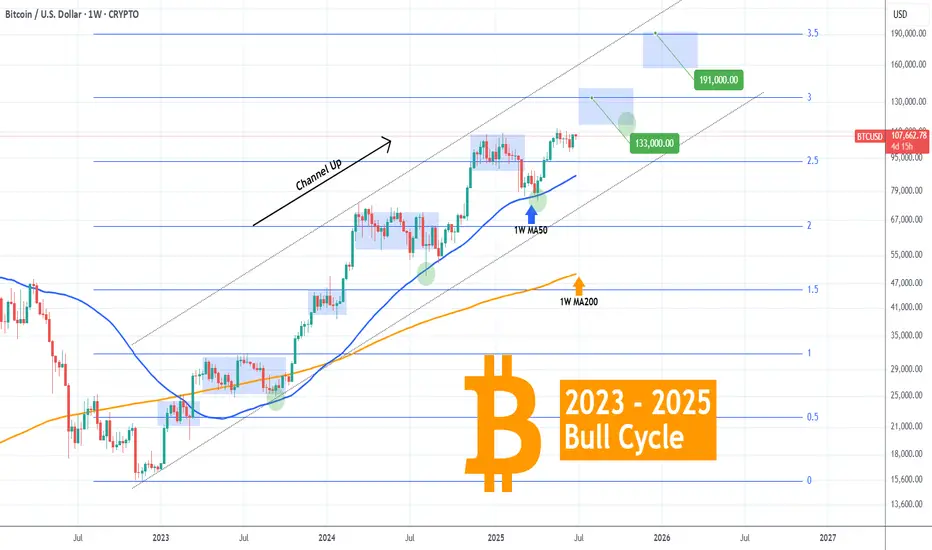
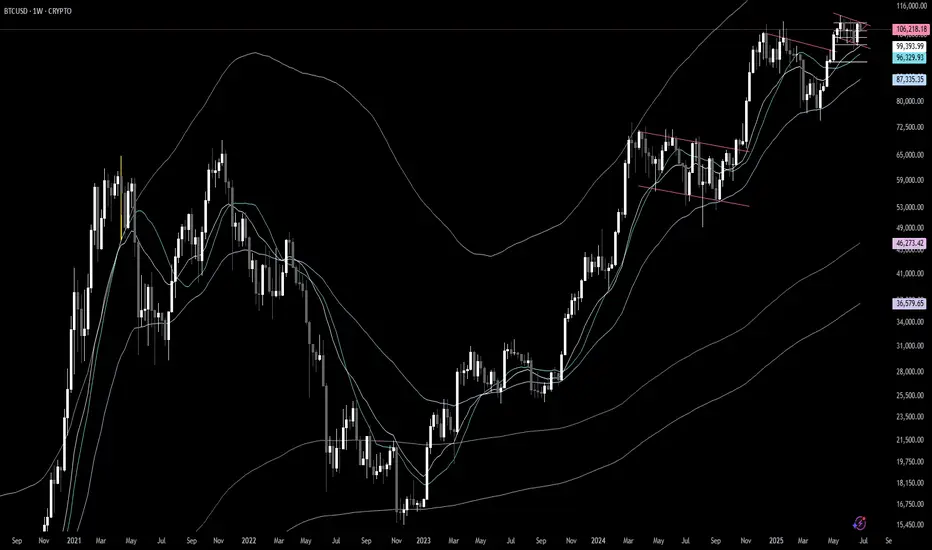
BITCOIN Bull Cycle's next two probable stops..Bitcoin (BTCUSD) has been trading within a 2.5-year Channel Up throughout the entirety of its 2023 - 2025 Bull Cycle, showcasing incredible consistency. This is perhaps BTC's most stable Bull Cycle and that can help us estimate to some degree its next two key levels, before its tops.
As you can see, every major Higher High of this pattern has been either on or marginally above a +0.5 Fibonacci interval:
Fib 0.5 was the February 2023 High and Accumulation Phase.
Fib 1.0 the April - September 2023 Accumulation.
Fib 1.5 December 2023 - January 2024.
Fib 2.0 March - September 2024.
Fib 2.5 December 2024 - February 2025.
Right now the market seems to be attempting a break-out above a Bull Flag, following the massive April 07 2025 rebound on the 1W MA50 (blue trend-line), a level that has been the most optimal buy entry in the past 2 years.
The next stop based on this model is the 3.0 Fibonacci extension level at 133000, where there are high probabilities for the market to consolidate (accumulation phase) in preparation for perhaps the final stop and Cycle peak on the 3.5 Fib ext around 191000. As we've discussed on previous analyses, a final Target between those two around $150000 may be more fitting, carrying less risk into the final months of the Bull Cycle.
So what do you think? Do you believe that's the blueprint to follow until the end of the year/ Cycle? Feel free to let us know in the comments section below!
-------------------------------------------------------------------------------
** Please LIKE 👍, FOLLOW ✅, SHARE 🙌 and COMMENT ✍ if you enjoy this idea! Also share your ideas and charts in the comments section below! This is best way to keep it relevant, support us, keep the content here free and allow the idea to reach as many people as possible. **
-------------------------------------------------------------------------------
💸💸💸💸💸💸
👇 👇 👇 👇 👇 👇
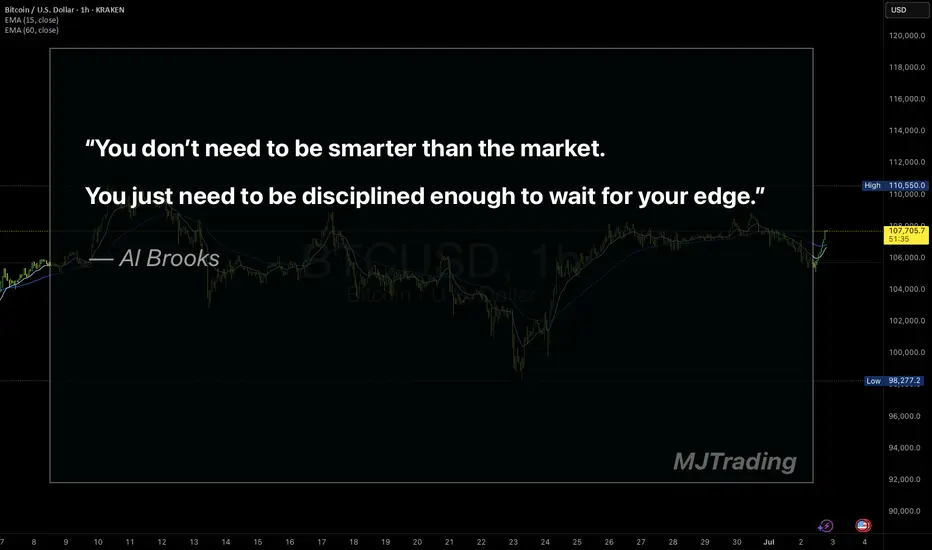
Wait for your EDGE...
Discipline is what separates professionals from amateurs.
Stay patient. Wait for your edge. Let the probabilities work in your favor.
👉 “Agree with this? Hit Boost to spread the message.”
#TradingPsychology #Discipline #BTC #Bitcoin #Forex
#TradingMindset #AlBrooks #TradingDiscipline #PriceAction #ForexTrading #CryptoTrading #StockMarket #MJTrading #TradingQuotes #TraderLife #MindOverMarkets
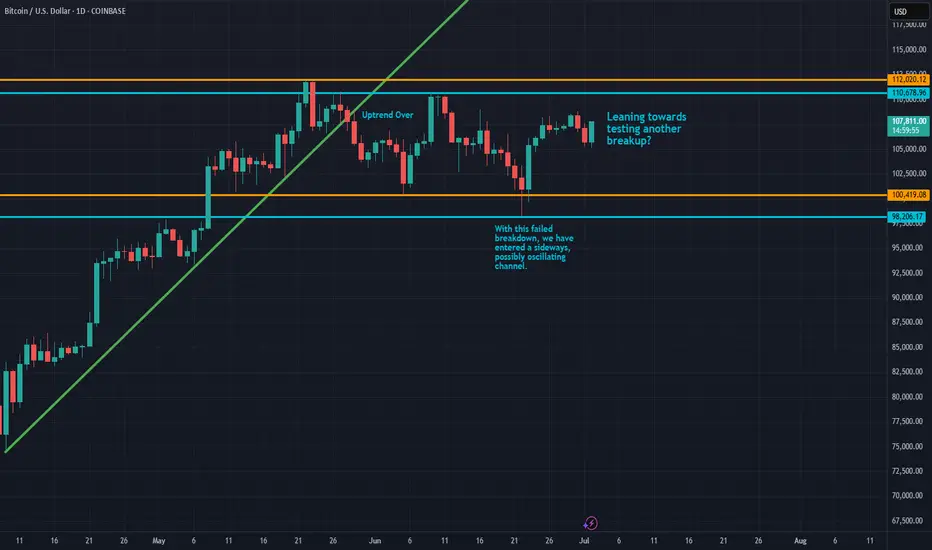
Sideways ChannelLooks like today we have bounced off the midpoint of this channel. Yesterday we dropped, today we rise!
Overall, this looks like a very neutral position. Potential for a short gain here up to previous highs with a bounce back down to lows.
No one can predict how long we will stay in this channel, but the breakout or breakdown will be very bold and very loud in one direction.
As a trend trader, I am looking to a breakup potential right now. If I had to be in a position, it would be long.
Btcusdt tecenical analysis.Btcusdt tecenical analysia next move possible at h1 time frame.not fincial advice.
BTC?
Hi
I think we are at seed stage for this 2 Quarters.
130? or more?
Everyone.. including well paid analysts are predicting.
So what is the difference between you/I and them?
||| Nothing :: or they might be worst .. (not investing/not taking risk at all from what they write)
I make my publish notes.. I take risk.. I am bolder.. hehe
Although; I am wrong or in profits. I stick to what I believe. So should oneself.
I would spend some % into my idea.
End of day. Do not believe anyone. Do your own research and be bold. Have your Stops ready.. make sure it's wide ( so it won't hurt you after 1 minute ) :)
All the best & Not a guru
NB/ I'm vulllisssssshhhhh of crypto space
Who knows one of you larva turn into beautiful butterfly
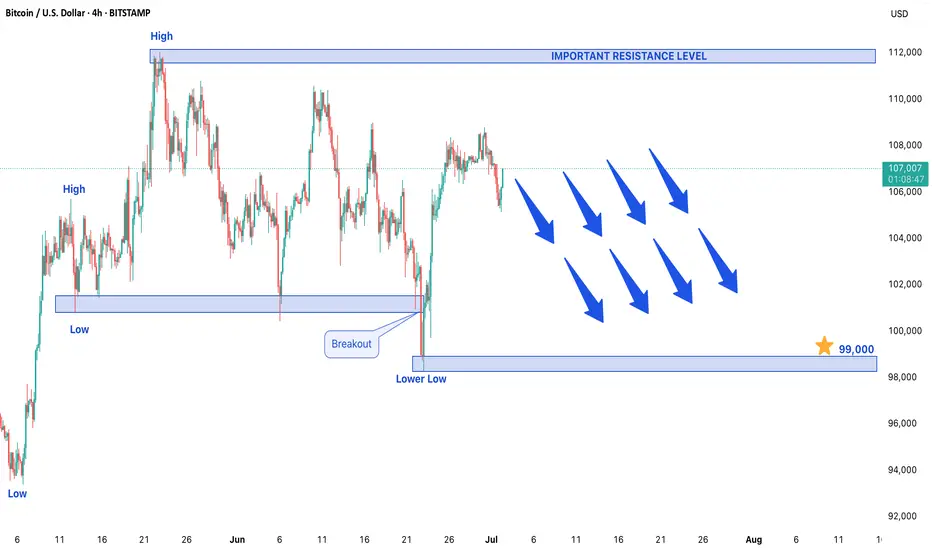
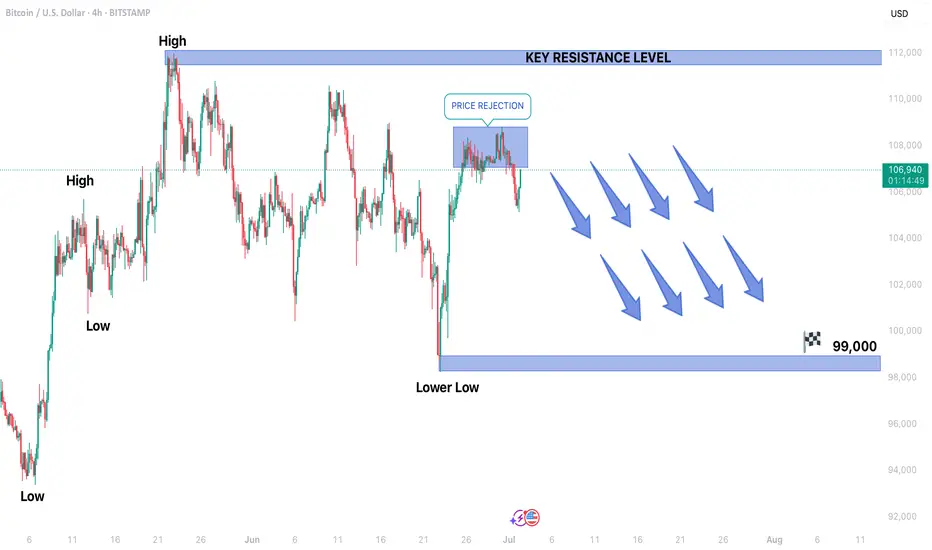
BITCOIN STRATED FORMING BEARISH TREND STRUCTUREBITCOIN SHOWS SIGNS OF BEARISH REVERSAL – KEY LEVELS TO WATCH
After an extended bullish run, Bitcoin is now showing early signs of a potential trend reversal as the market begins forming a bearish structure. The formation of a lower low on the price chart indicates weakening bullish momentum and suggests that sellers may be gaining control. This development comes after a sustained upward trend, signaling that a corrective phase could be underway in the cryptocurrency market.
Bearish Confirmation: Lower Low Formation
The appearance of a lower low is one of the most reliable technical indicators of a trend reversal. This pattern demonstrates that bears are successfully pushing prices below previous support levels, establishing a new downward trajectory. While this doesn't necessarily confirm a long-term bear market, it does suggest that Bitcoin could face further downside pressure in the near term. Traders should watch for confirmation through follow-through selling or additional bearish candlestick patterns.
Downside Target: $99,000 in Focus
If the bearish momentum continues, Bitcoin could test the $99,000 support level in upcoming trading sessions. This level represents a psychologically important zone where buyers may attempt to step in. However, a decisive break below this support could accelerate declines, potentially leading to deeper corrections. Traders should monitor volume and price action around this level for signs of either consolidation or continuation of the downtrend.
Resistance Level: $12,000 as Key Barrier
On the upside, $12,000 now acts as a critical resistance level. Any short-term rallies toward this zone could attract renewed selling pressure, reinforcing the bearish outlook. For the current downtrend to be invalidated, Bitcoin would need to reclaim and sustain above this resistance with strong buying volume. Until then, traders may consider selling into strength near this level while maintaining tight risk management.
Market Outlook: Correction Expected After Prolonged Rally
Given Bitcoin's history of volatile price swings, this potential reversal should not come as a complete surprise after its extended bullish run. Market participants should watch for:
- Increasing trading volume on downward moves (confirming bearish conviction)
- Potential bearish continuation patterns (like descending triangles or flag formations)
- Macro factors that could influence crypto markets (regulatory news, ETF flows, or macroeconomic shifts)
Conclusion
Bitcoin appears to be entering a corrective phase, with $99,000 as the next key downside target and $12,000 serving as major resistance. While the broader uptrend may still be intact long-term, short-term traders should prepare for potential bearish continuation. As always, proper position sizing and stop-loss strategies remain crucial in navigating Bitcoin's inherent volatility. A break above $12,000 would require reassessment of the bearish outlook.
BITCOIN STRATED FORMING BEARISH TREND STRUCTURE.BITCOIN STRATED FORMING BEARISH TREND STRUCTURE.
Market started forming lower low, which indicate bearish trend.
After a long Bullish trend, a correction is expected in market.
Market is expected to remain Bearish in upcoming trading session.
On lower side market may hit the target level of 99,000$ in upcoming trading sessions.
On higher side 12,000$ price may act as a key resistance level for the market.
Bitcoin: 1hr Bullish AgainLooks like it will be a boring week for Bitcoin so probably ALTs will have a good run.
New Bitcoin numbers came out very close to each other meaning rest of week will be boring with low volatility.
We can expect Bitcoin entering a range for rest of week if current volatility continues.
Not much to say for now.. Top of range around 108500 to 109500.
Take care everyone.
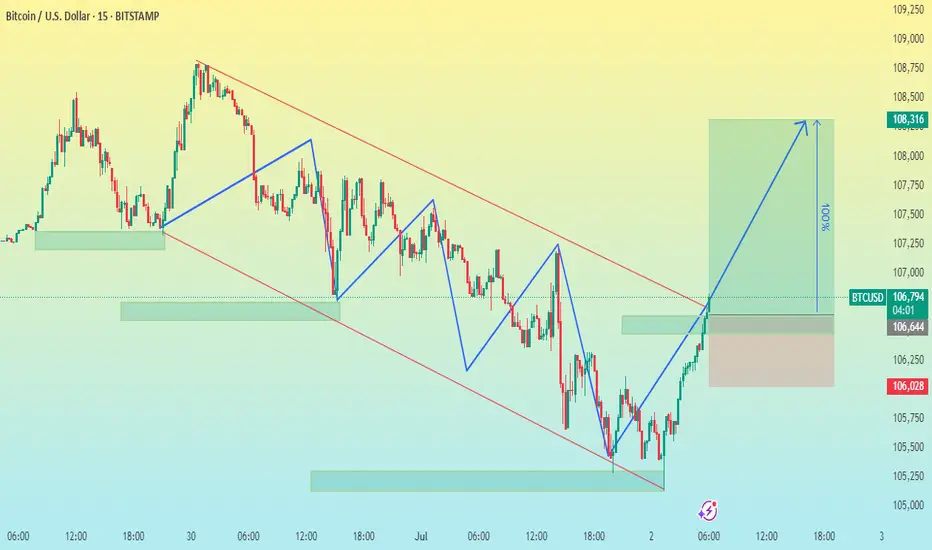
BTC/USD 15M CHART PATTERNHere's a breakdown of your BTCUSD trade plan:
---
📈 Trade Setup
Position: Buy BTCUSD
Entry Price: 106,800
---
🎯 Take Profit Levels
1. TP1: 107,200 (+400 pips / +0.37%)
2. TP2: 107,700 (+900 pips / +0.84%)
3. TP3: 108,325 (+1,525 pips / +1.43%)
---
🛑 Stop Loss
SL: 106,028
(-772 pips / -0.72% risk)
---
📊 Risk-Reward Ratio
TP1: ~0.52 : 1
TP2: ~1.17 : 1
TP3: ~1.97 : 1
This plan shows a low initial reward, but the later targets improve the R:R considerably. Make sure your position size reflects your total risk tolerance.
Would you like help turning this into a trading journal entry, risk calculator, or script for a trading bot (e.g., in Pine Script or Python)?
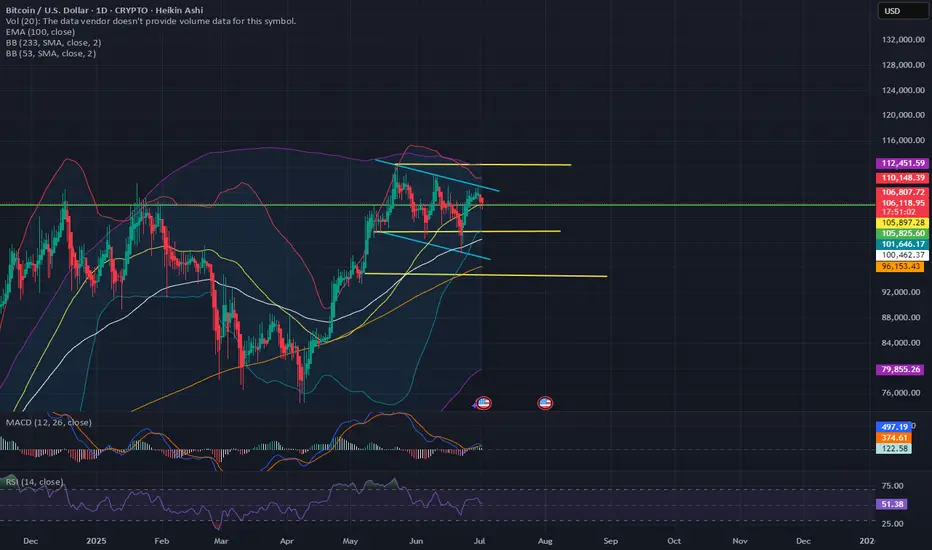
BTC Bull Flag Breakout or Fakeout? Eyes on $107K–$112K ZoneHere's my updated chart for Bitcoin (BTC/USD) on the daily timeframe. The price action is currently testing a key zone that could define whether we're heading into the next major leg up, or facing another rejection.
Pattern Breakdown:
- BTC is respecting a bull flag formation after a strong impulse leg earlier this year.
- The $105K level has held as critical support, keeping the bull flag structure intact.
- Price is currently pressing against descending resistance (~$107K) with tightening consolidation indicating an imminent breakout decision.
Key Levels to Watch:
Support:
$105K – holding this level keeps bullish momentum valid.
$101.6K (Bollinger midline)
$100.4K (EMA 100) – must hold for macro trend to stay intact.
Resistance (before $112K):
$107K – major descending trendline resistance.
$110.1K – upper Bollinger Band and recent local high.
$112.45K – key breakout level from the flag. A daily close above this could trigger a sharp rally.
Indicators:
MACD is forming a bullish crossover but lacks strong momentum, watch for a green histogram to confirm.
RSI at ~51 gives BTC room to run, not in overbought territory.
Volume is low, but coiling tight near the apex could spark volatility.
Conclusion:
BTC is at a critical decision point. A clean breakout above $107K, followed by sustained momentum through $110K–$112K, would significantly raise the probability of a confirmed bull flag breakout, with a potential move toward $120K+.
However, the $105K level is a key support that must hold to keep this structure intact.
If we see a daily close below $105K, attention shifts to the $101K level (Bollinger Band midline + 53 SMA).
A close below $101K would invalidate the bull flag entirely, turning this setup into a potential bull trap, and shifting short-term bias bearish.
All eyes are on the $107K–$112K resistance zone for confirmation—or breakdown signals if support levels give way.
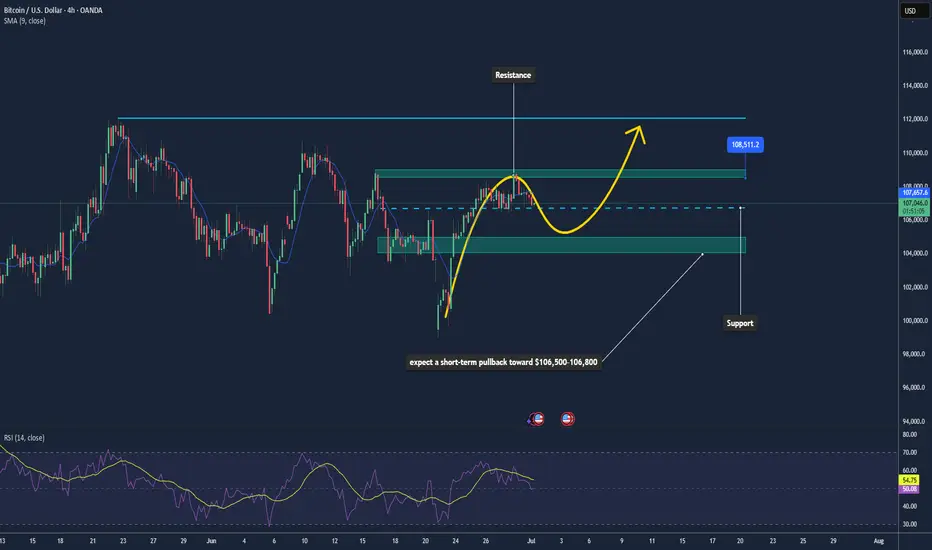
Bitcoin May Break Higher if $108K Clears📊 Market:
BTC trades around $106,860, driven by strong ETF inflows and weaker USD ahead of Fed rate decisions.
📉 Technical:
• Resistance: $107,400–108,000 → breakout may target $110,000+
• Support: $106,500–106,800 → next at $105,500
• EMA: Price above EMA9 → short-term uptrend
• Momentum: RSI > 80, Stoch high → upside potential but overbought
📌 Outlook:
BTC could rise if $108K breaks. If not, expect a pullback to $106,800.
💡 Trade Setup:
🔺 BUY BTC/USD: $107,000–107,200
🎯 TP: 1000–2000 pts
❌ SL: $106,500
🔻 SELL BTC/USD: $108,000–108,200
🎯 TP: $106,800–107,000
❌ SL: $108,500
Sooo BULLISH!This structure is probably the most bullish cycle structure that BTC has ever had. So impressive! I don't think we are ready for what is about to happen :)
Bitcoin is still in a BullflagBitcoin has been chopping sideways from 110k to 100k since May which is almost 2 months. People have been saying this is a descending channel but sometimes global swan events can disrupt Technical analysis. If you discount the Bitcoin dump on 5th June as Elon Musk/Trump clash and on 20th June as I*rael/Iran war, then Bitcoin is still in a bull flag structure and will breakout to the upside following the global liquidity.
SELL BTCUSD trading signalBTCUSD confirmed the weakness at the trendline resistance zone on the h4 time frame.
The h1 time frame price confirmed that the sellers won when the candle closed below the nearest trendline support zone.
In terms of wave structure, there is no strong support zone that is strong enough to keep the BTC price uptrend in the short term. Therefore, the target of the SELL signal can reach 100,400. That is the wick area of the past liquidity candle where the buyers won over the sellers and pushed the price up sharply.
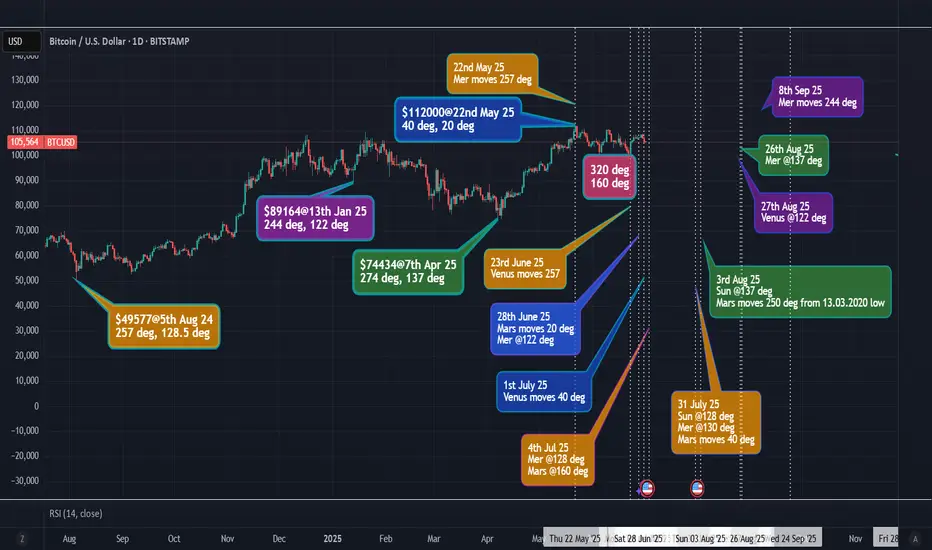
BTC - change in trend - GANN's price = planetary long/movesThis is based on GANN's price squaring planetary longitude and planetary movements. The color-coding is to match the price in degree with the expected future dates for change in trend marked on the chart.
EMA SystemThe system of Moving Averages I started out using is the 9-21-50 SMA. I would use the Fast EMA as a trailing stop loss and only trade long when it's above the 50 SMA. The 21 SMA is often a zone where price can bounce back.
12-21 EMA—EMA of EMA can work as well. So can 50-200 SMA or EMA of EMA for telling the larger trend if you want to enter an Option, then trading against it can be fatal.
