BITCOIN trade ideas
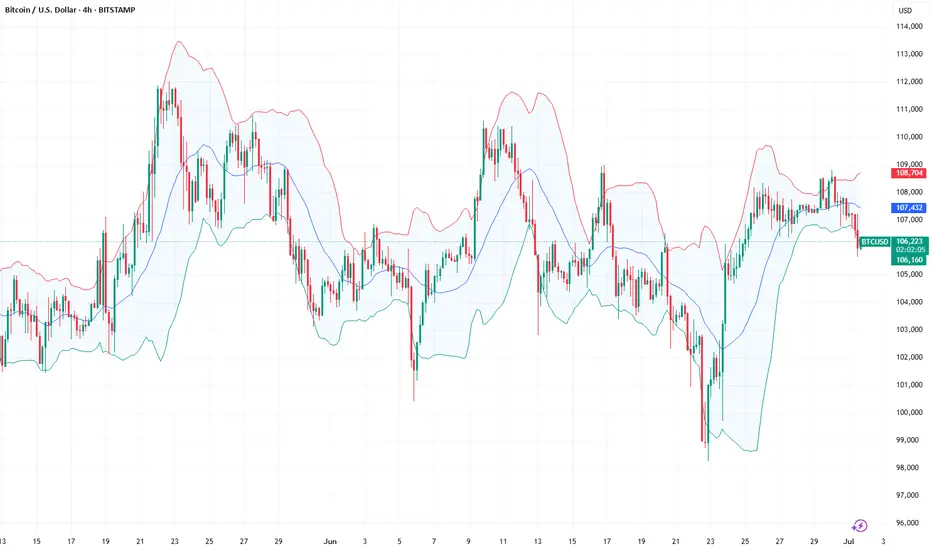
Bitcoin - Price struggles below resistance, correction to $104k?This 4-hour chart for BTC/USD illustrates a detailed technical analysis scenario highlighting key resistance and support zones, as well as a critical fair value gap (FVG). The chart shows that Bitcoin is currently facing strong resistance in the $108,000 to $109,000 range. This area has been tested multiple times without a successful breakout, indicating significant selling pressure. The price is currently trading just below this resistance zone, struggling to gain momentum above it.
Support zone in the consolidation
A clear support level has been marked in the recent consolidation area around $106,000. This zone has served as a short-term base during the recent upward movement, and a retest here could provide a temporary bounce or pause in bearish momentum. However, if this support fails to hold, the next major area of interest lies within the 4-hour bullish FVG between approximately $103,000 and $104,000.
4H FVG
There is a clear 4-hour bullish FVG between approximately $103.000 and $104.000. This level can act as a strong support for buyers after filling up the inbalance zone. it is highly important to hold this level as support and not to break below it.
Upside potential
On the upside, if BTC can defend the support in the consolidation zone and reclaim momentum, a push back to the $108,000 to $109,000 resistance area is probable. A successful breakout above this zone would invalidate the bearish scenario and may trigger a bullish continuation, with the potential to reach higher targets such as $111,000 or beyond.
Downside risk
The downside risk becomes more pronounced if BTC breaks below the 4H FVG. A sustained move beneath this level would likely signal weakness in buyer interest and potentially open the path to deeper downside targets. In such a scenario, the price could accelerate lower toward the psychological support level at $100,000. This round number also carries technical and emotional significance for traders, which could create both a strong support area and potential buying interest.
Conclusion
In conclusion, Bitcoin remains at a critical juncture. The key levels to watch are the support within the current consolidation and the 4H FVG imbalance zone. A breakdown below the FVG could lead to a decline toward $100,000, while holding above these levels keeps the door open for another test of resistance at $108,000 to $109,000. A breakout from there would indicate bullish strength and a shift in market sentiment. Traders should remain cautious and reactive to how price behaves around these critical areas.
Disclosure: I am part of Trade Nation's Influencer program and receive a monthly fee for using their TradingView charts in my analysis.
Thanks for your support.
- Make sure to follow me so you don't miss out on the next analysis!
- Drop a like and leave a comment!

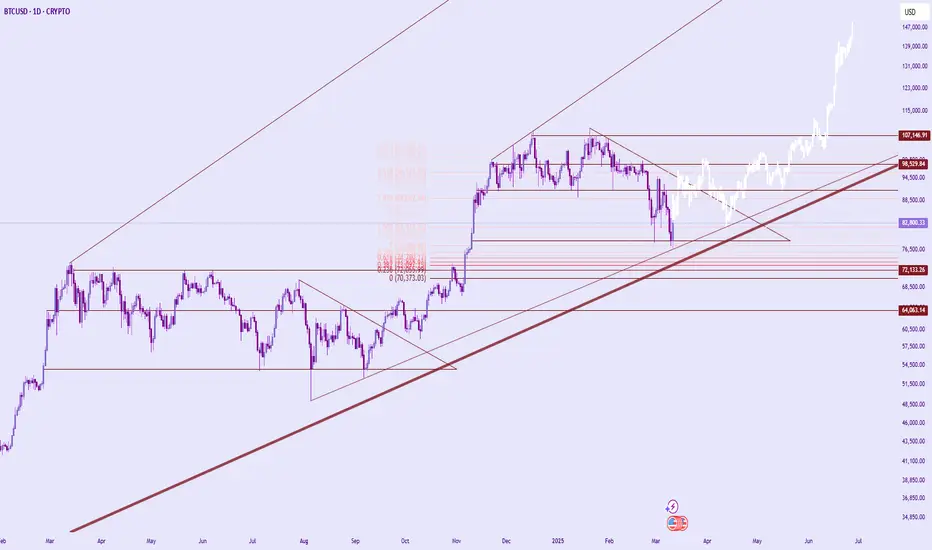
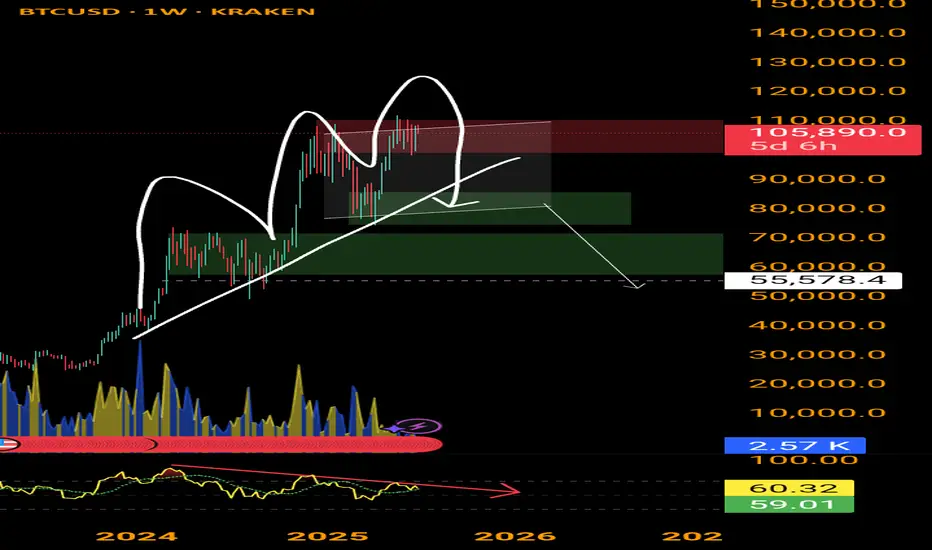
also looks a bit like inverted head and shouldersbitcoin wouldnt be bitcoin , if from time to time a more or less head and shoulders pattern comes along.
in this case it looks a bit like the right inverted shoulder is being made. but the bearish div is also present.
it might be possible , a sharp move up to new highs around 135 k , followed by a drop below 100k .
bearish divergence on the weekly , pullback seems to be comingafter a bullish run up , it looks like it is about time to cool down a bit . retrace to below 100k , and test support . bearish diversion is clearly showing on the bigger timeframes and can play out very soon.
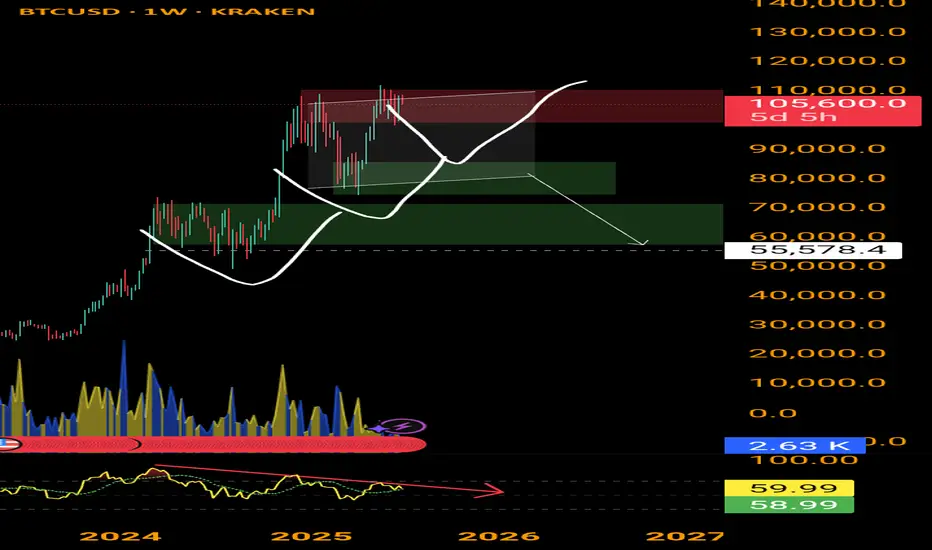
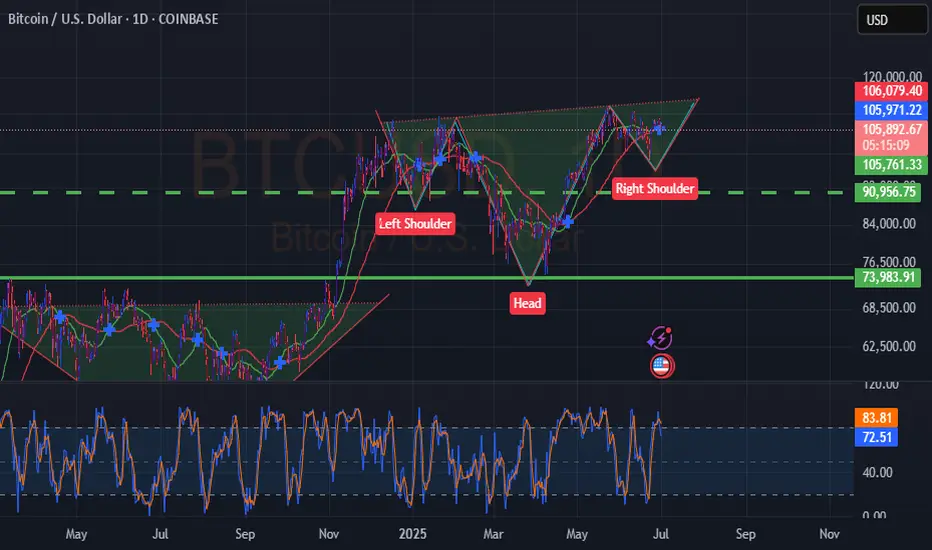
Btc Usd IH&SHi all. BTC is in an IH&S on top of a larger IH&S pattern it seems. Pullback to 96K possible. But looking good for longer term trades. I'm sure this will pump, not 70K as most are saying, 90K is the lowest for now imo. Not financial advice. Please do your own research. Please leave a like, some motivation for an update. Good luck with your next trade.
Crypto breakouts: Bitcoin, Ethereum, and Solana lead the surgeJune brought a wave of positive sentiment to digital assets. Despite global uncertainty, major cryptocurrencies continued their upward movement. Investors are once again turning to decentralized assets amid expectations of a Fed rate cut and an increasingly fragile macro backdrop.
Key moves this month :
• Bitcoin (#BTCUSD) +4.6% — Strengthened by a weaker dollar and renewed institutional interest. JPMorgan projects $150,000 by 2025.
• Ethereum (#ETHUSD) +3.8% — Gains on ETF optimism and rising DeFi activity.
• Solana (#SOLUSD) +6.1% — In the spotlight due to network scalability and new Web3 partnerships.
• Ripple (#XRPUSD) +2.4% — Rebounding after positive developments in the SEC case and potential global alliances.
• Dogecoin (#DOGUSD) +5.2% — Community-driven momentum and fresh public support from Elon Musk.
Underperformers:
• Litecoin (#LTCUSD) –1.8%, Cardano (#ADAUSD) –2.2% — Profit-taking and lack of new drivers weighed on prices.
• Polkadot (#DOTUSD) –3.1% — Weak on-chain metrics and fading interest in cross-chain solutions added pressure.
According to FreshForex analysts, the crypto market is entering a recovery phase. Signals from the Fed hint at upcoming rate cuts, while interest in decentralized projects and crypto ETFs is rising. Market leadership by #BTC and #ETH reflects growing confidence, while altcoins continue to follow the broader upward trend.
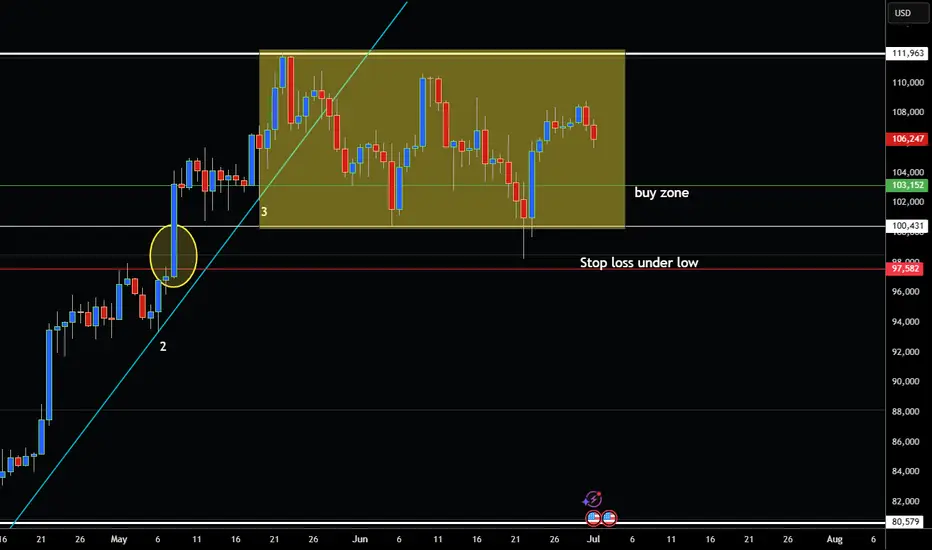
Bitcoin Stuck in Channel but Building up for Breakout?Hey Traders so today we are looking at Bitcoin currently trading in narrow sideways channel. But looking like strong support at 100,431 notice how on June 22 could not close below it.
Also notice on May 8 that was the same area for strong rally. So I think a good place to get back in this market would be half the daily candle on June 23 or a price of 103,150 or even 102,000.
Strong stop below support around 97,582 or lower.
So if bullish buy on pullback to channel support however if bearish wait for break below 96,000 that way you know market has confirmed move lower.
I think right now it's still showing bull market signs but only time will tell.
Good Luck & Always use Risk Management!
(Just in we are wrong in our analysis most experts recommend never to risk more than 2% of your account equity on any given trade.)
Hope This Helps Your Trading 😃
Clifford
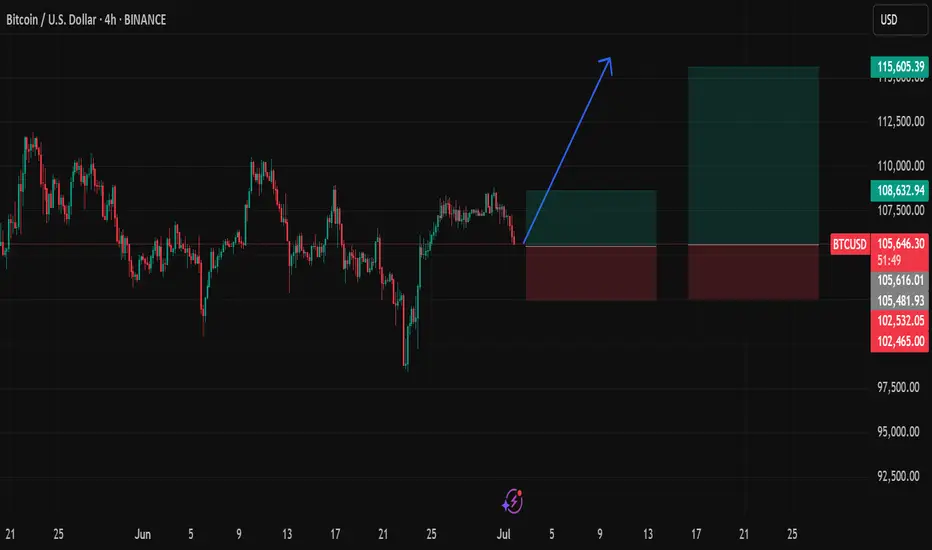
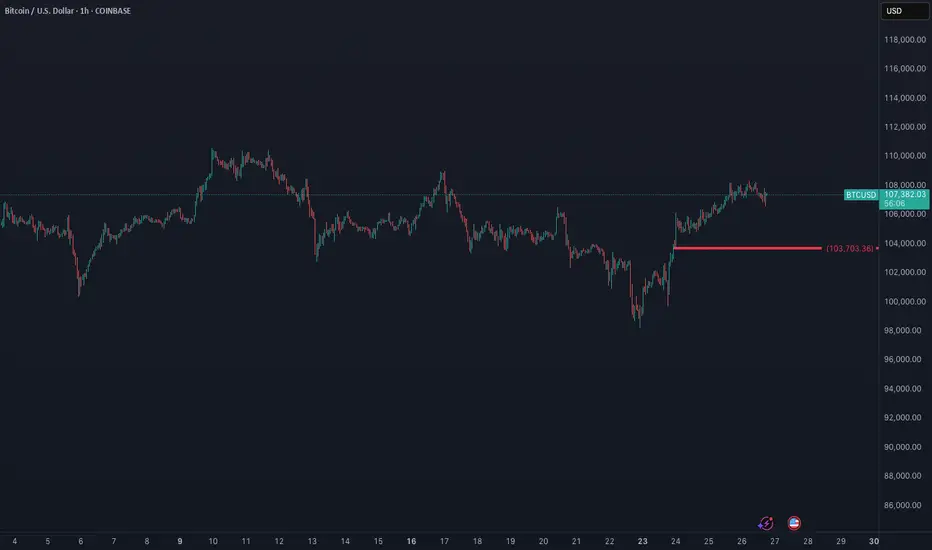
Turn off the noise. Listen to price. $XBTUSDFor me, BITMEX:BTCUSD.P is still in a bullish setup. If you are long, don't panic sell early yet. The signal to sell would be a break of my LIS which currently stands at 103703. If it makes new highs, it would be even more convincing that it wants to go higher ie. don't sell at new highs.
If a new high is made, i will be able to provide a min target to the upside. I will keep you updated.
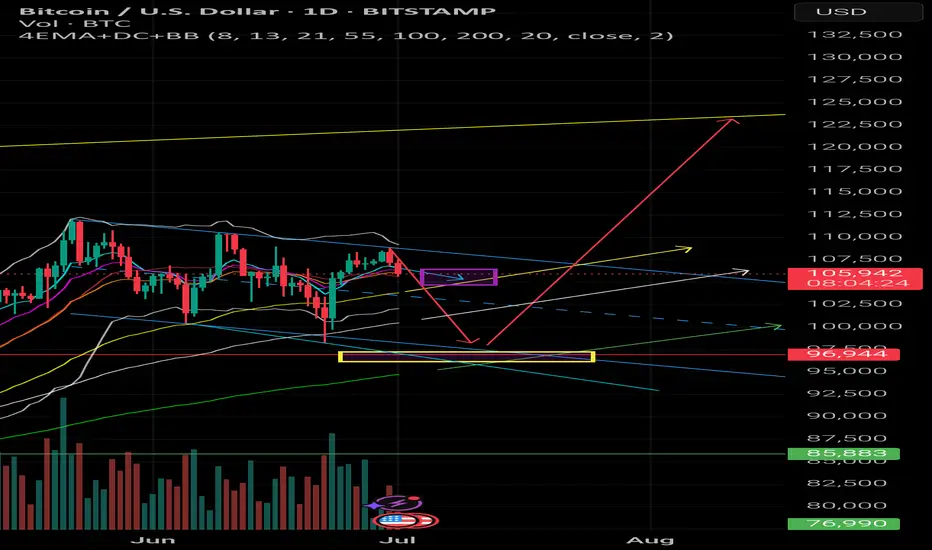
Bitcoin Daily – Multi-Line Magnet in Play📊 Bitcoin Daily – Multi-Line Magnet in Play
Price, Time, and Structure Align
I’ve added a new trendline connecting the last two deep hits.
Technically, the second hit broke the old flag structure – but honestly, that’s not a real problem.
👉 The overall swing structure remains intact.
The new line now perfectly fits the current market rhythm.
What’s really interesting:
This new trendline converges exactly at the same magnetic zone I’ve been tracking – around 96,944 USD.
It aligns with the previous horizontal key level, the EMA projection, and the crosspoint I marked earlier.
This kind of multi-line confluence often acts like a price magnet.
👉 What I love about this setup:
If price really pushes into this zone, it would cleanly stab through the old flag structure – a typical panic trigger that shakes out many traders.
📌 Also worth noting: Another day has passed since my initial idea, and the current price action has technically proven that it’s possible to push lower.
The path to the target remains open.
👉 Stop-Loss Logic:
For this setup, the cold stop-loss sits just below the midline of the weekly Bollinger Band.
If this level gets broken, the overall structure is technically invalid.
But I wouldn’t place the stop directly on the midline – it’s smarter to give it a small buffer to survive potential liquidity sweeps.
Typically, this level doesn’t break cleanly on the first touch.
Let’s see how this plays out.
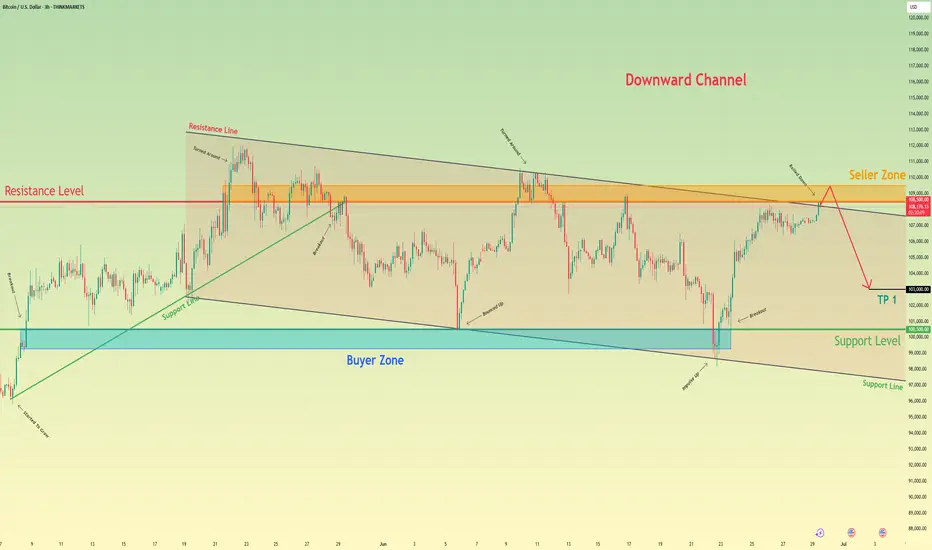
Bitcoin can turn around from seller zone and start to declineHello traders, I want share with you my opinion about Bitcoin. The price previously broke above the support line and made a strong bullish move from the buyer zone (99300–100500 points). After the breakout, the price started rising steadily and is now approaching the Seller Zone (108500–109500), which also coincides with the resistance line of the downward channel. This area has shown strong bearish pressure in the past. Every time the price entered this zone, it quickly reversed. It’s a key area where many traders seek short-term opportunities. Currently, price is just entering this zone again and showing early signs of weakening momentum. Given the channel's structure, past price behavior near this resistance level, and the presence of the seller zone, I expect BTCUSD to turn around soon. Once the price rejects this level, I anticipate a reversal and a move back into the channel, continuing the downward trajectory. My first target is set at 103000 points, near the center of the range and above the support level (100500). This area has been tested multiple times before and may act as a strong buffer again. Please share this idea with your friends and click Boost 🚀
Disclaimer: As part of ThinkMarkets’ Influencer Program, I am sponsored to share and publish their charts in my analysis.
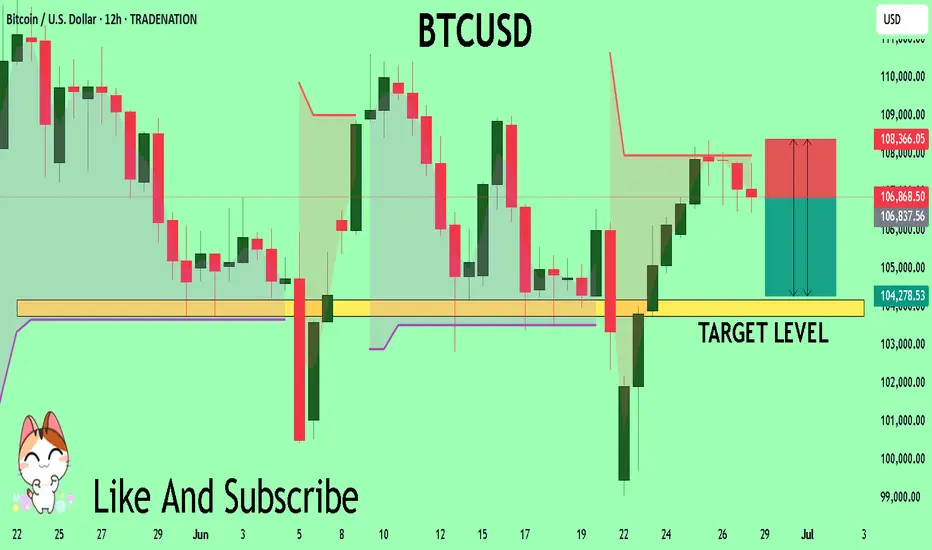
BTCUSD Trading Opportunity! SELL!
My dear subscribers,
This is my opinion on the BTCUSD next move:
The instrument tests an important psychological level 10686
Bias - Bearish
Technical Indicators: Supper Trend gives a precise Bearish signal, while Pivot Point HL predicts price changes and potential reversals in the market.
Target - 10417
My Stop Loss - 10836
About Used Indicators:
On the subsequent day, trading above the pivot point is thought to indicate ongoing bullish sentiment, while trading below the pivot point indicates bearish sentiment.
Disclosure: I am part of Trade Nation's Influencer program and receive a monthly fee for using their TradingView charts in my analysis.
———————————
WISH YOU ALL LUCK
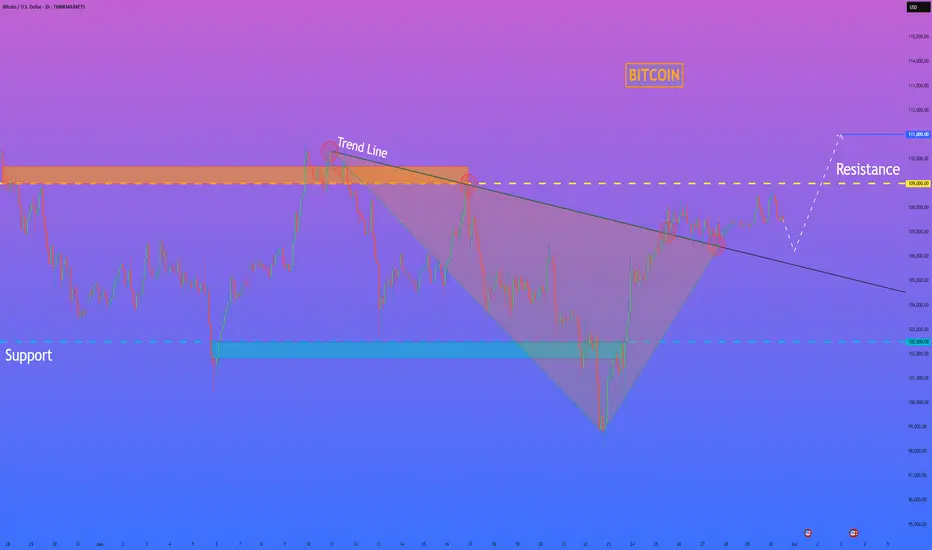
HelenP. I Bitcoin may continue grow and break resistance levelHi folks today I'm prepared for you Bitcoin analytics. After looking at this chart, we can see how the price broke the resistance level, which coincided with the resistance zone, and continued to move down next. When the price almost reached the support level, it turned around and tried to grow, but failed and dropped to the support zone. After this movement, BTC turned around and made an impulse up to the resistance zone, breaking the resistance level one more time. Then it reached the trend line and started to decline in a broadening wedge, where it broke the resistance level again. Later, the price even declined below the support level, breaking this level too and falling to the support line of the wedge pattern. Next, price turned around and made a strong impulse up to the resistance level, thereby breaking the support level with the trend line, exiting from the broadening wedge too. Bitcoin made a retest of the trend line and then continued to grow. In my opinion, BTCUSD will correct to almost to trend line and then rise to the resistance level. Then it can break this level and continue to move up; therefore, I set my goal at 111000 points. If you like my analytics you may support me with your like/comment ❤️
Disclaimer: As part of ThinkMarkets’ Influencer Program, I am sponsored to share and publish their charts in my analysis.
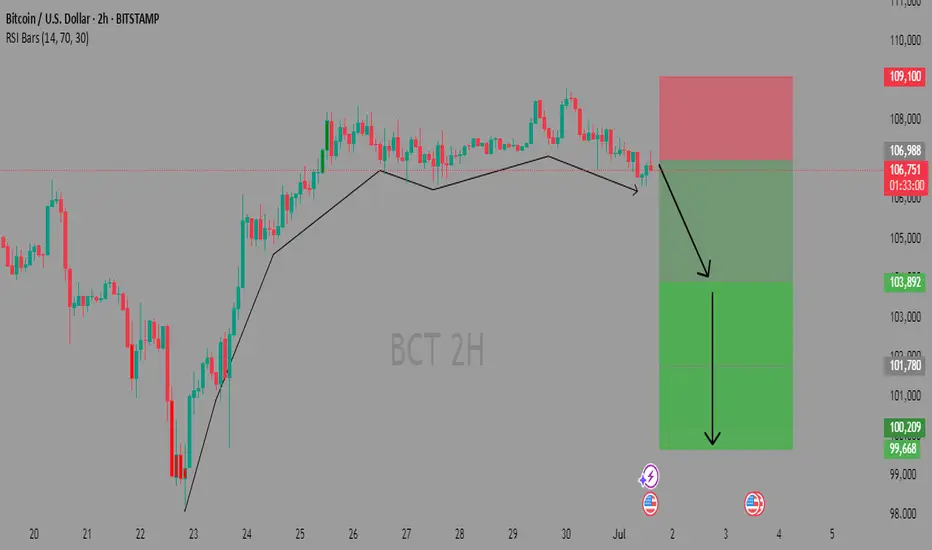
BTC 2HOURS BEARSH ANALYSISThe chart hasred and green bars showing price changes our 2 hours. tow arrows point to a red green box, indicating a possible trading plan. the also has lines and lable to help traders anderstand the market. its like a graph showing how the dollers value is changes .
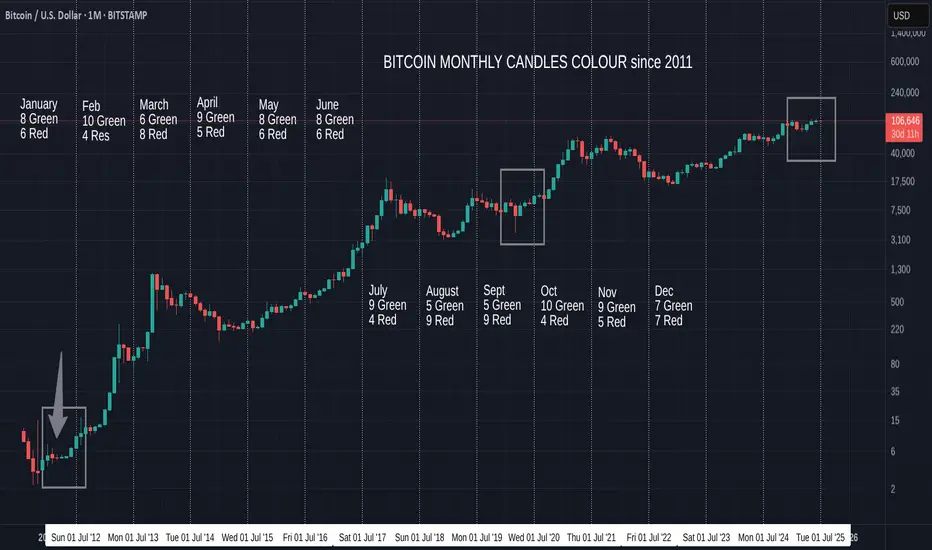
Bitcoin Monthly Candle Close colour and patterns since 2011
At the beginning of June , I wrote this
""On only 2 occasions have we had a GREEN JAN, RED FEB, RED MARCH, GREEN APRIL
And Both of them were on the way to ATH. (Boxes )
On both those occasions we also had a GREEN MAY, though the gains were minimal and one was followed by a Green June and the other by a Red June."
We just got the GREEN June and so this draws my eye to the sequence on the left, ( arrow )
If we are to follow this, then July should be a larger Green (Arrow) - BULLISH
In-fact, in both the sequences we have been following ( boxes), July was GREEN- BULLISH
And using just the month candle colours, we have a higher chance of another Green candle, with July having had 9 Green to 4 Red previously. - BULLISH
However
Of the previous 8 Green June Closes , only 3 went to a Green July - BEARISH
And I have to say, on NONE of the previous Green Junes were we so close to the current ATH.
July 2021 being the closest with a price at 41K, around 18K below the current ATH at the time.
We are currently only around 200 usd below Current ATH
This adds enormous resistance to the ability to rise
I wanted a RED June because I felt it was more sustainable and would lead to a cycle ATH at the end of the year. As can be seen in the middle Box
If we look back toward the 2012 Box on the left, we may now get a Hot July / August , September and then a Cool off for October, November & December.
But something tells me this will not happen.
The Candles for our current cycle in April, May and June are diminishing in size, the opposite of 2012
But they are similar to the 2020 box, except for the red June close.
This could lead to the desired "Cooling" in August & September and a new lift off in autumn.
And if you look at the chart Candle Colour Count, , August and September are usually RED by some majority
This also gives us the Bigger Green July candle that the "Odds" point towards.
So, as ever, we have to wait and see how this plays out.
Odds in favour of a Green July using previous cycle Data
PA position just below current ATH could lead to a slightly Bearish out look in the short term.
And if you are hoping to see ALTS Rally, PLEASE keep your eye on the BTC.D chart
This also points to wards BTC ATH in Q4 this year
And then, we have the BIG question.......Will we ever see a Classix Bear again ?
With so many Holding Bitcoin LongTerm.....How would a Bear market arrive ?
BUY BITCOIN
HOLD BITCOIN
But, as ever, we just have to wait and see,
Bitcoin - The Silent Ascent of Under Institutional Custody.⊢
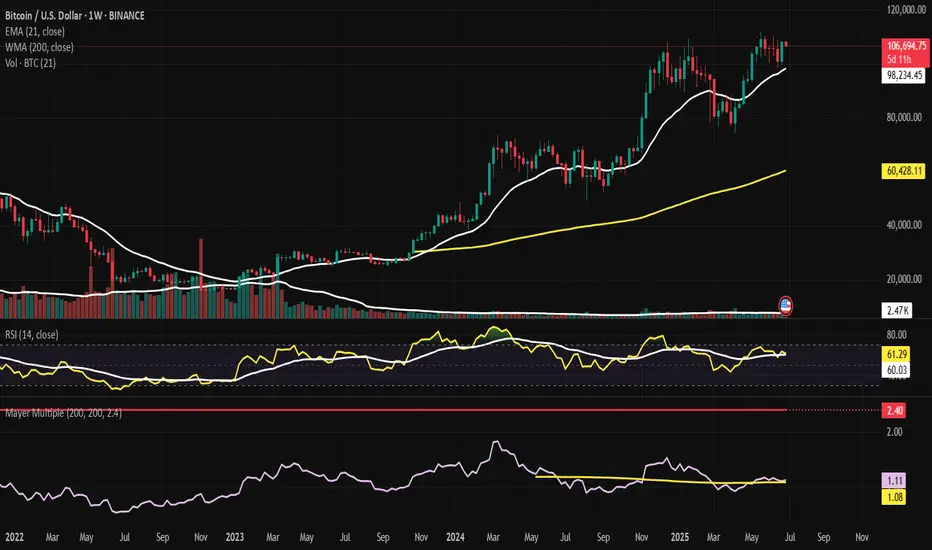
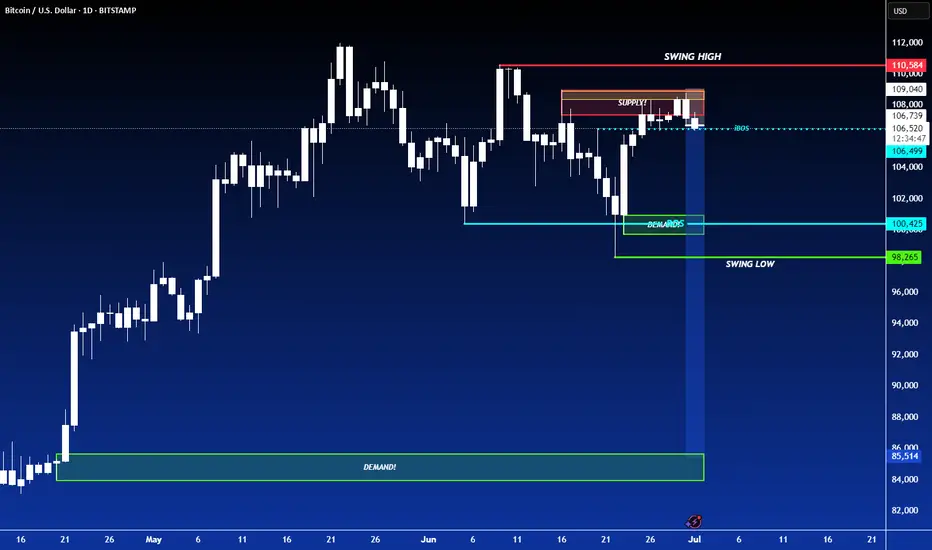
⟁ BTC/USD – BINANCE – (CHART: 1W) – (Date: July 01, 2025).
◇ Analysis Price: $106,464.00.
⊢
⨀ I. Temporal Axis – Strategic Interval – (1W):
▦ EMA21 – ($98,213.17):
∴ The EMA21 has provided dynamic mid-term support since early Q4 2024;
∴ Recent pullbacks respected the line precisely, confirming its role as tactical trend anchor.
✴ Conclusion: Tactical bullish posture maintained. Rejection above EMA21 signals controlled bullish continuation.
⊢
▦ Week Moving Average 200WMA – ($60,425.78):
∴ The 200WMA continues its upward ascent, now surpassing the symbolic $60k level;
∴ Price remains structurally elevated, approximately 76% above the WMA baseline, marking a strong long-term cycle support.
✴ Conclusion: Structurally bullish. The 200WMA acts as a deep support; no signs of cyclical exhaustion.
⊢
▦ Volume + MA21:
∴ Volume remains within normal bounds, with no explosive or capitulative behavior;
∴ The 21-week average volume shows steadiness, confirming institutional absorption rather than speculative frenzy.
✴ Conclusion: Price action is supported by consistent volume. There is conviction, not hype.
⊢
▦ RSI + EMA21 – (RSI: 61.01 | EMA: 60.00):
∴ RSI remains stable above the 60-threshold, traditionally a bull-control zone;
∴ The EMA21 on RSI sits just beneath it, reflecting sustainable momentum without overheating.
✴ Conclusion: Momentum is alive and consistent. Pressure is not euphoric, but persistently positive.
⊢
▦ Mayer Multiple – (1.11):
∴ The current Mayer Multiple (Price ÷ 200WMA) is at 1.11, far below critical cyclical warning zones;
∴ Historical peaks formed above 2.4–3.2×, placing current readings in neutral-to-accumulative territory.
✴ Conclusion: No signs of macro-top formation. Room for expansion remains open within cycle structure.
⊢
🜎 Strategic Insight – Technical Oracle:
∴ Bitcoin maintains an elevated stance above all major structural supports;
∴ No indicators suggest euphoric excess or terminal cycle behavior;
∴ Momentum, structure, and volume all reflect the essence of a mature but breathing bull cycle, silently advancing.
⊢
∫ II. On-Chain Intelligence – (Source: CryptoQuant):
▦ MVRV Ratio – (2.22):
∴ The current MVRV remains below the historical danger zone of >2.5;
∴ Price is elevated, but not euphoric - reflective of controlled structural ascent.
✴ Conclusion: BTC sits in the upper-middle band of valuation. No top formation indicated, but vigilance required.
⊢
▦ Exchange Reserve – (All Exchanges – 2.4M BTC (new low):
∴ Continuous decline in BTC held on exchanges since Q4 2022;
∴ Signals that coins are being withdrawn to self-custody – typical of conviction-based accumulation.
✴ Conclusion: Supply is drying from trading venues. This is fundamentally bullish and reduces short-term dump risk.
⊢
▦ Realized Cap – ($958B):
∴ The realized capitalization is climbing in tandem with price - without flattening or divergence;
∴ Indicates strong inflow of high-conviction capital setting new cost-bases.
✴ Conclusion: Market is absorbing price increases via real buyer interest. Structural support is being rebuilt at higher levels.
⊢
▦ Short-Term Holder Realized Price & Profit/Loss Margin:
∴ Profit margins are rising but remain beneath the historical 70% “euphoria line;”
∴ No extreme deviation between spot price and realized price.
✴ Conclusion: Profit-taking is occurring in equilibrium. No signs of unsustainable speculation.
⊢
▦ Spent Output Profit Ratio – (SOPR - 1.036):
∴ Values above 1 indicate net selling at a profit;
∴ However, the ratio is stable and modest – no spike.
✴ Conclusion: Profitable selling is active, but not excessive. Market is cycling profits without panic or climax.
⊢
▦ Stablecoin Supply Ratio - (SSR – 17.6):
∴ A high SSR means fewer stablecoins relative to BTC -> lower immediate buy-side liquidity;
∴ This aligns with observed euro-stablecoin inflows and USD retreat.
✴ Conclusion: Bitcoin price is rising without massive stablecoin inflow. Potential for future upside if SSR compresses.
⊢
🜎 Strategic Insight – On-Chain Oracle:
∴ All six indicators converge on a structurally bullish;
∴ Tactically stable market;
∴ There is no evidence of blow-off top, exhaustion, or manic distribution;
∴ Supply is retreating, valuation rising moderately, and profit cycles remain rational.
⊢
⧉ III. Contextvs Macro–Geopoliticvs – Interflux Economicvs:
▦ Macro-Structural Narrative:
∴ Bitcoin closed Q2 2025 with a +29.9% quarterly gain - (source: CryptoRank);
∴ The rally is attributed to growing institutional adoption, bolstered by pro-Bitcoin policies of the Trump administration, including treasury-on-chain initiatives;
∴ Macroeconomic tension around trade wars has eased, fueling upward movement in both BTC and the S&P 500, signaling synchronized risk-on appetite - (source: Coindesk).
✴ Conclusion: The quarterly momentum reflects fundamental confidence, not speculative heat, Bitcoin is tracking macro cycles and policy favorability - not detaching from economic logic.
⊢
▦ Liquidity Rotation Signal:
∴ While BTC saw a record monthly close above $106K in June, attention turned to the Euro, which surged ~4%, outperforming Bitcoin ~2.5% monthly gain - (source: Coindesk);
∴ This signals capital movement out of the USD and into alternative monetary zones, including euro-pegged stablecoins, highlighting a shift in liquidity strategy.
✴ Conclusion: Bitcoin performance remains strong, but stablecoin flows suggest hedging against USD, and potential cross-currency dynamics now influence crypto markets more than in past cycles.
⊢
▦ Institutional Absorption:
∴ Q2 2025 marked multiple treasury-scale Bitcoin purchases, the most notable was Strategy Inc.’s addition of $531 million in Bitcoin;
∴ Coindesk reports increasing movement of aged coins, suggesting long-term holders are realizing profit selectively, not exiting fully;
∴ Realized on-chain gains estimated around $2.4 billion, but SOPR and STH-P/L data show no speculative frenzy.
✴ Conclusion: Institutional reaccumulation is active - distribution is rational, not euphoric, the market is cycling profits, not dissolving conviction.
⊢
▦ Sentiment & Policy Alignment:
∴ Trump’s active endorsement of Bitcoin as a "strategic reserve instrument" has galvanized corporate treasuries and conservative capital;
∴ Policy signals from the U.S. now mirror early El Salvador-like rhetoric but on a scaled geopolitical stage;
∴ Meanwhile, legislative friction in the EU is softening, with euro-stablecoin flows confirming multi-jurisdictional bullish alignment.
✴ Conclusion: Bitcoin is evolving from speculative asset into a political-economic monetary instrument. Its adoption curve is now influenced by state-level policy vectors, not just market actors.
⊢
⧈ Synthesis – Silent Codex Verdict:
∴ Bitcoin’s Q2 expansion is rooted in structural convergence: (policy + macro easing + institutional inflows + on-chain discipline);
∴ The asset is not overheated, and continues to mature within a globalized, politically aware framework;
∴ The cycle breathes silently, with strength.
⊢
⌘ Codicillus Silentii – Strategic Note:
∴ Resistance remains near $110K–112K, region of monthly closure highs;
∴ EMA21 at $98K defines tactical floor - breach would signify shift in short-term conviction;
∴ SSR at 17.6 suggests temporary stablecoin dryness, delaying momentum ignition.
✴ Conclusion: Tactical posture is consolidative, awaiting macro or capital inflow catalyst.
Upside remains open, but not yet inevitable.
⊢
𓂀 Stoic-Structural Interpretation:
∴ Structurally Bullish – (Tactically Controlled);
∴ Bitcoin maintains long-term structural dominance, anchored above the 200WMA and supported by rising Realized Cap and exchange outflows;
∴ The RSI + EMA21 structure confirms active but non-euphoric momentum;
∴ MVRV at 2.22 and SOPR at 1.03 reflect profitable cycling, not late-stage irrationality;
∴ No blow-off volume or destabilizing divergence across timeframes.
✴ Conclusion: Bitcoin is in mid-cycle ascension, exhibiting maturity, discipline, and policy-aligned backing. The structural bullish thesis is intact.
⊢
⧉
⚜️ Magister Arcanvm – Vox Primordialis!
𓂀 Wisdom begins in silence. Precision unfolds in strategy.
⧉
⊢
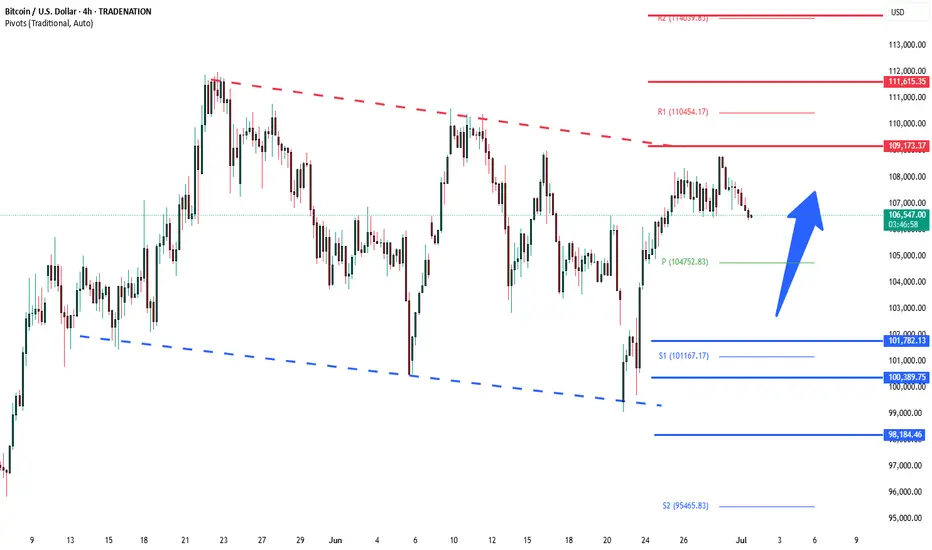
BTCUSD Bullish sideways consolidation supported at 101.780Trend Overview:
BTCUSD remains in a bullish trend, characterised by higher highs and higher lows. The recent intraday price action is forming a continuation consolidation pattern, suggesting a potential pause before a renewed move higher.
Key Technical Levels:
Support: 101,780 (primary pivot), followed by 100,380 and 98,184
Resistance: 109,170 (initial), then 111,600 and 114.140
Technical Outlook:
A pullback to the 101,780 level, which aligns with the previous consolidation zone, could act as a platform for renewed buying interest. A confirmed bounce from this support may trigger a continuation toward the next resistance levels at 109,170, 111,600, and ultimately 114,140.
Conversely, a daily close below 101,780 would suggest weakening bullish momentum. This scenario would shift the bias to bearish in the short term, potentially targeting 100.390 and 98,180 as downside levels.
Conclusion:
BTCUSD maintains a bullish structure while trading above the 101,780 support. A bounce from this level would validate the consolidation as a continuation pattern, with upside potential toward the 109,170 area. A breakdown below 101,780, however, would invalidate this view and suggest deeper corrective risk.
This communication is for informational purposes only and should not be viewed as any form of recommendation as to a particular course of action or as investment advice. It is not intended as an offer or solicitation for the purchase or sale of any financial instrument or as an official confirmation of any transaction. Opinions, estimates and assumptions expressed herein are made as of the date of this communication and are subject to change without notice. This communication has been prepared based upon information, including market prices, data and other information, believed to be reliable; however, Trade Nation does not warrant its completeness or accuracy. All market prices and market data contained in or attached to this communication are indicative and subject to change without notice.
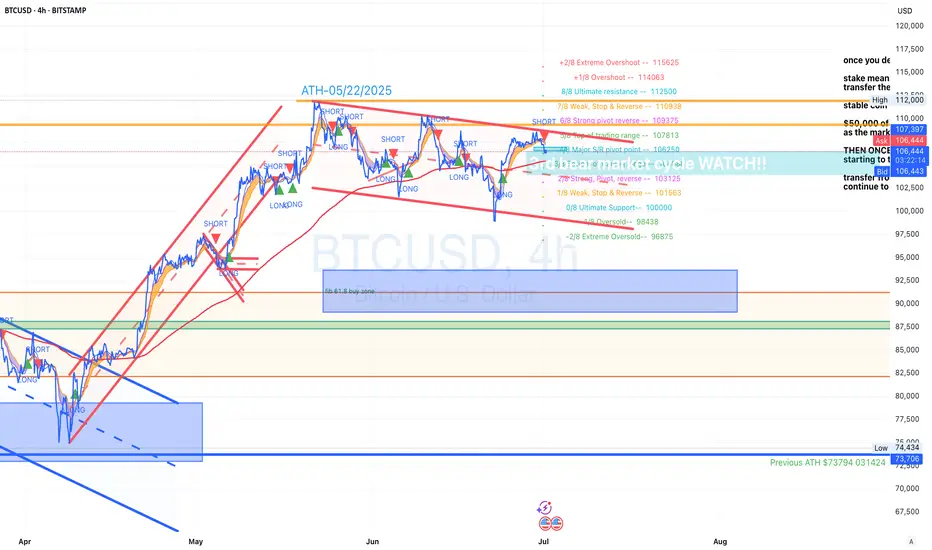
BTCUSD entering 3rd bear market cycle BTCUSD has bounced off of the top of a 4H descending channel and has now began moving in the 3rd bear market cycle
i will be watching for the market to reach the mid line in the channel and possibly to the bottom of the channel for another retest.
Opinion: This analysis is for education purposes only and is just my analysis, this is not a trade idea.
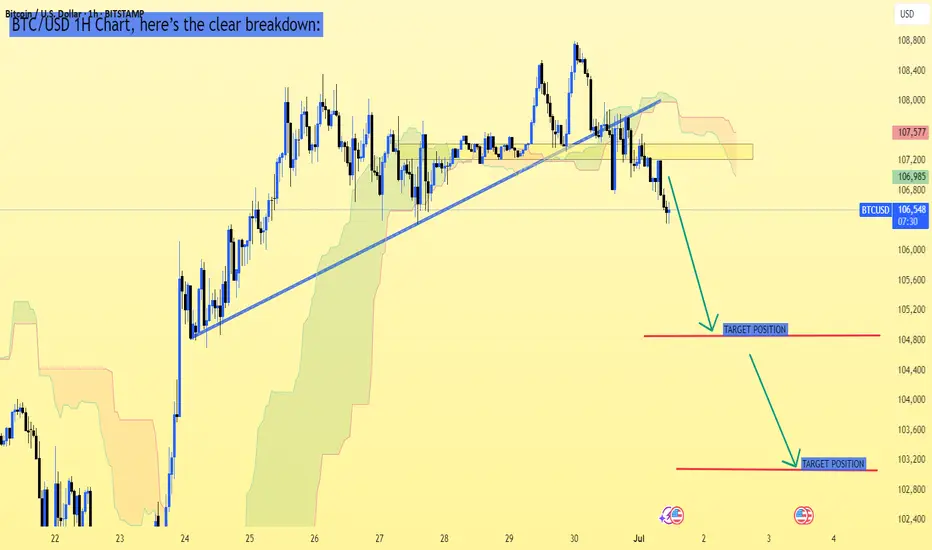
BTC/USD 1H Chart, here’s the clear breakdown:BTC/USD 1H Chart, here’s the clear breakdown:
---
Current Price:
Around 106,636 USD
---
Bearish Setup Observations:
Price has broken the ascending trendline support
Price is below Ichimoku Cloud — bearish confirmation
Retest of broken trendline area failed, suggesting more downside
---
Target Levels Based on Your Chart:
✅ First Target: Around 105,200 - 105,400 USD
✅ Second Target (Final Target): Around 103,200 - 103,500 USD
---
Conclusion:
Bearish momentum is strong; watch for price to test 105,200 zone
If that level breaks, likely move toward 103,200
Resistance area remains near 107,200 - 107,500 (good stop-loss zone for shorts)
---
Would you like a risk management suggestion for this setup? Let me know!
SHORT ON BITCOINBITCOIN has continue to create lower highs at a major resistance zone.
I will be selling bitcoin looking to make over 8000 to 20,000 points.
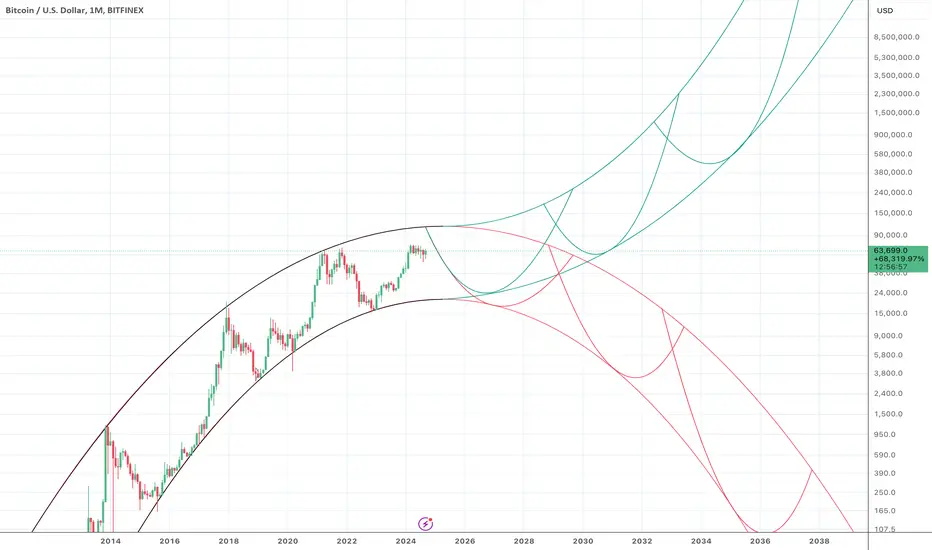
BTCUSD - The Binary Set of Possible Futures for BitcoinBitcoin priced in dollars will eventually go to infinity or to zero.
This chart is a more precise model of an idea I've been toying with for a few months. It fits the past price cycles extremely accurately, if we are willing to disregard the lower end of the Covid crash wick and stick to monthly closes. It also predicts the binary set of possible futures for Bitcoin in an extremely elegant way.
According to this model, regardless of which path Bitcoin price takes after this cycle, we will see a top around $111,800 around spring 2025 - April 2025 if it hits the nadir of the arch exactly.
We will have a strong clue about which of the two futures (infinity or zero) Bitcoin is headed towards when we see whether it bottoms near $16,000 (Bitcoin to Zero) or bottoms near $24,000 (Bitcoin to Infinity) next bear market.
The model predicts hyperinflation of the dollar in 2037 on the "Bitcoin infinity path," or alternatively Bitcoin to digital trash in 2036 on the "Bitcoin zero path."
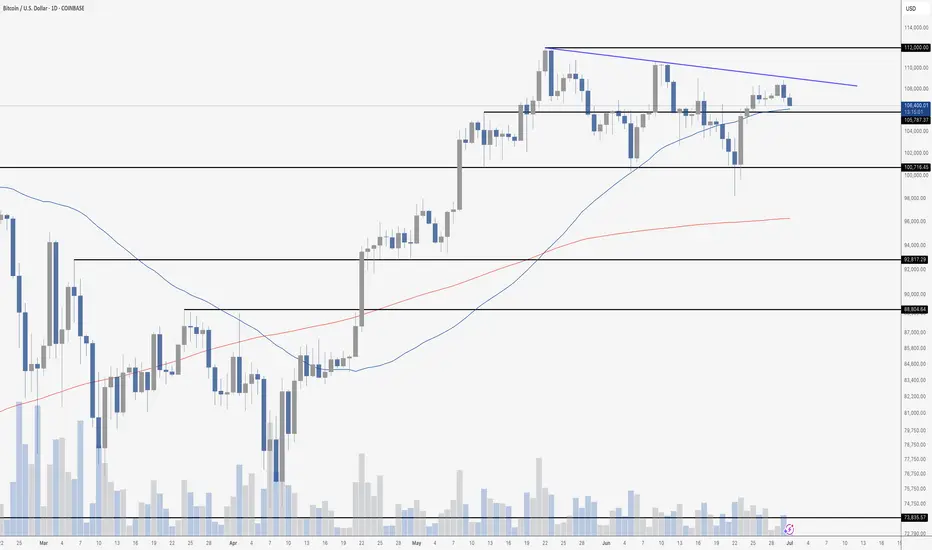
Bitcoin ConsolidatesBitcoin is currently consolidating just below a clear descending trendline, showing a series of lower highs since its recent local top near $112,000. Price is hovering around $106,300, holding just above key horizontal support at ~$105,800. This level coincides with the 50-day moving average (blue), which is currently acting as dynamic support.
So far, Bitcoin has respected the ~$100,700 level as major support after the mid-June shakeout. As long as price remains above that zone and holds the 50 MA, the bullish structure remains intact despite the short-term lower highs. But the more price compresses beneath the descending resistance, the more likely we see a breakout (or breakdown) soon.
The 200-day moving average (red) is well below current price action, hovering near $95,000. That’s a long way down and would likely only be tested if broader market conditions deteriorate significantly.
Volume is tapering, suggesting traders are waiting for a decisive move. A break above the descending trendline and reclaim of $110,000+ would invalidate the current short-term downtrend and likely bring $112,000 and new highs into view. A loss of $105,800, on the other hand, puts $100,700 back in play – and below that, things could get ugly quickly.
For now, the trend is neutral within a broader uptrend. The bulls are holding the line – but just barely
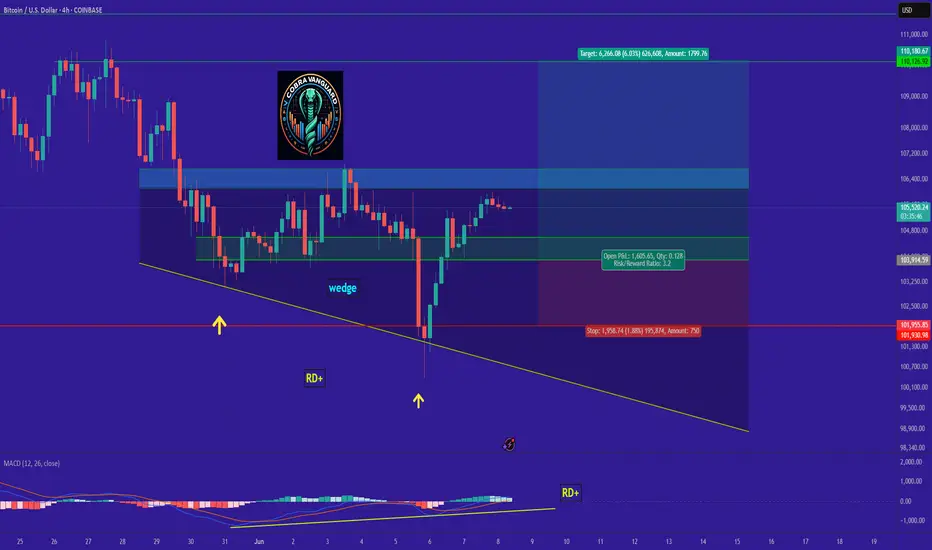
Bitcoin is bullish now & many Traders don't see it !!!I currently expect the price to correct slightly, as indicated on the chart, and then pump by about 6% from the PRZ . This signal is reinforced by strong positive divergence and a wedge pattern. In summary, the PRZ is a solid entry point, derived from the confluence of touchlines and pivots. However, if the price ignores this zone and falls below it, my analysis will be invalidated.
Best regards CobraVanguard.💚