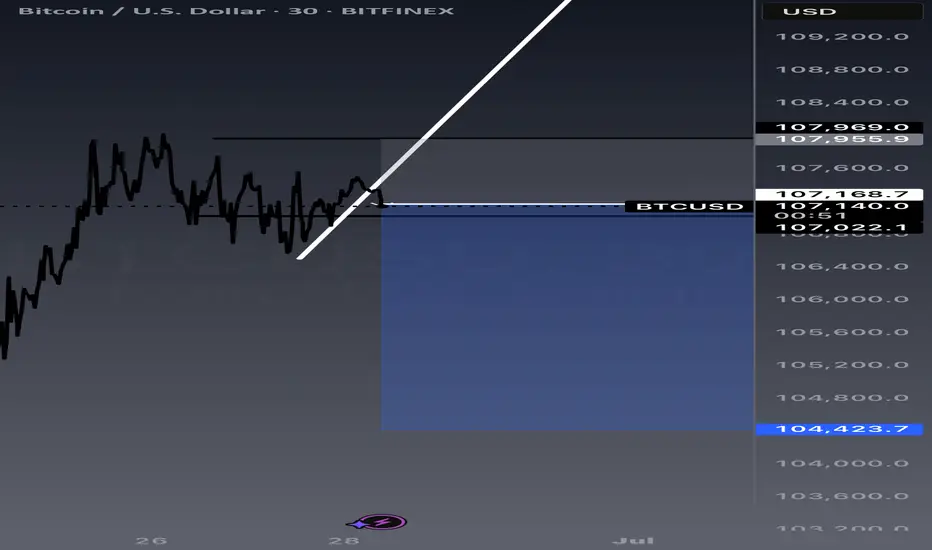
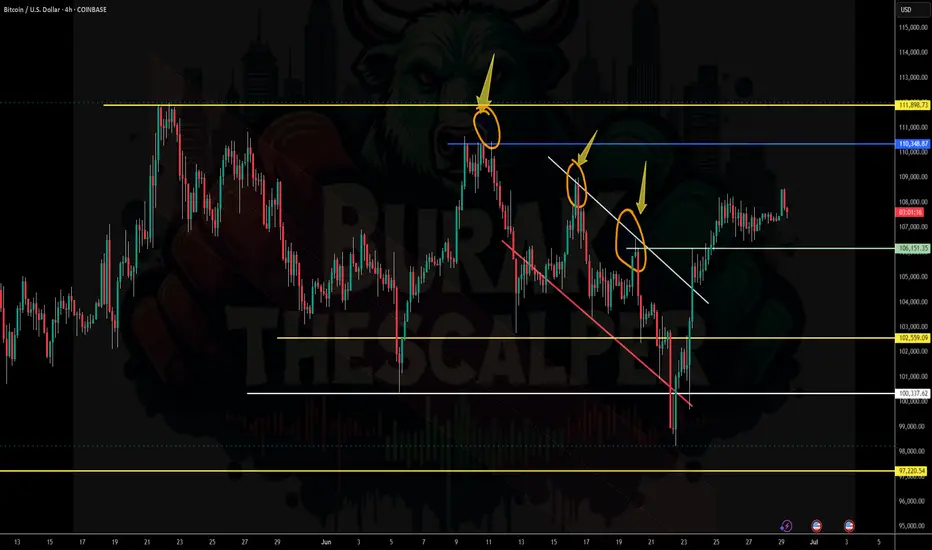
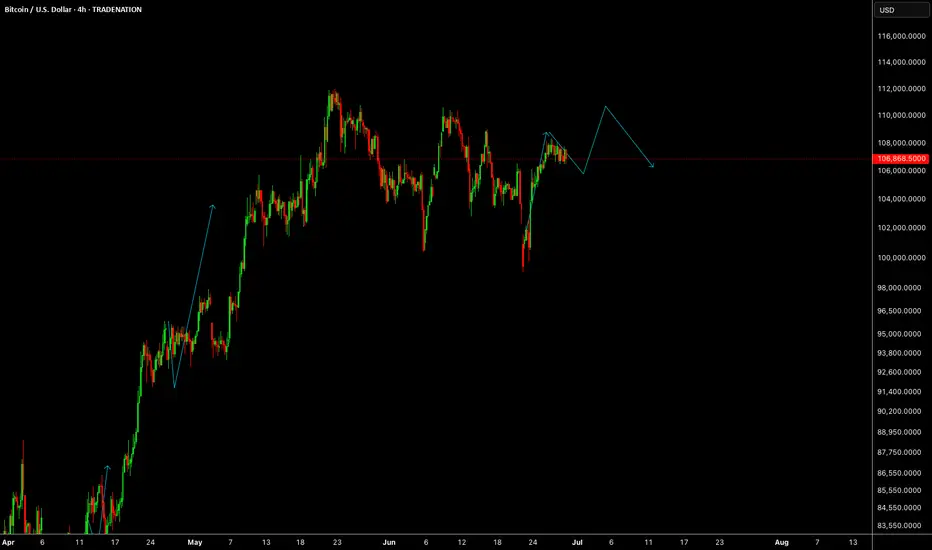
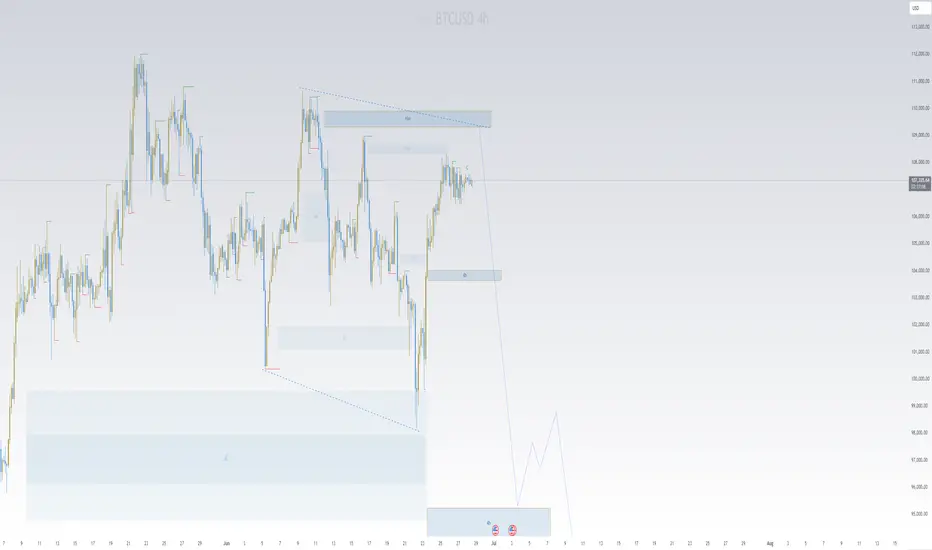
BITCOIN NEXTKind of a Messy coorective Structure, this is What I can see right now with the movemments it has done
YIf you lower the time frame you should see the complete map also levels are Highlighted
It should go as follows
Buy from now @ 107.600 to 108.500
Sell from @ 108.500 to 105.000
buy from @ 105.000 to 111.000
Sell from @ 111.000 to 96.000
Buy from @ 96.000/ 94.000 to 120.000 and 130.000
GG
BITCOIN trade ideas
$BTC: Breakout Loading – Massive Opportunity Ahead! BTC is consCRYPTOCAP:BTC : Breakout Loading – Massive Opportunity Ahead!
BTC is consolidating within a major structure for 224+ days. Current price action is forming a bull flag, signaling strong potential for a breakout toward $120,000–$150,000. Short-term volatility expected, but long-term trend remains bullish.
🔸 Support at $90,000–$93,000:
Strong confluence in this region including CME gap, liquidity pools, and previous structure support. Rejection from $113K could trigger a flush into this zone. Long setups should be considered here. Whales are accumulating.
🔸 Upside Target: $120,000 – $150,000
Long-term breakout from consolidation range aligning with historical accumulation patterns and macro indicators like M2 lag. Break of $113K with strength opens doors to $120K+. Clean structure with confirmed support will fuel rally continuation.
🔸 Risk Level at $88,000:
If BTC breaks below $88K with volume and closes under structure, it would invalidate the bull flag scenario short-term and signal deeper correction.
🔸 Outlook:
Monitor price reaction near $113K. Prepare for fakeout and potential sweep into $90K–$93K zone. Place laddered long orders in that range for optimal R:R. If dip occurs, treat it as a gift entry. No bearish outlook unless macro conditions shift drastically. Momentum remains upward.
here is the #chart #btc $bitcoin
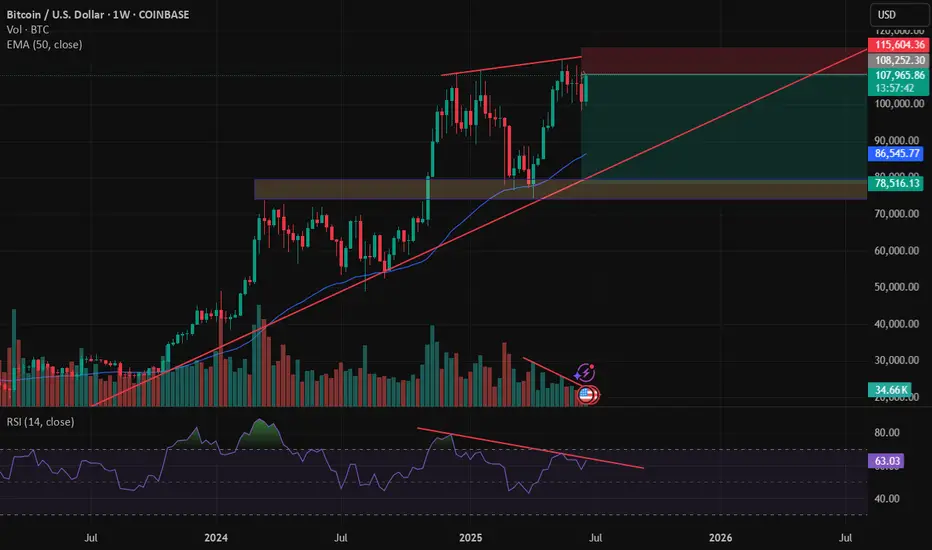
Cautiously bullish. Bitcoin is trading at $107,983.70, up 6% from last week but 3% below its all-time high of $111,891.30 (May 22, 2025). Technicals show a strong buy signal with the 50-day and 200-day moving averages supporting an upward trend. Posts on X suggest a weekly close above resistance ($108k) could push BTC to new highs ($112k-$120k). However, bearish divergence on weekly charts and tariff-related volatility introduce risks. Pro-crypto policies and Fed rate cut expectations bolster optimism, but a potential pullback to $100,400 support looms if momentum fades.
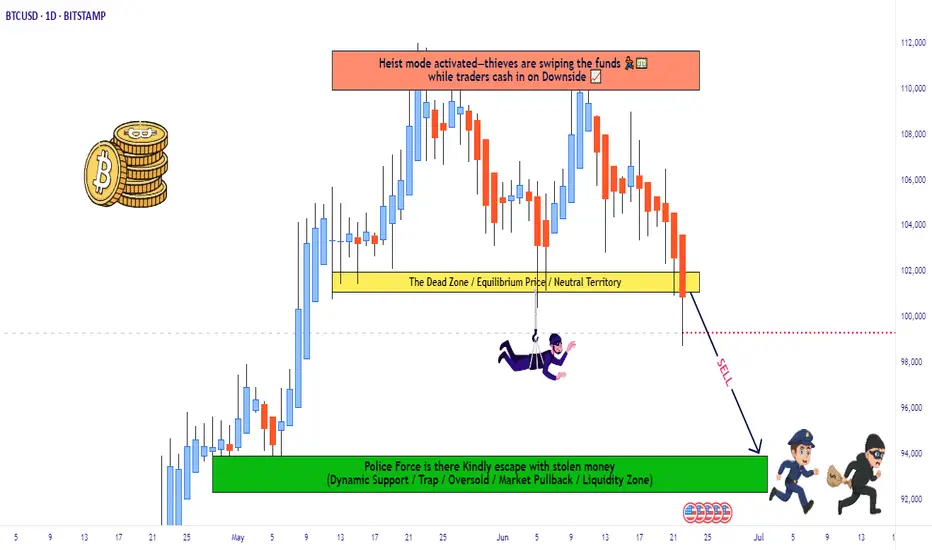
Thief Trader Setup: Robbing the BTC/USD Market Reversal🏴☠️💰 Bitcoin Heist Blueprint: BTC/USD Robbery Plan by the Thief Trader Crew 💰🏴☠️
(Swing & Day Trade Outlook – Clean Entry, Clean Exit, No Fingerprints Left Behind)
🌟 Hi! Hola! Ola! Bonjour! Hallo! Marhaba! 🌟
To All Market Raiders & Silent Money Makers 🤑💸💰✈️
This isn't your average BTC/USD analysis — this is a strategic market heist, crafted from the Thief Trading Playbook.
We're planning a clean operation based on both technical setups and fundamental awareness.
Let’s enter smart, exit faster, and leave no trace — just profit. 🏆
🎯 THE GAME PLAN: Unlocking the BTC/USD Vault
📈 Entry – “The Vault’s Cracked Open!”
The plan kicks off with retest entries on the 15 or 30-minute chart.
Sell limits should be placed around recent highs or lows where market momentum pulls back.
Precision and patience are your tools.
🛑 Stop Loss – Backup Escape Route
Use the 1D swing high/low (e.g., 104.500) as your SL zone.
Position size smartly, factoring in risk %, lot size, and number of active orders.
🏁 Target – 94.000 (Or Bail Out Before It Gets Hot)
Don’t stick around too long — cash out near the zone or before if price slows or traps emerge.
Secure the bag, vanish before resistance bites back.
🧲 Scalpers – Quick In, Quick Out!
Stick to the short side only — short the bounces, trail your SL, and move with stealth.
Big players can strike straight; others can shadow the swing crew and trail behind with protection.
🧠 Why This Works – Market Pulse
BTC/USD is facing overbought pressure, consolidation traps, and is nearing a critical MA Zone where reversals tend to form.
Momentum shows signs of weakening, and the bears are regrouping — that’s where we slip in and out.
Supporting Factors Include:
Macro trends
Fundamental sentiment
COT positioning
On-Chain signals
Intermarket flow
Key psychological levels
🔍 All these build the narrative behind this bearish setup. This is more than just price action — it's a calculated move.
⚠️ Trading Risk Alert: Stay Off the Radar During News Drops 📰🚨
Avoid new entries during major news events — increased volatility = increased risk.
Use trailing stop-losses to lock in profits while staying protected during spikes.
❤️ Like the Plan? Power the Crew!
If this setup helped you see the market differently, hit the 💥Boost Button💥.
Every like supports the effort and helps sharpen our future plans.
Trade with style, move with purpose — Thief Trader Style.
🚀 Stay tuned for the next setup from the shadows. Until then — stay sharp, stay strategic, and always protect your profits. 🐱👤💰📉📈
BTCUSD: Bulls Are Winning! Long!
My dear friends,
Today we will analyse BTCUSD together☺️
The price is near a wide key level
and the pair is approaching a significant decision level of 107,630.73 Therefore, a strong bullish reaction here could determine the next move up.We will watch for a confirmation candle, and then target the next key level of 108,207.06.Recommend Stop-loss is beyond the current level.
❤️Sending you lots of Love and Hugs❤️

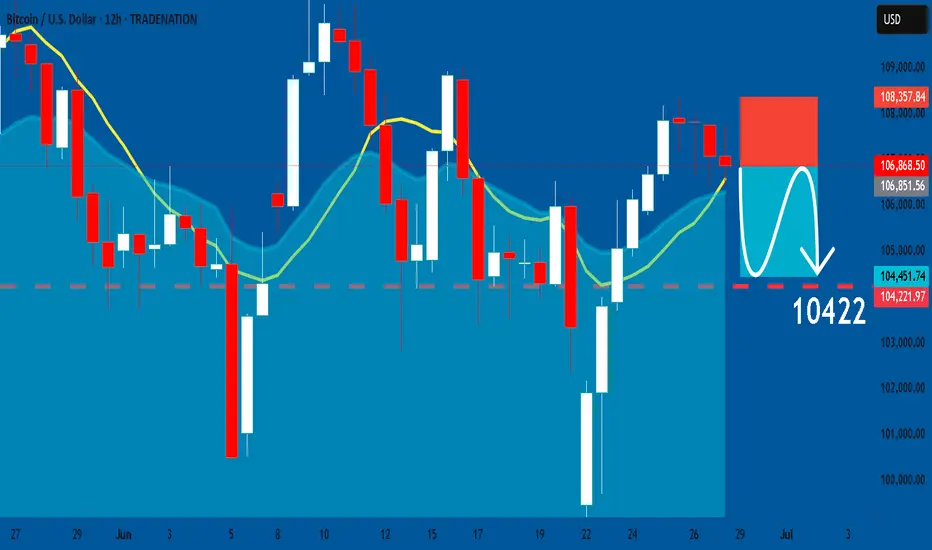
BTCUSD: Bearish Continuation & Short Signal
BTCUSD
- Classic bearish pattern
- Our team expects retracement
SUGGESTED TRADE:
Swing Trade
Sell BTCUSD
Entry - 10686
Stop - 10837
Take - 10422
Our Risk - 1%
Start protection of your profits from lower levels
Disclosure: I am part of Trade Nation's Influencer program and receive a monthly fee for using their TradingView charts in my analysis.
❤️ Please, support our work with like & comment! ❤️
BTC Slumps Below 100000, Rebounds to Test 109500 Short Zone💎 BTC Rebounds After 100000 Drop, Eyes Short at 109500 Resistance 📊
BTC dipped below the 100000 threshold 🔻 before rebounding near 98000 🔺—a move tied to DXY weakness and easing geopolitical tensions. Now challenging the 110000 mark 🔼, it faces stiff resistance at 109500. First-time 110000 tests often spark pullbacks, making shorts the favored play here 📉.
🚀 Sell@108500 - 107500
🚀 TP 106500 - 105500
Accurate signals are updated every day 📈 If you encounter any problems during trading, these signals can serve as your reliable guide 🧭 Feel free to refer to them! I sincerely hope they'll be of great help to you 🌟 👇
BITCOINBTC needs correction and one more push up before a drop to complete the correction.
Disclosure: We are part of Trade Nation's Influencer program and receive a monthly fee for using their TradingView charts in our analysis.
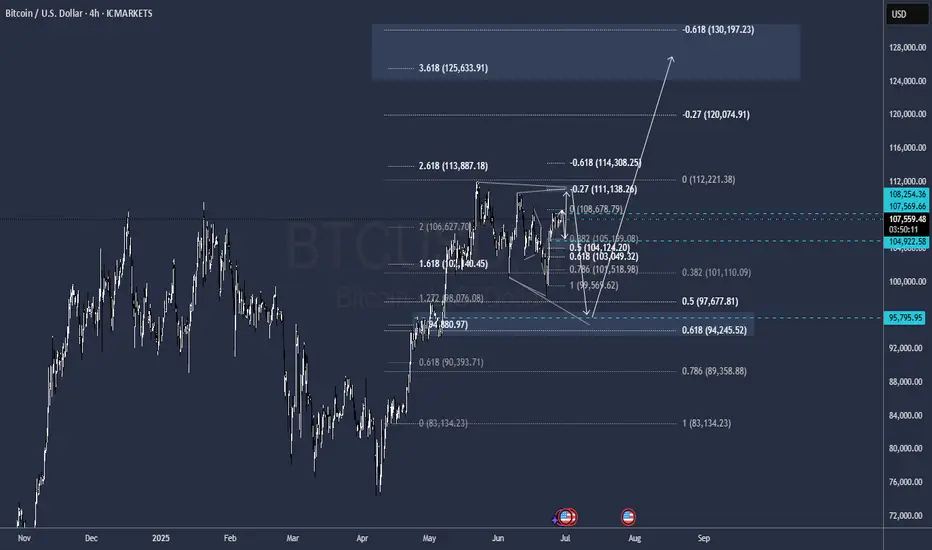
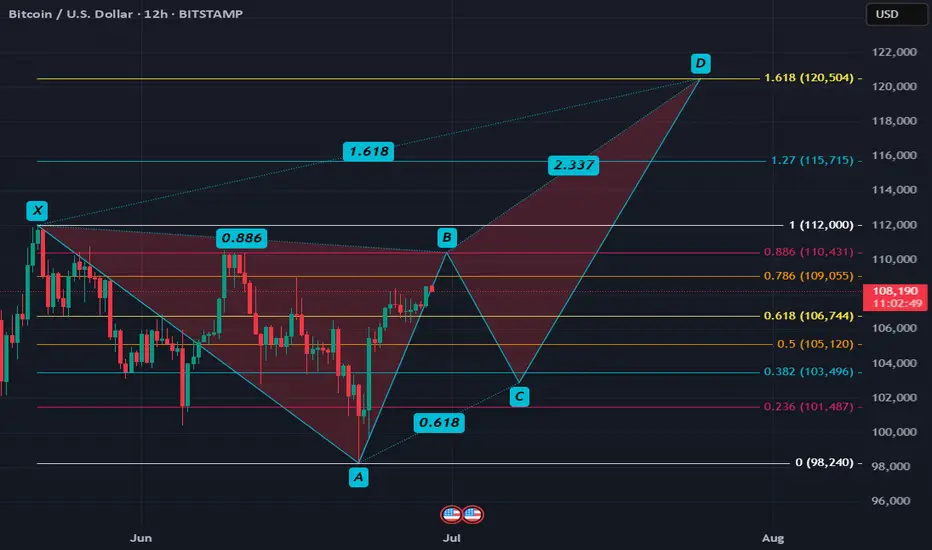
My Fav BTC Scenario Deep CrabThis is my favorite BTC htf scenario. Deep crab to 120kish with likely deviation above, potentially cycle ending.
If BTC rejects at that .786 then we have a butterfly to 115k
BTCUSD is on a downtrendFrom the chart and from the technical analysis, we will see that btcusd is about to fall to 99000 or below. So, its time we enjoy btc as trader.
Reasons;
1] In 4 hr, we can see a third trendline is about to touch which is signal for sell.
2] Also, at the same point you can still see a horizontal resistance line, which is a signal for sell.
3] If the trendline below is broken, its also a signal to sell.
Always wait for a confirmation and trade responsibly. Thanks and don't forget to follow me for more good analysis.
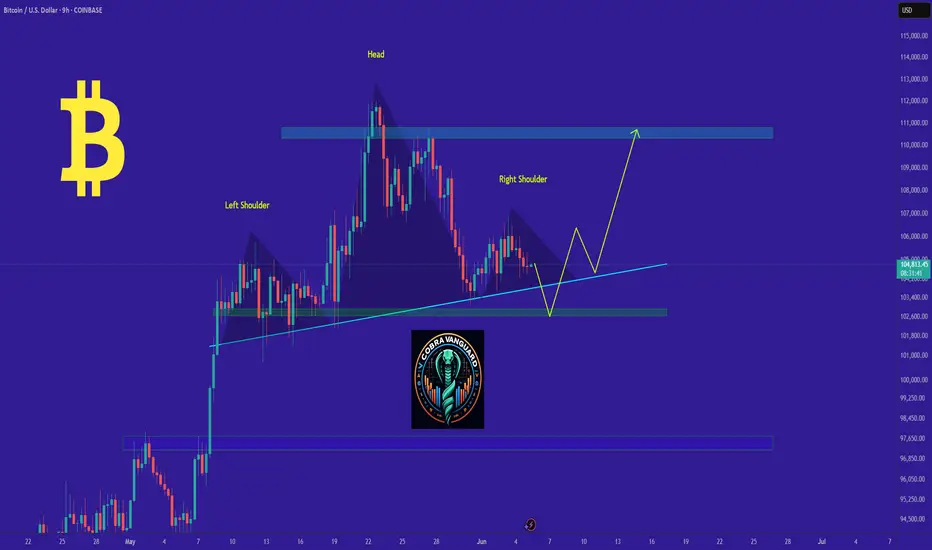
This is a deception or maybe a technique !!!I think this head and shoulders pattern is trying to deceive us and is fake. I expect the price to drop to the support line and then rise to $109k. WAIT FOR IT....
Give me some energy !!
The Crypto Market Game: How to Win Against Fear and Manipulation
Did you really think profiting from the current bull run (a comprehensive upward market) would be easy? Don't be naive. Do you think they’ll let you buy low, hold, and sell high without any struggle? If it were that simple, everyone would be rich. But the truth is: 90% of you will lose. Why? Because the crypto market is not designed for everyone to win.
They will shake you. They will make you doubt everything. They will create panic, causing you to sell at the worst possible moment. Do you know what happens next? The best players in this game buy when there’s fear, not sell—because your panic gives them cheap assets.
This is how the game works: strong hands feed off weak hands. They exaggerate every dip, every correction, every sell-off. They make it look like the end of the world so you abandon everything. And when the market rises again, you’re left sitting there asking, “What just happened?”
This is not an accident. It’s a system. The market rewards patience and punishes weak emotions. The big players already know your thoughts. They know exactly when and how to stir fear, forcing you to give up. When you panic, they profit. They don’t just play the market—they play you. That’s why most people never succeed: they fall into the same traps over and over again.
People don’t realize that dips, FUD (fear, uncertainty, doubt), and panic are all part of the plan. But the winners? They block out the noise. They know that fear is temporary, but smart decisions last forever.
We’ve seen this play out hundreds of times. They pump the market after you sell. They take your assets, hold them, and sell them back to you at the top—leaving you with nothing, wondering how it happened.
Don’t play their game. Play your own.
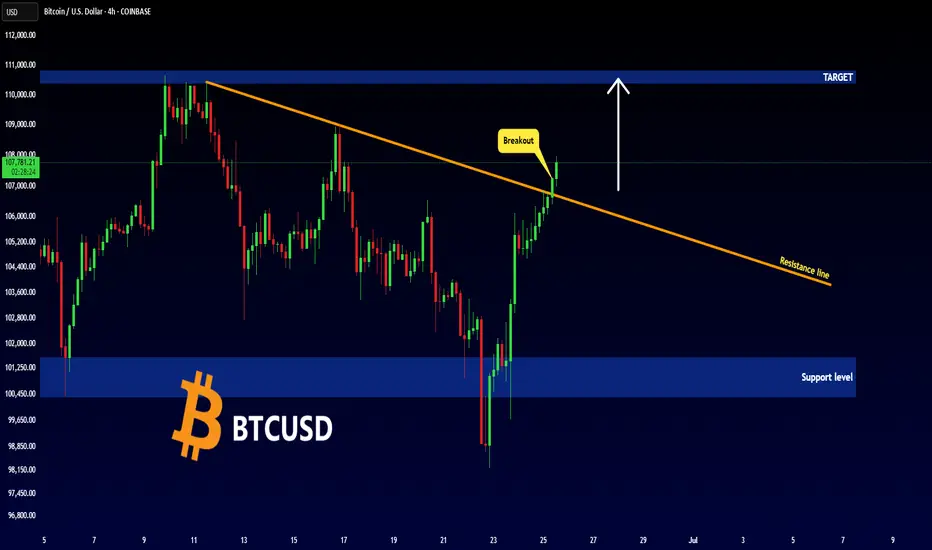
BITCOIN - NEW BREAKOUT !Hello Traders !
The BTC failed to break the support level (101570 - 100377).
Currently, The resistance line is broken !
So, I expect a bullish move🚀
___________________
TARGET: 110400🎯
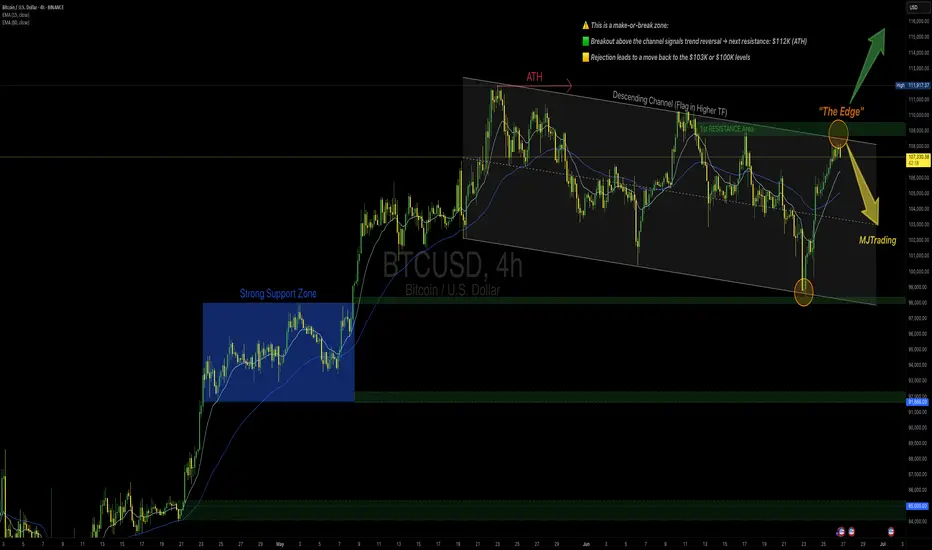
BTCUSD – Major Decision Point at The Edge📍 By: MJTrading |||
Bitcoin has rallied sharply from ~$98K and is now testing a critical confluence zone — the top of the descending channel and a strong supply area, known as "The Edge."
EMAs are turning up, supporting bullish momentum
⏳ What’s Next?
At this stage, two scenarios emerge:
⚠️ This is a make-or-break zone:
🟩 Breakout above the channel signals trend reversal → next resistance: $111K
🟨 Rejection leads to a move back to the $103K or $100K levels
This setup offers a high-RR opportunity for both breakout traders and mean reversion players.
🧠 Trade the reaction at the edge, not the prediction.
Thanks for your attention...
Share your thoughts...
—
#BTCUSD #Bitcoin #CryptoTrading #TheEdge #BreakoutOrBounce #CryptoSetup #DescendingChannel #SmartMoney #TechnicalAnalysis #PriceAction #SwingTrade #EMA #RiskReward #MJTrading #4hChart #TrendDecision #SupplyZone
A run down to the sea of stop loss before it goes up again?We could see a potential correction as we are seeing a double top with a temporary loss of momentum to the upside according to the RSI and volume. It's a valid trade until Trump says otherwise.
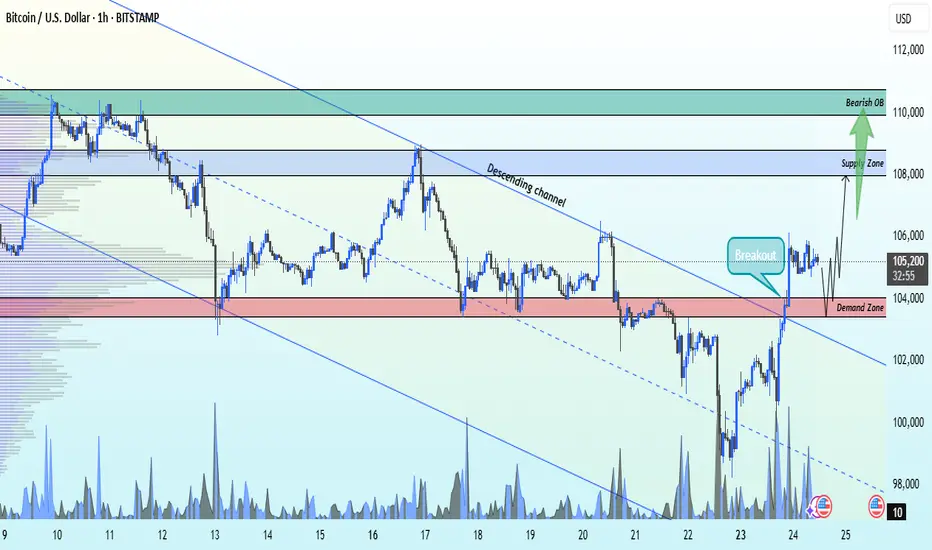
BTCUSD Descending channel breakout bullish possible from SupportBTCUSD Breakout Alert!
1H Timeframe Analysis
Bitcoin has broken out of the descending channel with a strong bullish candle — signaling a potential reversal from the key demand zone around 103,600.
📈 Technical Targets:
🔹 First Target: 108,000
🔹 Second Target: 110,000
This breakout could offer a solid long opportunity, but as always — manage risk wisely! ✅
💬 What’s your bias?
❤️ Like | 🔁 Share | 💭 Comment
📲 Join us for more real-time updates and insights!
#BTC #Bitcoin #CryptoTrading #TechnicalAnalysis #Breakout #BullishMomentum
BTCUSD Trade Setup - 28/Jun/2025Hi Traders,
I expect this pair to go Down after finishing the correction.
1) Need to wait for market to show changing of the direction.
2) The first reaction zone foe me will be at 95000 level followed by 89000 level.
3) Need to observe the characteristic of the move coming down in order to understand if market is planning to go up without coming to those levels.
Current expectation for investing is to see market dropping to 89000 level and then start to look for entry.
I only invest in BTC so no shorts for me but market shows potential to give a reversal soon and give a decent down move.
BTC/USD 1DHello everyone, let's look at the 1D BTC chart to USD, in this situation we can see how the 3rd peak formed us and we are currently fighting to maintain the price or a potential output up if we do not see a try to break out, you can expect a stronger relief.
However, let's start by defining goals for the near future the price must face:
T1 = 108376 $
T2 = 110473 $
Т3 = 112061 $
Let's go to Stop-Loss now in case of further declines on the market:
SL1 = 105444 $
SL2 = 103637 $
SL3 = 100644 $
SL4 = 98285
Looking at the RSI indicator, we see
As we entered the upper part of the indicator again, however, there is still a place to try to grow.
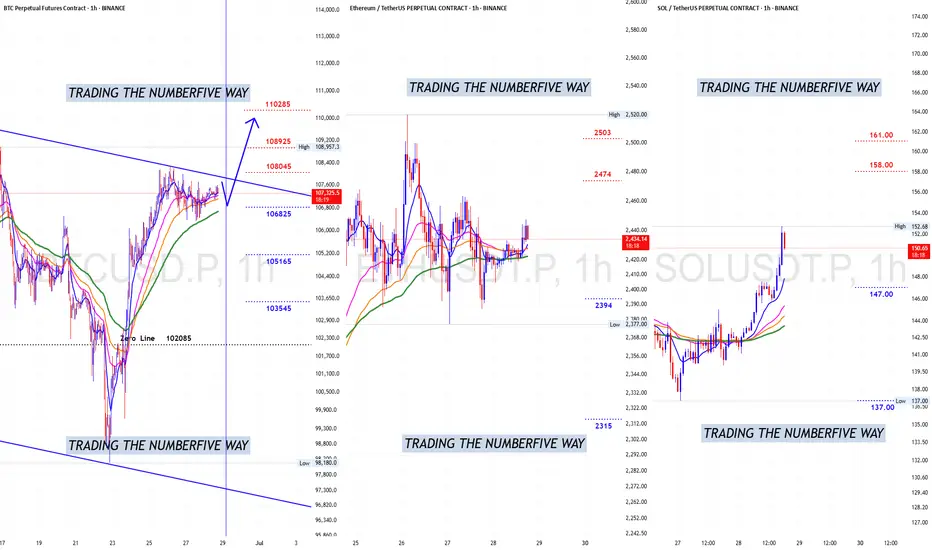
Bitcoin 1hr Bullish Again?Hello ladies and gentlemen, is Bitcoin preparing for another 1hr Bullish TIME Cycle?
Well looking at the current 1hr Bearish TIME Cycle in progress and is well noticeable that bears just don't have power enough to push price down to its Zero Line $102085 and according to TIME left on bears side we can say that in the next 6hrs (if not sooner) the 1hr Bullish TIME Cycle will be re-taken again pushing price to above $109000, but don't expect much from next spike cause the Daily Bullish TIME Cycle is NOT ready yet but once it gets ready probably by end of first wee of July it will try to break the ATHs again, lets don't forget that the weekly still in a UPtrend direction and as long as the Zero Line is NOT breached then ATHs still on the table. Buckle up ladies and gentlemen cause wild...wild....wild volatility is coming back. Use lev wisely.
BTC Dominance and the “Double Top” Pattern🧠 BTC Dominance and the “Double Top” Pattern
1. What is a “Double Top” in BTC Dominance?
A Double Top is a bearish chart pattern formed by two peaks near the same resistance level. If the price (or dominance in this case) breaks below the neckline (middle support), it signals a potential trend reversal from bullish to bearish.
⸻
2. Is BTC Dominance forming a Double Top?
• Analysts suggest BTC dominance may be forming a double top, with two highs near the same level.
• However, it hasn’t confirmed yet. A breakdown below the neckline would confirm the reversal.
• If confirmed, this suggests that capital may start flowing from Bitcoin into altcoins.
⸻
3. What Does It Mean?
• If the Double Top is confirmed (dominance drops) → Bitcoin loses market share → capital flows to altcoins → possible start of a new Altseason.
• If dominance holds or increases → Bitcoin remains the market’s safe haven → altcoins may remain weak.
⸻
4. Current Context & Outlook
• BTC Dominance is now near 64%, a multi-year high, largely driven by institutional interest and Bitcoin ETFs.
• Historically, such highs are followed by rotations into altcoins, especially when traders seek higher returns.
• A confirmed drop in dominance might trigger runs in altcoins like ETH, SOL, or meme coins.
New 5 wave cycle?This is my idea for a new 5 wave cycle. Targets for each wave are in the chart. Could this be wave 1 of 5? Possible top for wave 5 in 2033 or around this time. After, our first real bear market, multiple years ( Maybe 5 or so)?

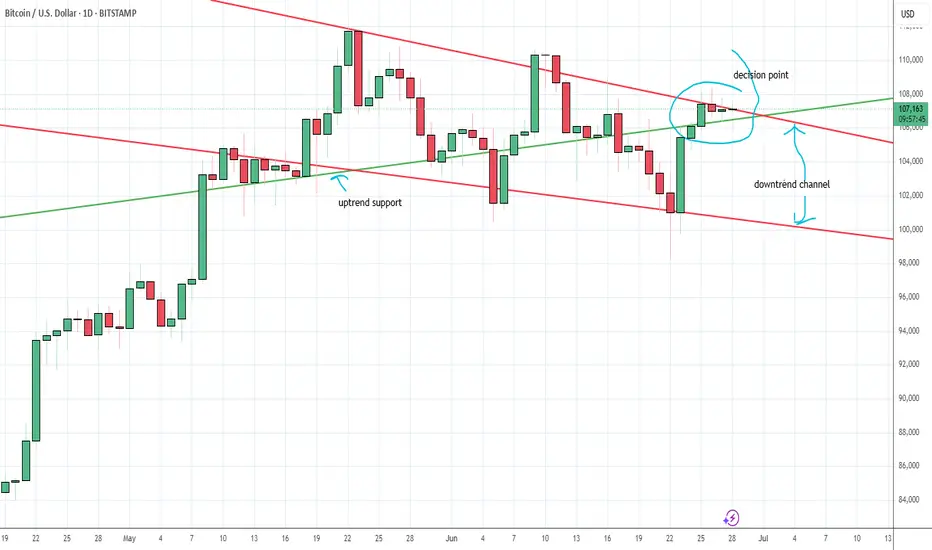
Playoff between down trend channel and up trend support in BTCThis is the situation Bitcoin finds itself in. On the one hand there is a strong downtrend channel which we keep getting thrown into, but on the other hand there is uptrend support that we also keep being bounced back into. We're currently in the confluence of both of these features, so shits about to get real.
Multiple confirmations on BTC sellsWe see BTC losing momentum on 4hr time frame. HL was just broken creating a LL, then we see price forming multiple bearish candles at poi. CTL is broken confirming this idea for potential entry!