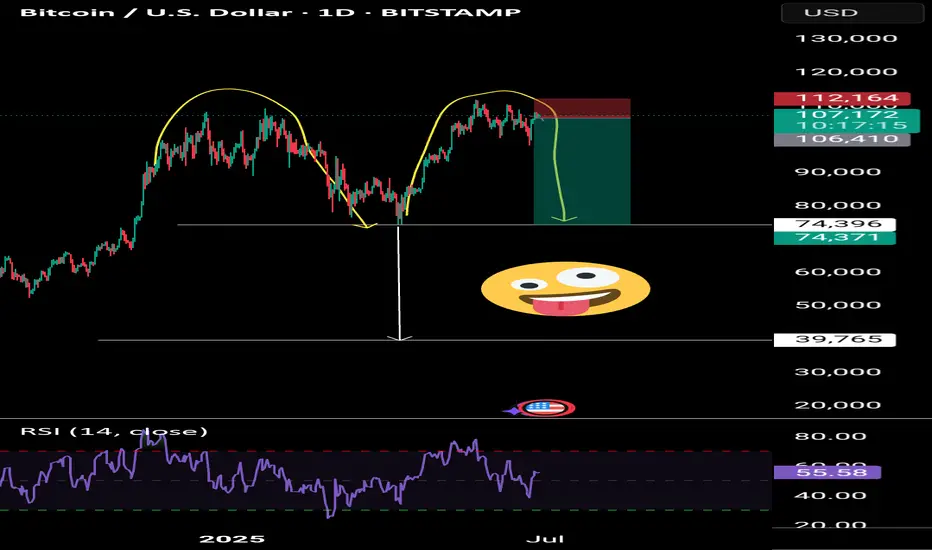
Bitcoin sell short bigFirst, we are waiting for confirmation of the twin ceiling. After the support of 72,000 is broken, we will move towards 39,000.
BITCOIN trade ideas
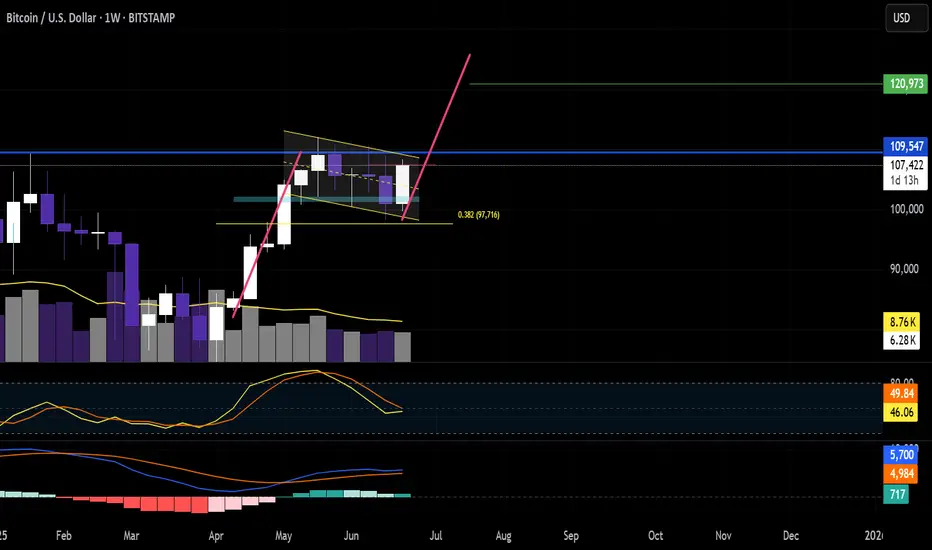
BTCUSD - Weekly Bullish Momentum Targeting $115K, Eyeing $137KI'm currently observing a strong bullish structure on the weekly timeframe for Bitcoin, trading at $107,305 at the time of writing. The current weekly candle shows aggressive buying pressure, and if this momentum sustains through the close, we could see a continuation toward the $115,200 level.
There’s visible liquidity and unfilled price action around $109,500, which I expect to be taken out as price moves upward. Once cleared, Bitcoin could either:
1. Continue straight to \$115K+, or
2. Briefly retrace before resuming the uptrend.
From a Fibonacci retracement perspective, BTC previously pulled back to the 38.2% level ~$76,000 before launching into the current leg up, a classic continuation signal within an uptrend.
Given the current price action and historical behavior, I’m targeting the following levels:
Short-term target: $115,200
Long-term target (multi-month): $137,200-$137,300
Stop loss and entry would depend on the timeframe of execution, but from a weekly structure, invalidation would occur if BTC breaks below the last major higher low around $98,000-$96,000.
Let’s see how this weekly candle closes. If the momentum holds, the next leg could already be unfolding.

Prediction for BitcoinThis is how I envision bitcoin moving based on current market events and the geopolitical situation.
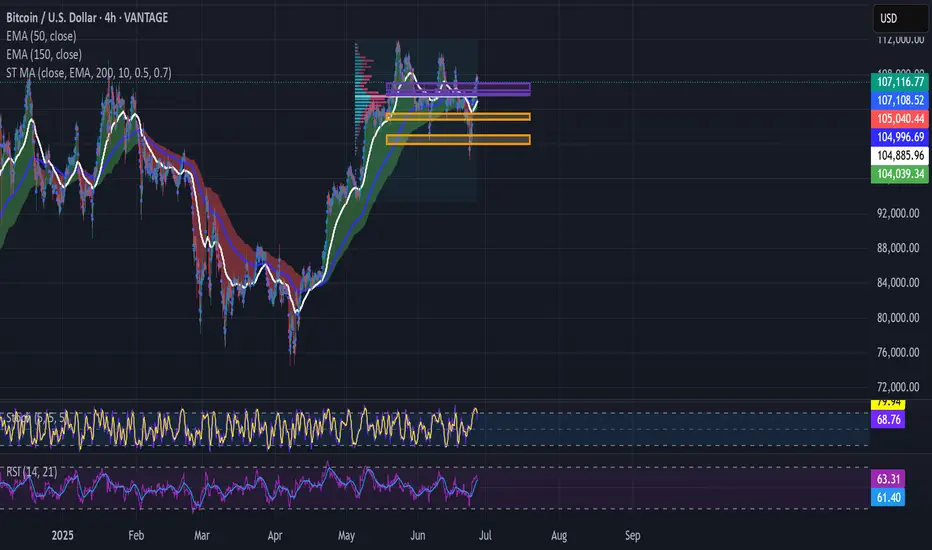
BRIEFING Week #26 : Are we going for a Bubble ?Here's your weekly update ! Brought to you each weekend with years of track-record history..
Don't forget to hit the like/follow button if you feel like this post deserves it ;)
That's the best way to support me and help pushing this content to other users.
Kindly,
Phil

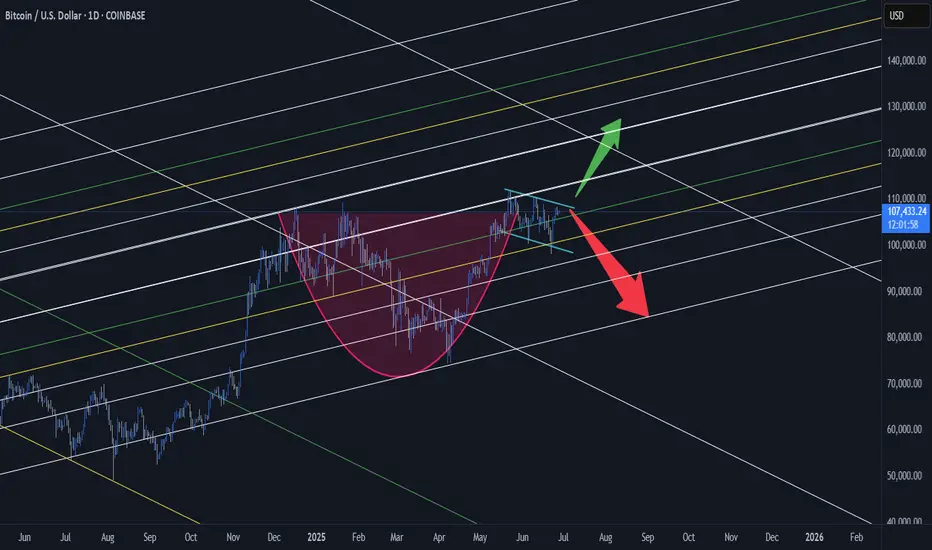
Has Bitcoin Topped? Trump’s SBR Impact | Deep Dive Analysis🚨 Has COINBASE:BTCUSD topped? Even with Trump's Bitcoin Strategic Reserve? 🚨
In this deep dive, we analyze COINBASE:BTCUSD major factors that could point to a major reversal or breakout and to uncover whether a market top is forming.
We’ll cover:
Powerful Indicators
Bitcoin / BTC Trends
Price Action
EMA / SMA Trends
Volume Delta
Trend reversal / breakout
Bullish / Bearish / Confirmation from Indicators
order flow analysis
Timeframes (1W, 1D, 1m, 6M etc.)
Bullish and Bearish Sentiment
Strength Candles
👉 Like, comment below, and follow for more pro-level crypto insights.
MartyBoots here , I have been trading for 17 years and sharing my thoughts on COINBASE:BTCUSD .
Whether you're a short-term trader or long-term investor, this post provides the technical insight and edge to help you make better informed decisions.
📉 Stay ahead of the market. Watch the full breakdown and view charts to decide for yourself: Has Bitcoin really topped?
Watch video for more details and below I will show some powerful charts with descriptions.
Warning in near term - LARGE ORDERS
Consolidation in price with large orders above
The Red lines = LARGE ORDERS
Large orders can act as an magnet to price
Large orders can also be support and resistance
Price Above the white 100 moving average
Price strong above it
Price weak below it
Strength Candles
Still Bullish
Multiple timeframes still green
Sentiment Tool Still Bullish
Still Bullish
Multiple timeframes and settings still green
3 Drive Structure
Equal Measured moves
Implies Top Is Not In
Target = $126k
Bullish Engulfing Candle
Implies higher prices to come
👉 Like, comment below, and follow for more pro-level crypto insights.
#Bitcoin #Trump #BTC #CryptoTrading #TechnicalAnalysis #CryptoMarket #BitcoinTop #TradingView #StrategicBitcoinReserve

#BTCUSD Buy 107248.20#BTCUSD Buy 107248.20
SL 106648.20
TP 107448.20
TP 108248.20
TP 109648.20
Trade at your own risk
Protect your capital
The Wizard 🧙♂️ SWFX
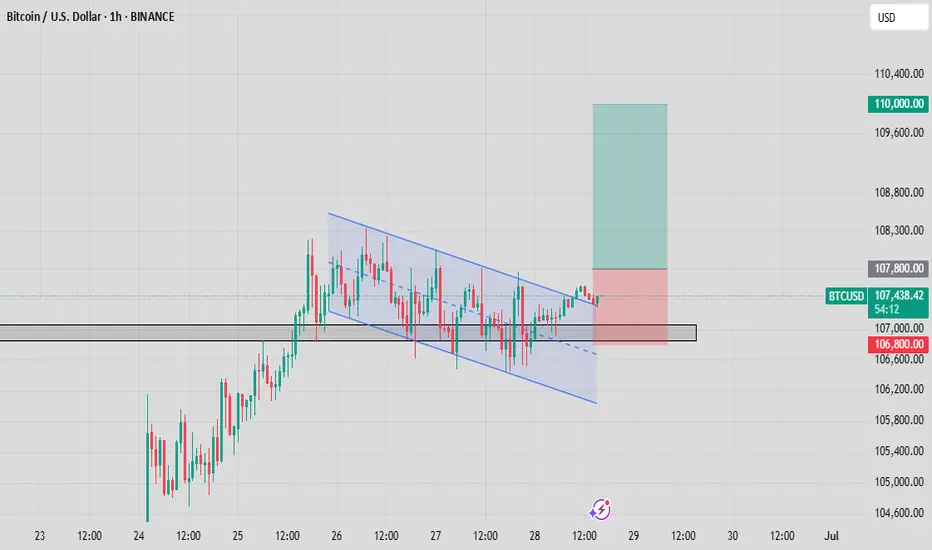
BTCUSD TRADE SETUP 📈 **Bitcoin (BTC/USD) 1H Chart Analysis — June 28, 2025**
🔍 **Pattern Identified: Bullish Flag Breakout**
🧠 **1. Market Context**
* This is the **1-hour chart** of **BTC/USD** on Binance.
* Price recently formed a **bullish flag pattern**, which is a **continuation pattern** signaling a potential breakout in the **direction of the previous trend (upward)**.
🔧 **2. Technical Breakdown**
🔹 **Trend Before the Flag**
* Price had a strong **impulsive move up** from \~105,000 to \~107,800.
* That was followed by a **consolidation phase** forming a downward sloping **channel** (blue parallel lines), creating the **flag**.
🔹 **Flag Channel**
* Price oscillated inside this flag for nearly 2 days (June 26–28).
* The **channel** is clearly defined, and price **respected both upper and lower bounds** during the consolidation.
🚀 **3. Breakout Confirmation**
* Price has now **broken out of the upper boundary** of the flag.
* A clean **break and candle close** above the trendline suggests **bullish momentum** is returning.
* This breakout is occurring around the **107,400–107,800** zone, which is also a **key structure level** acting as local resistance.
---
🎯 **4. Trade Setup**
✅ **Entry:**
* Around **107,400–107,800**, post-confirmation of the breakout.
❌ **Stop-Loss (SL):**
* Placed just below the **flag support / demand zone**, around **106,800**.
* This protects against a fake breakout or pullback into the flag.
🎯 **Target (TP):**
* Projected at **110,000**, which is aligned with the height of the initial flagpole projected from the breakout point.
* This also represents a psychological round number and a previous resistance level.
---
📊 **Risk-Reward Ratio (RRR)**
* **RRR = \~3:1**
* For every \$1 risked, the potential reward is \$3 — **excellent reward structure**.
---
📌 **Key Insights for the Traders**
* This is a **classic bullish flag breakout** play—very reliable in trending markets.
* **Volume confirmation** (not shown in chart but should be checked live) is important — higher volume during breakout gives stronger conviction.
* Watch for a possible **retest of the breakout level** (around 107,800) before the next move up.
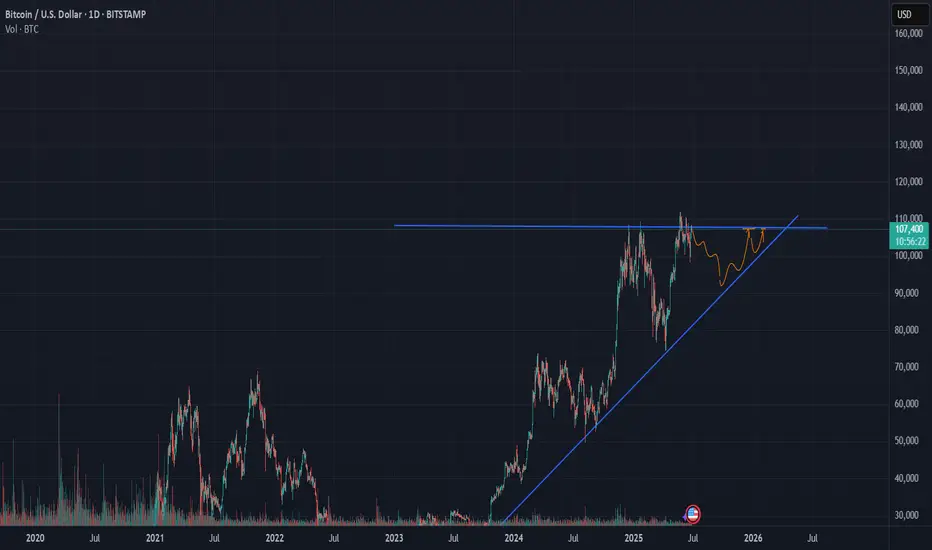
BTC 120k is on about to come.- BTC retest 0.3 fib and 13 ema W with perfection.
- Stoch W is about to cross.
- MACD W is about to push upward.
- No war fud.
- Big players keep buying BTC.
- Rate cut still on the table, just a matter of time.
- Tariff soon will be settled.
Possible august 120k ?
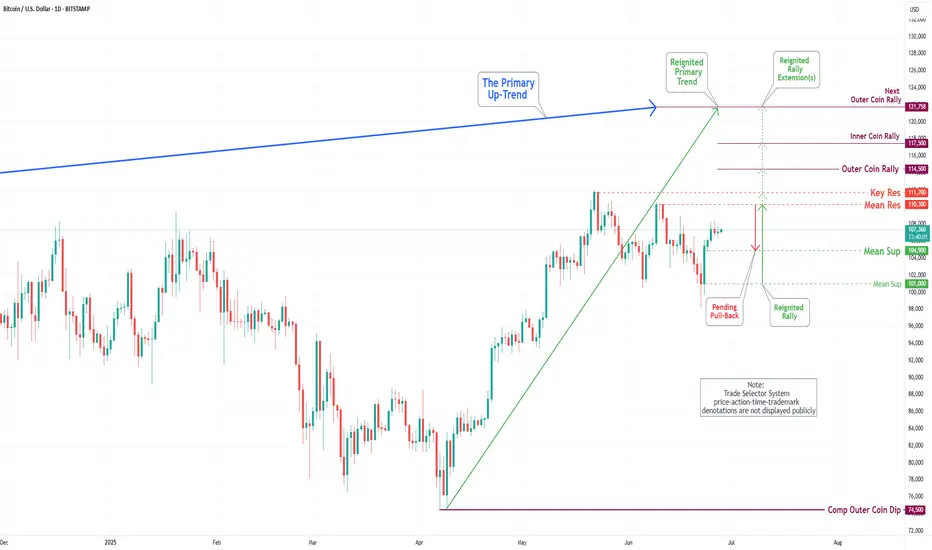
Bitcoin(BTC/USD) Daily Chart Analysis For Week of June 27, 2025Technical Analysis and Outlook:
Throughout this week’s trading session, Bitcoin has demonstrated an upward trajectory and is positioned to achieve the specified targets of Mean Resistance 110300 and Key Resistance 111700. This progression may ultimately culminate in the realization of the Outer Coin Rally 114500 and beyond. Nevertheless, it is crucial to recognize the possibility of a subsequent decline from the current price to the Mean Support level of 104900 before a definitive upward rebound.
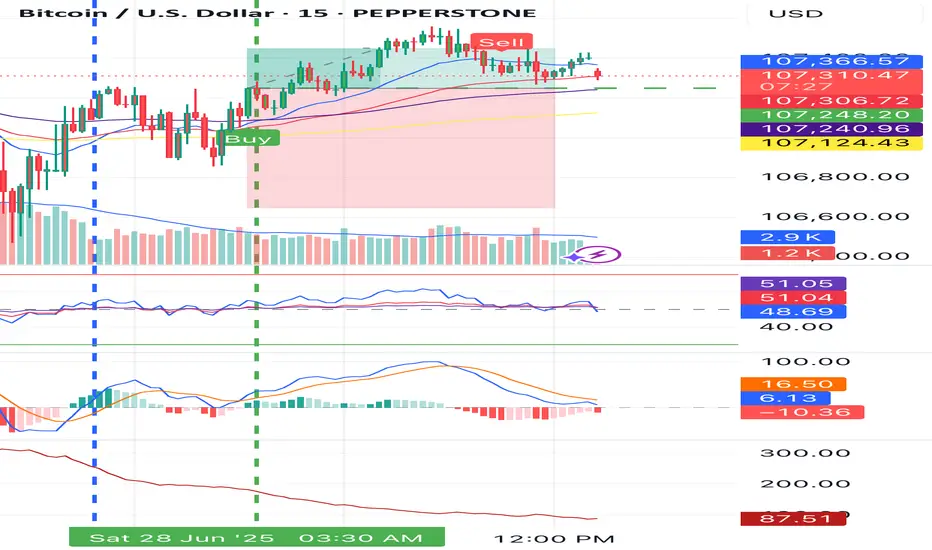
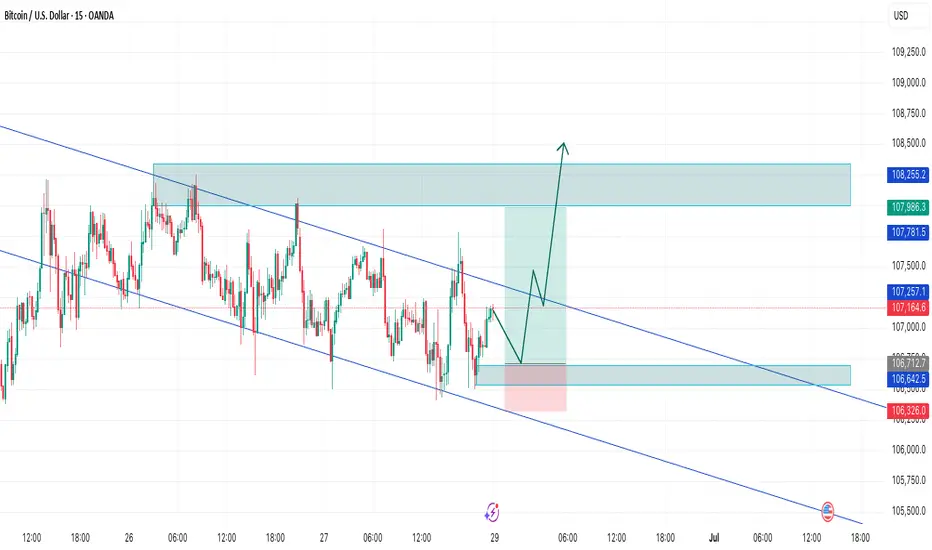
BTCUSD LONG BULLISH FLAG📊 BTCUSD Trade Setup – 15m Chart
🔔 Shared by RKZ FX SIGNAL
We're currently monitoring a bullish setup forming inside a descending channel. Price is showing signs of accumulation near the demand zone around 106,640 – 106,700, with a potential bullish break from the falling wedge structure.
🟢 Trade Idea (Potential Buy Setup):
Entry Zone: Around 106,650 – 106,700
Stop Loss: Below 106,326 (below liquidity & demand zone)
Take Profit: Targeting supply zone between 107,980 – 108,250
Risk to Reward Ratio: ~1:3
🧠 Analysis Notes:
Price has tapped into a fresh demand zone and shown a short-term bullish reaction.
Still inside the descending channel, but momentum is building for a breakout.
Confirmation will be stronger once price breaks the midline and retests the top boundary as support.
🔔 Wait for price action confirmation at entry zone before entering. Avoid early entries.
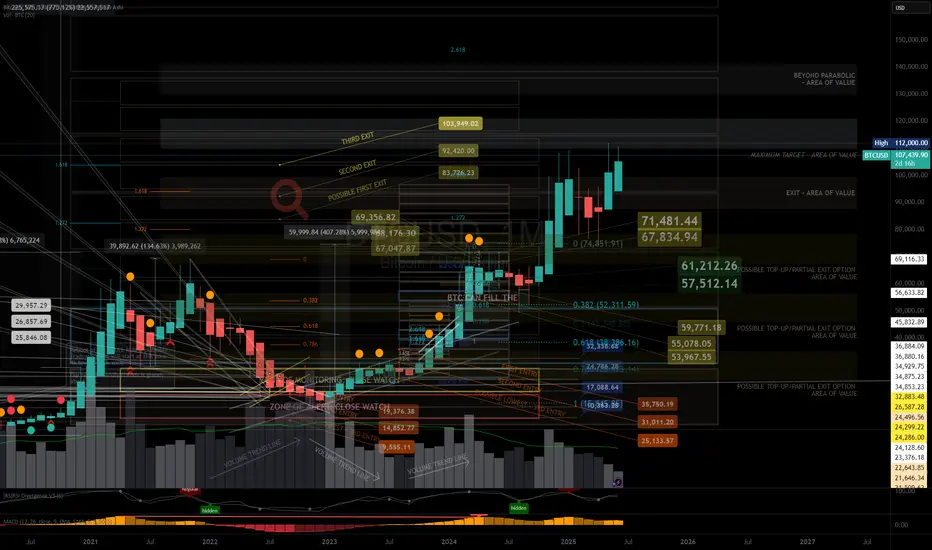
BTC Bento Box Analysis 6.28.25So far so good, I am back after 2 years of hibernation (been studying forex charts.) My analysis remains true to what BTC has done for the past 2 years. So much to learn in analyzing charts from crypto to forex to blue chips.
Again, we follow the tops and bottoms of the boxes. Minor and major boxes will suggest major and minor high and low reversals.
In a couple of weeks, i will study the charts and draw new Bento boxes for a year or two predictions as to where the most probable BTC ATH and ATL will take us to a new level.
Get ready to open buy/sell positions in the months to come.
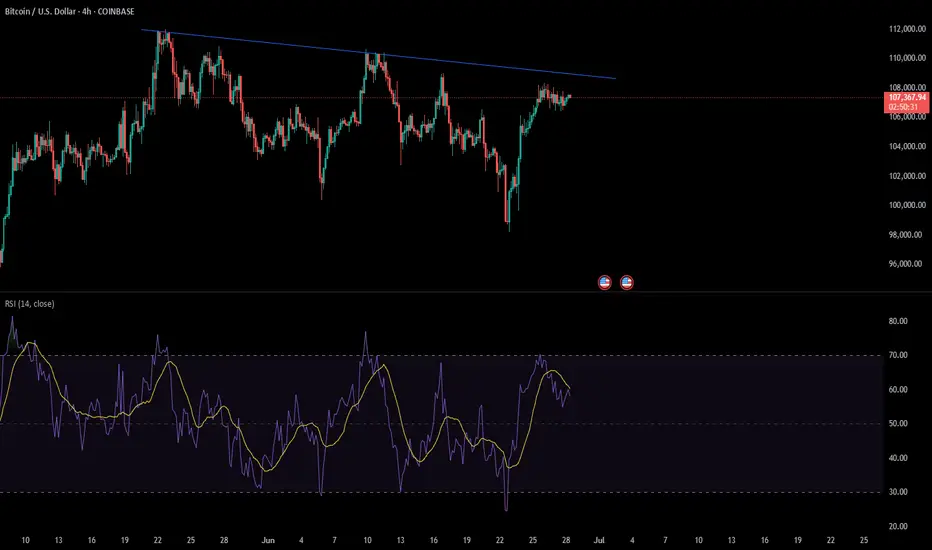
Bitcoin uptrend breakBitcoin uptrend break probably monday since nasdaq etc is at ath bitcoin follows and tops out in september
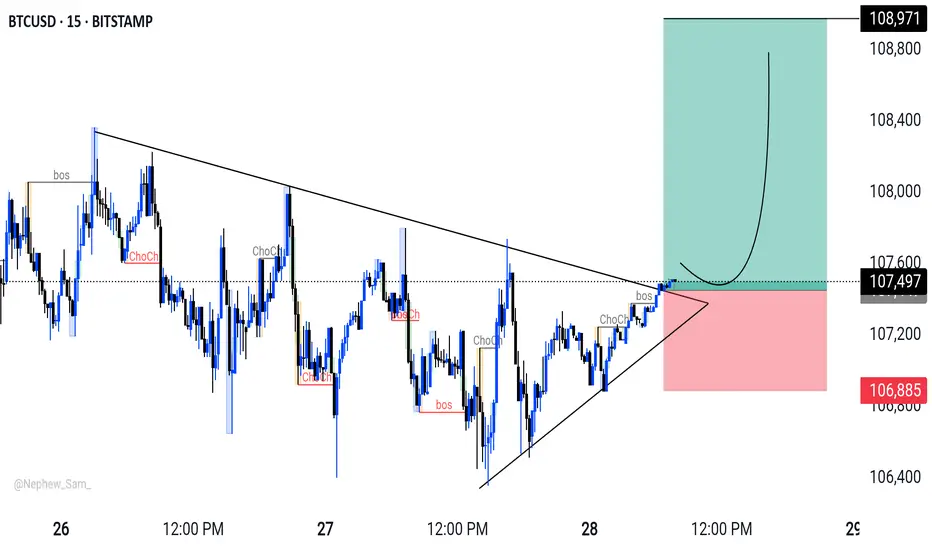
BTC/USD: Breakout Watch - short setup BTC/USD 15-min: Watching for a potential long opportunity. Price is pressing against a key descending trendline, with recent internal 'bos' and 'ChoCh' indicating a shift in momentum.
Plan:
* Entry: Targeting a retest around 107,509 after a confirmed trendline breakout.
* Target: 108,971
* Stop Loss: 106,885
Risk management is key! What are your thoughts?
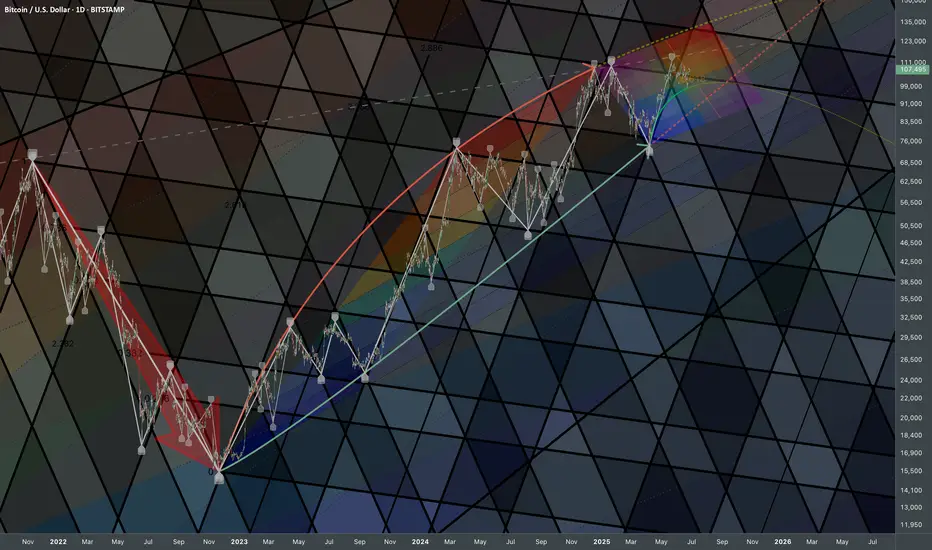
Bitcoin: Curve AdjustmentsBottoms can be expressed as a curve which matches logarithmic growth patterns. In the long-term perspective it serves as signal of trend's transition phase in broader scale. Coordinate of top adjusted accordingly.
Extending them is crucial because together they gives boundaries of range compression. Some sort of wave limits which help to clarify price-based levels.
Decoding the Dollar's Next MoveThe Dollar Index (DXY) currently stands at a critical crossroads, with its weekly close below 98.00 poised to dictate the trajectory of major asset classes for the coming weeks. The DXY closed as a bearish weekly candle at 97.2, confirming the "Bearish Dollar Scenario" as it closed below the 98.00 level. The market sentiment is currently cautious, awaiting clear directional cues from the DXY2. Our analysis will explore the Bearish Dollar Scenario, outlining potential price movements and actionable recommendations across a range of correlated assets

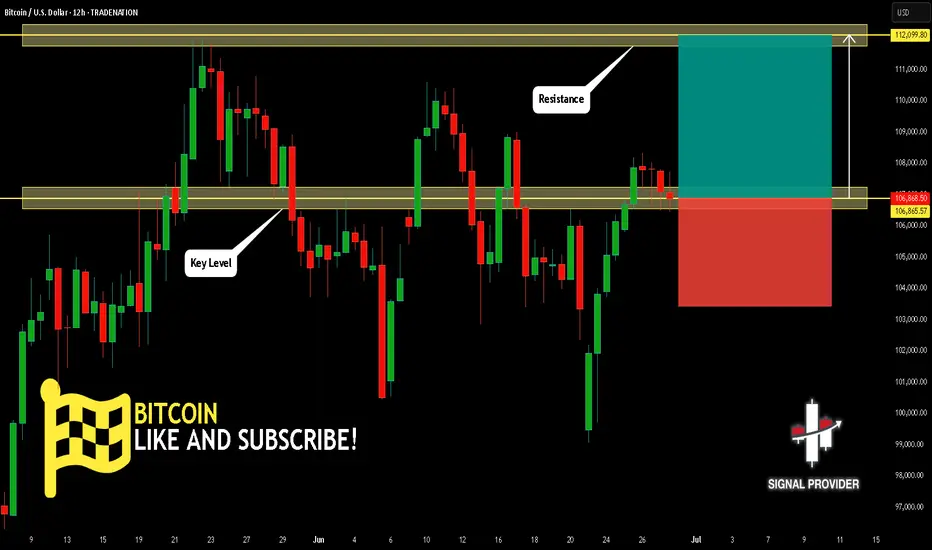
BITCOIN Is Bullish! Buy!
Here is our detailed technical review for BITCOIN.
Time Frame: 12h
Current Trend: Bullish
Sentiment: Oversold (based on 7-period RSI)
Forecast: Bullish
The market is approaching a significant support area 106,865.57.
The underlined horizontal cluster clearly indicates a highly probable bullish movement with target 112,099.80 level.
P.S
Overbought describes a period of time where there has been a significant and consistent upward move in price over a period of time without much pullback.
Disclosure: I am part of Trade Nation's Influencer program and receive a monthly fee for using their TradingView charts in my analysis.
Like and subscribe and comment my ideas if you enjoy them!
BTCUSD Buy Market Entry 107450-350 SL:106400BTCUSD
BUY By Market
Entry: 107500-107350
Sl: 106400
Tp1: 110000
Tp2: 116000
1% risk
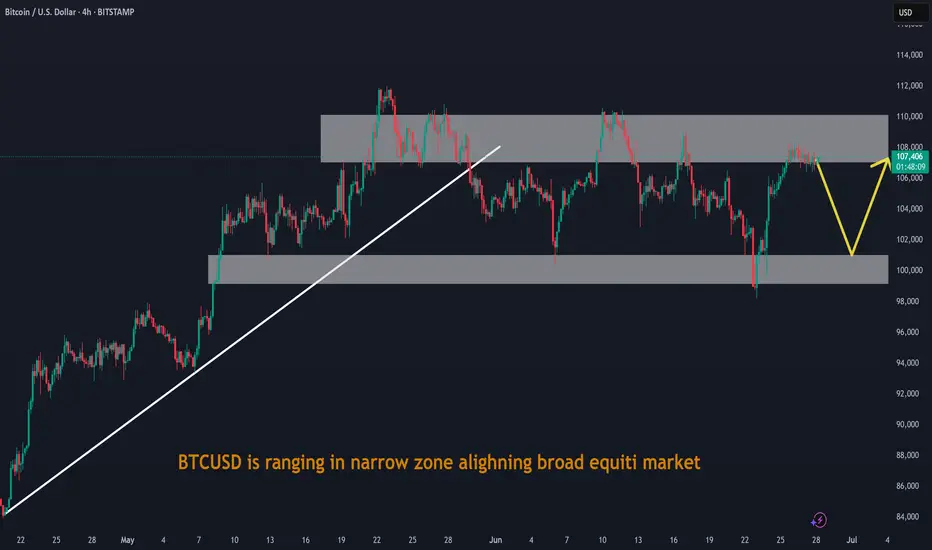
BTCUSD is ranging in narrow zone alighning broad equiti marketBTCUSD is ranging in narrow zone alighning broad equiti market
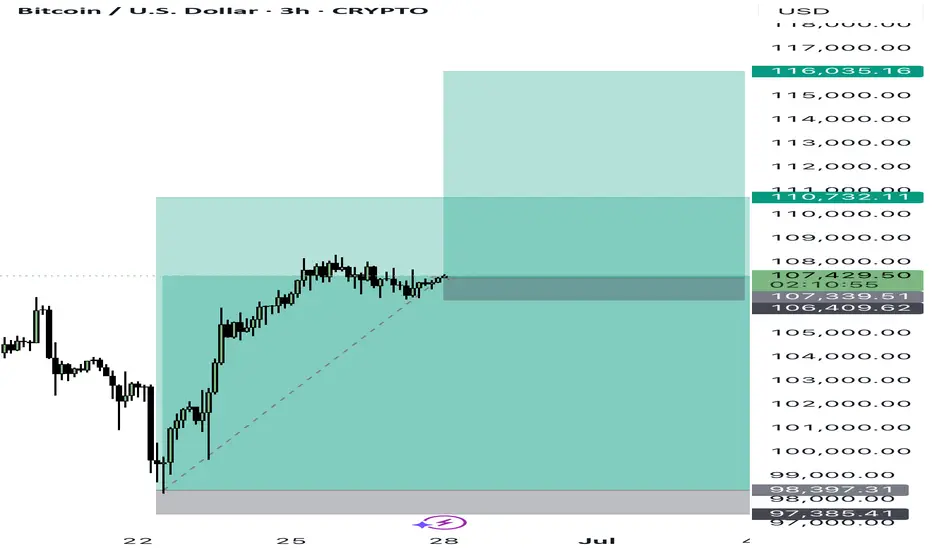
Bull-Flag within a Bull Flag means Exponential gains coming ???As of Friday, June 27, 2025, at 9:41:55 PM PDT, here's an analysis of Bitcoin:
Current Price & Performance:
Last Price: Approximately $107,280.10 (as of June 27, 2025)
Recent Performance: Bitcoin has been showing resilience above the $105,000 mark and has consolidated in a range between $100,000 and $110,000 recently, after hitting an unprecedented price of around $111,814 last month.
Bull Flag in a Bull Flag Pattern (Nested Bull Flags)
A "bull flag" is a bullish continuation pattern characterized by:
Flagpole: A sharp, strong upward price move.
Flag: A period of consolidation or slight retracement that forms a rectangular or parallelogram shape, typically with lower trading volume.
Breakout: A resumption of the uptrend with a strong move out of the flag, ideally on increased volume.
A "bull flag in a bull flag" (or nested bull flag) implies that a smaller bull flag is forming within a larger, ongoing bull flag pattern. This suggests a powerful, sustained uptrend where even the pauses for consolidation are themselves exhibiting bullish continuation characteristics.
Identifying this for Bitcoin:
To identify this pattern in Bitcoin, we would look for the following on a daily or higher timeframe chart:
1. The "Larger" Bull Flag:
Flagpole (Large): Bitcoin's overall parabolic run from its post-bear market lows to its recent all-time highs (e.g., $111,814). This multi-month or multi-year rally constitutes the significant "flagpole."
Flag (Large): The current consolidation phase Bitcoin is undergoing after reaching those all-time highs. This "flag" would be characterized by a broad trading range (e.g., between $100,000 and $110,000, or a wider range after its initial peak). This large flag would be a period of consolidation following the massive flagpole.
2. The "Smaller" Bull Flag (Nested within the larger one):
Flagpole (Small): Within this larger consolidation "flag," Bitcoin might experience shorter, sharper upward impulses. For example, if Bitcoin has a sudden 10% surge from $100,000 to $110,000 within the larger flag. This specific surge acts as the "flagpole" for the smaller flag.
Flag (Small): Following this smaller surge, Bitcoin then enters a mini-consolidation phase (a few days to a week or two), forming a tighter "flag" pattern within the broader trading range. This would be a slight downward or sideways channel on lower volume.
Breakout (Small): A breakout from this smaller flag would see Bitcoin push higher within the larger consolidation range, perhaps targeting the upper boundary of the larger flag (e.g., aiming for $110,000 or new highs).
Current Bitcoin State and the Pattern:
Based on recent market commentary and price action:
Overall Context: Bitcoin is in a long-term bull market, having recovered significantly from previous lows and testing all-time highs. This broad trend provides the context for large "flagpoles."
Larger Flag: Bitcoin's current consolidation around the $100,000-$110,000 zone, after its surge to $111,814, clearly fits the description of a large "flag" forming after a substantial "flagpole." This is a critical consolidation phase for the overall bull run.
Smaller Flag (Potentially Forming): Recent news mentions that Bitcoin surged over 10% since last Sunday (early June 2025) and has been consolidating between $100,000 and $110,000 for over three days. This description fits the start of a nested bull flag:
The 10% surge could be the smaller flagpole.
The consolidation for over three days within the $106,390 - $108,384 range after that surge could be the smaller flag formation.
If this smaller flag resolves to the upside, it would push Bitcoin towards the upper boundary of the larger flag ($110,000 to $112,000) or beyond.
Significance of a Nested Bull Flag:
Strong Underlying Momentum: The presence of a smaller bull flag within a larger one suggests exceptionally strong buying pressure and conviction among bulls. Even during periods of overall consolidation, traders are quick to accumulate on dips, leading to these smaller continuation patterns.
Layered Confirmation: It provides multiple layers of bullish signals. A breakout from the smaller flag reinforces the bullish bias within the larger flag, increasing the probability of an eventual breakout from the larger pattern.
Entry Opportunities: For traders, the smaller flags offer shorter-term entry opportunities within a larger trend, allowing them to capitalize on mini-surges as the broader consolidation unfolds.
Caution:
Confirmation is Key: Like all chart patterns, bull flags require confirmation. For the smaller flag, watch for a decisive breakout above its upper trendline on increasing volume. For the larger flag, the ultimate confirmation would be a sustained break above its all-time high resistance (around $112,000) on significant volume.
Volatility: Bitcoin is known for its volatility, and even continuation patterns can have false breakouts or deeper retracements than anticipated.
Volume: Volume confirmation is crucial. The "flag" portion should ideally show decreasing volume, while the "breakout" should be accompanied by a surge in volume.
In summary, Bitcoin appears to be currently in a large consolidation phase which could be interpreted as a significant "bull flag." Within this larger "flag," recent price action suggests the potential formation of a smaller, nested bull flag, where a recent mini-surge (small flagpole) is followed by a short consolidation (small flag). This indicates strong underlying bullish sentiment, with market participants potentially looking for a push towards the upper boundaries of the broader consolidation range.
This analysis is based on technical patterns and current market information. It is not financial advice. Always perform your own due diligence and consult with a financial professional before making investment decisions, especially in highly volatile assets like cryptocurrencies.
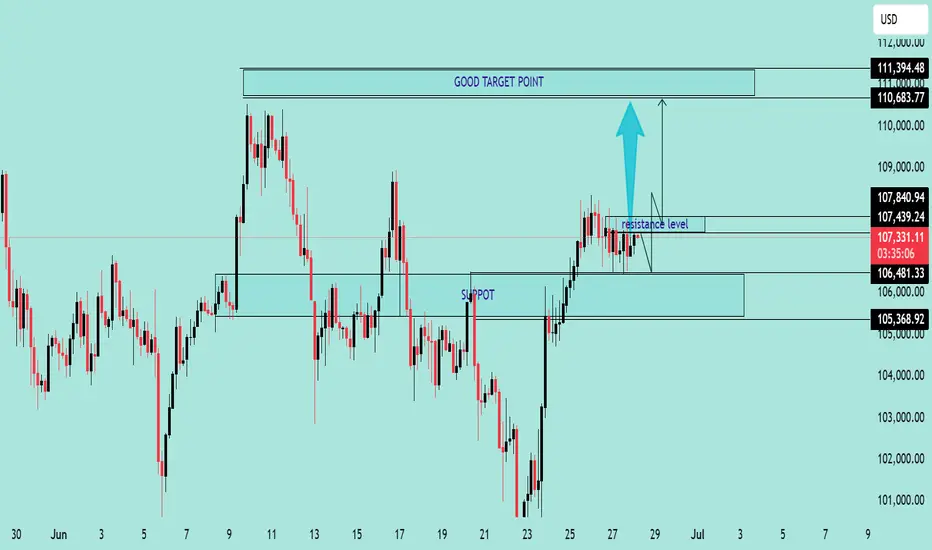
BTC/USD Consolidation Breakout Setup Chart Overview:
The BTC/USD chart shows a strong bullish impulse followed by a consolidation phase just below a key resistance level, suggesting a potential bullish continuation.
🔹 Key Technical Zones:
📍 Support Zone:
105,368 – 106,481 USD
This area acted as a strong demand zone where price reversed aggressively.
📍 Resistance Level:
107,439 – 107,840 USD
Price is currently consolidating just below this resistance, indicating a buildup for a breakout.
🎯 Target Zone:
110,683 – 111,394 USD
A clean breakout above resistance could push price into this target area.
🔹 Technical Signals:
✅ Bullish Flag Formation:
After a strong impulse move, BTC is forming a sideways range, indicating bullish accumulation.
⬆️ Breakout Potential:
A confirmed breakout and retest above 107,840 could validate a move toward the 111K region.
⚠️ Invalidation Point:
A drop below 106,481 would invalidate the bullish bias and may trigger a deeper pullback.
📌 Conclusion:
As long as BTC holds above the 106,481 support and breaks above the 107,840 resistance, bullish momentum is expected to continue toward the 111K zone. Traders should watch for a breakout confirmation and manage risk accordingly. 💹
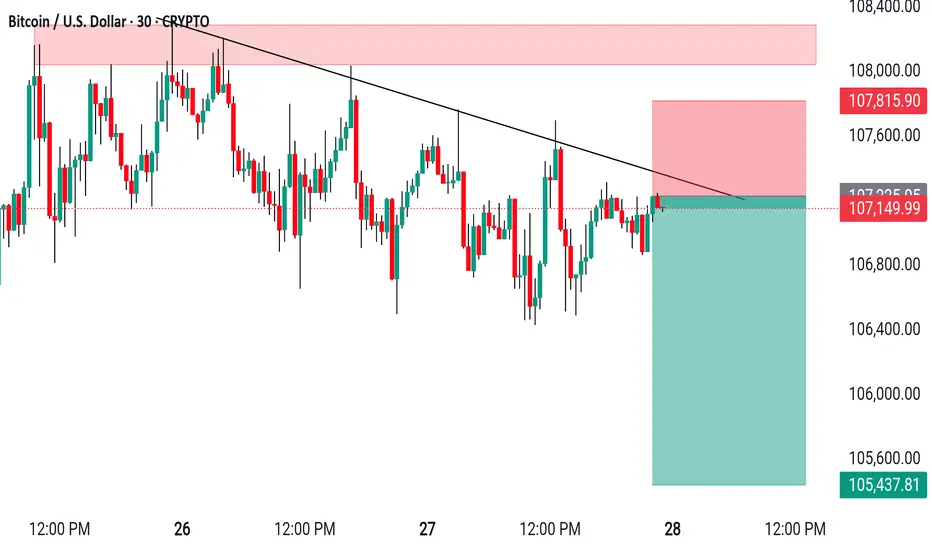
BTCUSD Short setup on the 30-min chart#BTCUSD Short setup on the 30-min chart.
Resistance holding strong.
> Entry: ~$107,140
> SL: $107,815
> TP: $105,437
> What are your thoughts? #Bitcoin #Crypto #TradingView