Bitcoin Structurally Momentum Bullish – On-Chain Confirmed.⊢
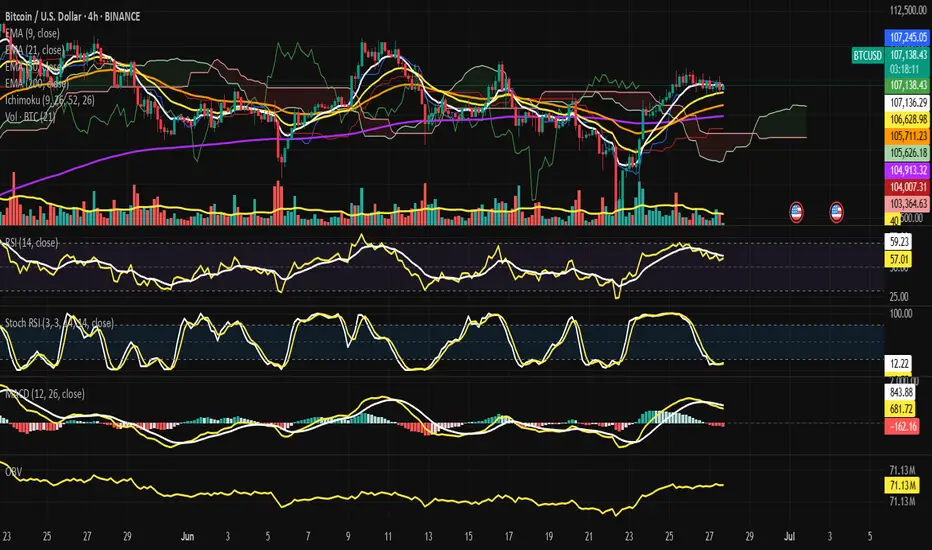
⟁ BTC/USD – BINANCE – (CHART: 4H) – (June 27, 2025).
⟐ Analysis Price: $106,840.15.
⊢
⨀ I. Temporal Axis – Strategic Interval – (4H):
▦ EMA(9) – ($107,126.95):
∴ Current price is slightly below the EMA(9), indicating the beginning of intraday buyer fatigue;
∴ EMA(9) still curves upward, sustaining the recent bullish momentum, but showing signs of deceleration.
✴️ Conclusion: Short-term strength is weakening; potential micro-shift in sentiment underway.
⊢
▦ EMA(21) – ($106,574.03):
∴ EMA(21) acts as immediate dynamic support, now closely tested;
∴ Still sloping upward, suggesting buyers are attempting to defend the structure.
✴️ Conclusion: Tactical support remains intact - this is the battlefield line.
⊢
▦ EMA(50) – ($105,651.25):
∴ Mid-range structure confirms trend stability as price remains well above the EMA(50);
∴ EMA(50) direction remains mildly bullish, reinforcing medium-term control by buyers.
✴️ Conclusion: Medium trend unshaken; pullbacks remain controlled within bullish context.
⊢
▦ EMA(200) – ($104,890.51):
∴ Long-term baseline remains untouched, with price notably above;
∴ The slope of EMA(200) is stable and slightly positive.
✴️ Conclusion: Structural bullish foundation remains intact. No long-term threat detected.
⊢
▦ Ichimoku Cloud (9/26/52/26):
∴ Price remains above the Kumo cloud; Tenkan and Kijun are aligned in bullish formation, though beginning to flatten;
∴ Chikou Span remains free and clear above historical price — no conflict.
✴️ Conclusion: Structure is still bullish, but compression in the cloud signals potential pause in directional conviction.
⊢
▦ Volume (BTC) + MA(21):
∴ Volume sits below its 21-period moving average, indicating waning buyer participation;
∴ No breakout or capitulation candle - sentiment is reserved.
✴️ Conclusion: Lack of conviction - volume confirms indecision and pause in impulse.
⊢
▦ RSI + EMA9 – (RSI: 54.78 / EMA9: 59.70):
∴ RSI curves downward from the upper-neutral zone - momentum is retreating;
∴ RSI has crossed below its EMA(9), which typically signals fading bullish strength.
✴️ Conclusion: Momentum has weakened - buyers are hesitating.
⊢
▦ Stoch RSI – (K: 9.72 / D: 10.22):
∴ Oscillator is deep in the oversold region, preparing a bullish cross;
∴ No confirmation of reversal yet - early signal.
✴️ Conclusion: Setup for potential rebound exists, but signal remains unconfirmed.
⊢
▦ MACD – (MACD: 725.17 / Signal: 883.72 / Histogram: –158.55):
∴ MACD histogram turns increasingly negative, suggesting decay in momentum;
∴ Though MACD line remains above signal, curvature favors a bearish crossover soon.
✴️ Conclusion: Momentum fading; risk of technical crossover if weakness persists.
⊢
▦ OBV – (71.13M):
∴ OBV is flat and shows no divergence, suggesting balanced pressure;
∴ Movement remains parallel to EMA21, confirming neutrality.
✴️ Conclusion: Volume flow is not supporting a continuation; neutral.
⊢
🜎 Strategic Insight – Technical Oracle:
∴The structure remains bullish at the macro and medium levels;
∴ As evidenced by EMA alignment and Ichimoku posture. However, momentum signals are fading, and the current 4H candle lacks conviction;
∴ A breakout requires stronger volume and RSI reacceleration - until then, the tactical stance is suspended.
⊢
∫ II. On-Chain Intelligence – (CryptoQuant):
▦ 1. Exchange Netflow Total – (All Exchanges):
∴ Current readings show net outflows dominating, indicating coins moving out of exchanges - typically interpreted as holding behavior and bullish bias;
∴ No recent spike in inflows that would suggest imminent selling pressure or dump risk.
✴️ Conclusion: Exchange behavior is structurally bullish - environment favors accumulation.
⊢
▦ 2. Exchange Stablecoins Ratio – (All Exchanges):
∴ The ratio remains low and stable, meaning high stablecoin reserves vs. Bitcoin on exchanges - suggesting potential buying power in standby;
∴ No spike in the ratio - no immediate conversion from stablecoins into Bitcoin.
✴️ Conclusion: Stablecoins on standby confirm latent demand - supportive for bullish continuity if triggered.
⊢
▦ 3. Funding Rates – (All Exchanges):
∴ Funding is positive but mild, indicating long interest, yet not overheated;
∴ No excessive leverage detected - absence of speculative imbalance.
✴️ Conclusion: Derivatives market supports a healthy uptrend with no signs of crowd euphoria.
⊢
▦ 4. Estimated Leverage Ratio – (All Exchanges):
∴ Leverage ratio remains within neutral bounds, not expanding aggressively;
∴ Suggests market is currently not dominated by overleveraged positions.
✴️ Conclusion: The structure is stable - no systemic risk from forced liquidations.
⊢
▦ 5. Taker Buy/Sell Ratio – (All Exchanges):
∴ The ratio is slightly above 1.0 - meaning more aggressive buying than selling, but without dominance;
∴ Reinforces sentiment of cautious buying, not yet euphoric.
✴️ Conclusion: Taker flow confirms moderate bullish sentiment, no reversal pressure.
⊢
🜎 Strategic Insight – On-Chain Oracle:
∴ On-chain metrics align with structural bullishness;
∴ Netflows, leverage, and taker activity all support continuation;
∴ Importantly, stablecoin ratios signal dry powder remains available, meaning the market holds the potential energy for further upside - if volume and technical confirmation align.
⊢
⧈ Codicillus Silentii Strategic Note:
∴ In the discipline of silence, one waits as price tests its dynamic zone. The wise act after structure, not inside uncertainty;
∴ The chain speaks in whispers. Smart liquidity waits. The structure is armed - but momentum requires ignition. Not fear, not hope - signal.
⊢
𓂀 Stoic-Structural Interpretation:
∴ Structurally Bullish - (Tactically Suspended);
∴ The core architecture remains intact, but the absence of volume and declining oscillators justify a suspended stance for entry;
∴ On-chain and chart-based structures are aligned in bullish posture, but technical indicators remain in a suspended tactical phase. Awaiting breakout or deeper pullback for positioning.
⊢
▦ Tactical Range Caution:
∴ Watch $106,574 (EMA21) and $105,651 (EMA50) for reactive buying;
∴ Below $104,890 (EMA200) - structure weakens;
∴ Upside breakout requires volume reclaim above $107,330;
∴ Resistance: $107,330 / $108,200.
⊢
⧉
⚜️ Magister Arcanvm (𝟙⟠) – Vox Primordialis!
𓂀 Wisdom begins in silence. Precision unfolds in strategy.
⧉
⊢
BITCOIN trade ideas
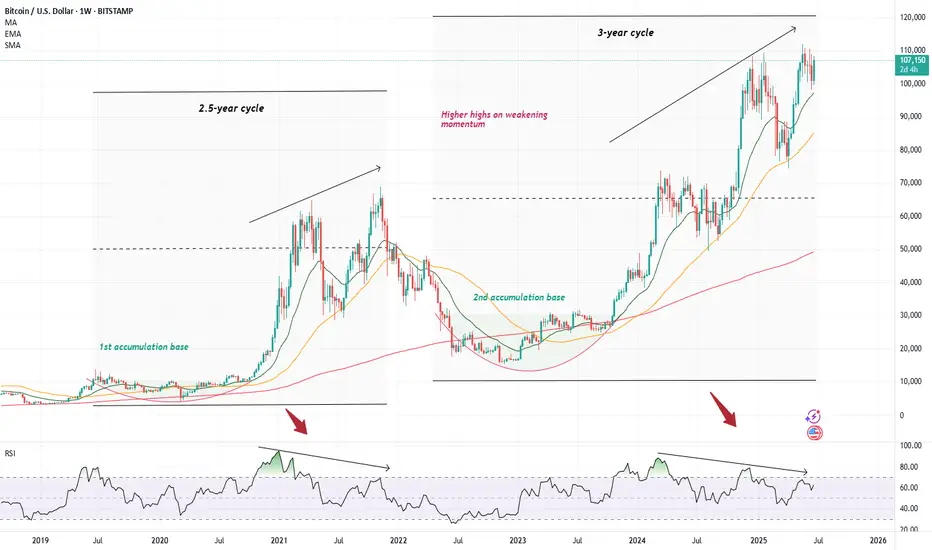
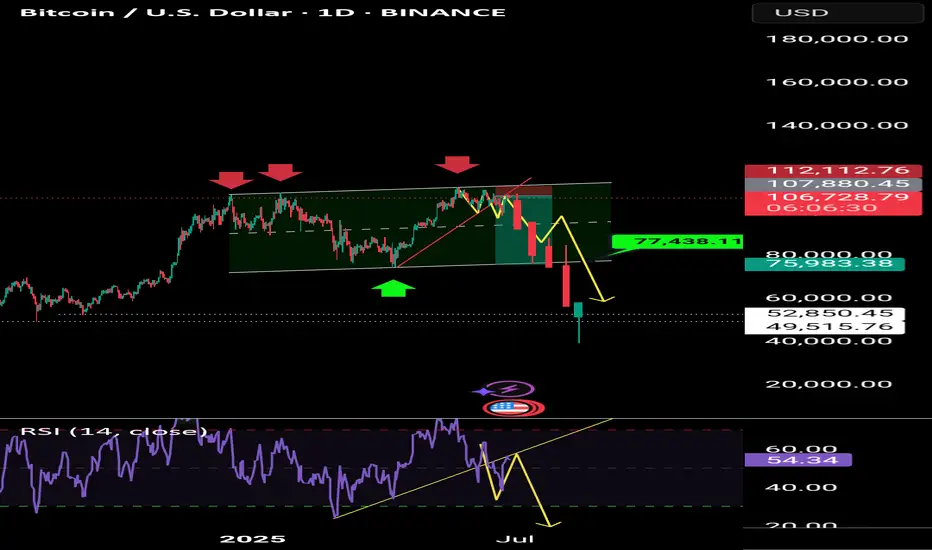
Cautionary tale on BitcoinI decided to temporarily depart from my usual trade ideas to wave a cautionary finger at the chart of Bitcoin, where I have noticed a rather worrying pattern within the weekly charts. However, before I delve in, I would like to stress that I am a very rigid believer in the long-term prospect of our monetary saviour and what I am supposed to write about only concerns the usual, inevitable cyclicality that always entails the otherwise upward-sloping trajectory of Bitcoin ( CRYPTO:BTCUSD )
Although overall this has not felt like much of a crypto bull run given the apparently absent performance of altcoins (apart from an occasional 1000x on a well-targeted memecoin), Bitcoin has, in the meantime, trod its usual path upwards. Since the '22 lows, it has mimicked its regular pattern where after a devastating plummet lower, it has spent several long months accumulating until it has burst out of its cocoon to provide a 6x return to its strong believer. However, the mimicking is almost too good as we have now started painting a very similar picture to what eventually transpired to be the '21 top. We have reached a strong above >100k top only to hit a vicious correction (announcement of tariffs), similar to what Bitcoin did in May of 2021 (China crackdown, tech selloff). The price then quickly consolidated - which I am not an avid fan of as a formation of a more robust base would be more preferable (though would take longer ) - and bitcoin shot back up again, quickly reclaiming the previous highs; just like it did in October/November 2021. This creates an unfortunate setup best represented by the series of lower highs on an RS I while the price keep climbing higher - creating the probably best-know bearish signal with higher highs built on weaker and less robust momentum.
We know how this ended in 2021, and I am not suggesting that Microstrategy should blow up, go bankrupt and sell all its bitcoin (though definitely a possibility) - however, one must admit that there are currently quite a lot of uncertainties that could unwind at any time (one such coming on July 8th with the second version of the lets-blow-up-the-stock-market day). With a stock market priced to perfection, and with what seems like a large pile of uncertainties hovering in the air, it seems like any one of these could light up the fire underneath these lovely valuations we have reached, and although I would love for cryptocurrency prices to be completely independent of the stock market, we usually know how this goes.
So, what to do about this? Preferably nothing . If you are as much of a believer as I am in the necessity of bitcoin in today's financial world, this is just another blip in an otherwise long and profitable ride. So, I won't be any selling any of it - hopefully only adding once we decline. I would also add that I am not expecting as much of a bloodbath as last time. I think Bitcoin has reached a point where the 80-90% declines become very rare. However, regarding my other allocations in crypto assets, I am not as optimistic, hence I decided to sell most of everything else. Although I love the premise of Ethereum, the chart looks pretty horrific, currently drawing a perfect head-and-shoulder on a 4h chart (which I might write about as well as a short idea).
I will end this essay the same way I started it - I know absolutely nothing, and maybe I will come back at the end of the summer, beautifully tanned and relaxed as we all are in Europe, and find everything at all-time highs. I just currently believe the risk-reward ratio is not skewed in my favour, and I don't know how about you, but I tend to listen to my probability gods, especially on the eve of another strong SPAC year .
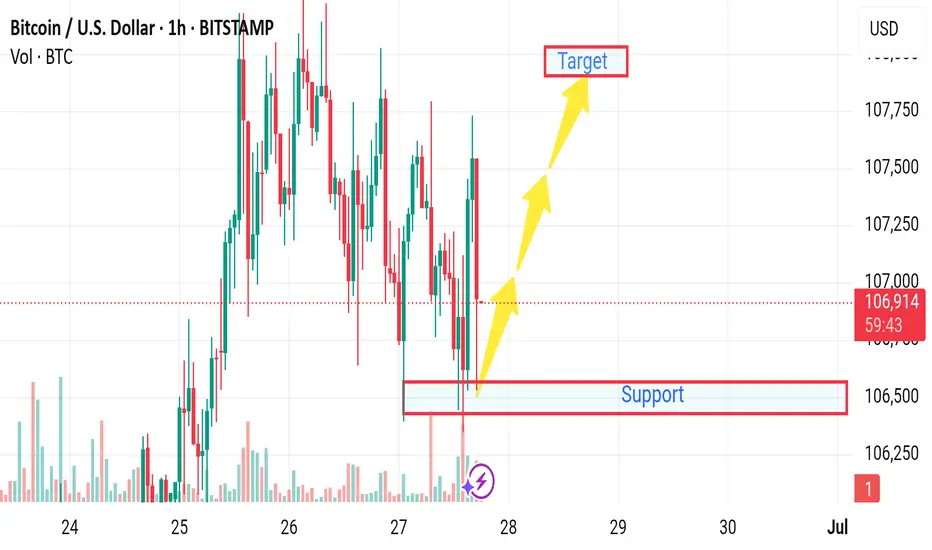
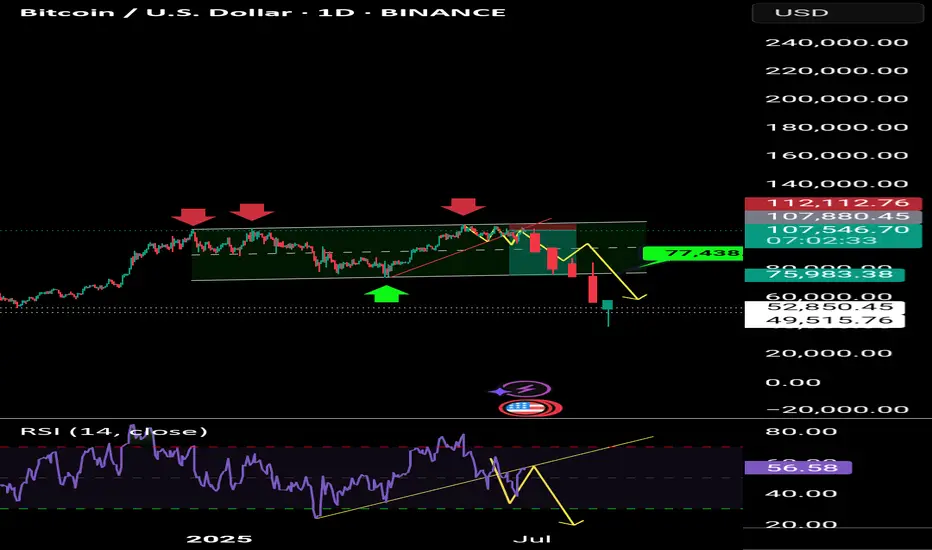
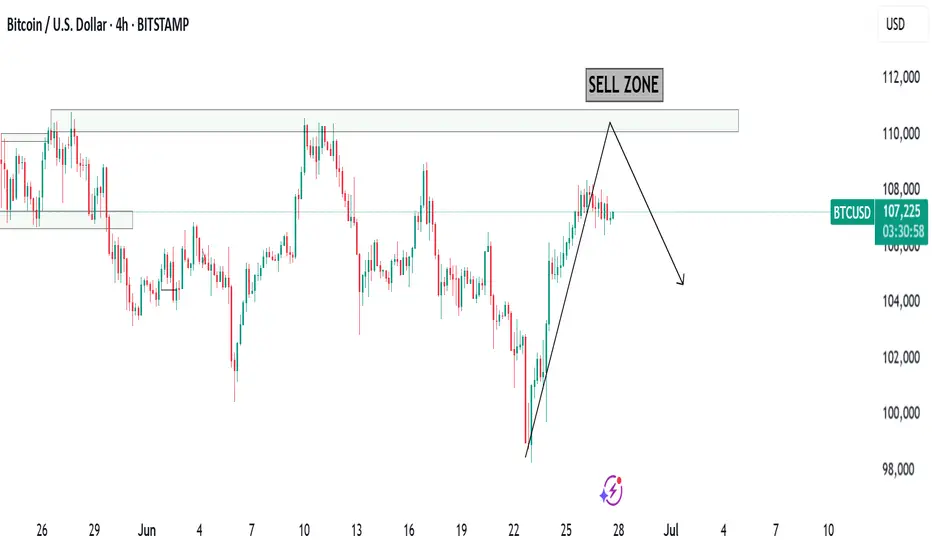
Market next target ⚠️ Disruption & Analytical Weaknesses:
1. Support Zone Already Broken (Wick Penetration):
The candlestick wick clearly pierced the support level drawn on the chart.
This indicates that buyers are weak at that level — the support is not holding firmly.
Relying on this support for a bullish bias is risky, as it may soon turn into resistance.
2. Volume Confirms Weakness, Not Strength:
The bounce from the support zone happens on low or declining volume, suggesting lack of strong buying interest.
A legitimate bullish reversal should be backed by a volume surge — here, that’s absent.
3. False Sense of Recovery:
The analysis shows arrows projecting straight up to the “Target” level, implying a smooth bullish recovery.
This is unrealistic given the recent choppy price action and repeated failures to hold gains above 107,200.
Price action suggests uncertainty or distribution, not clean bullish momentum.
4. Tight Range and High Volatility Ignored:
Price has been ranging between ~106,400 and ~107,600 with rapid whipsaws.
This kind of structure is often indicative of indecision, and setting a clear directional target without breakout confirmation is premature
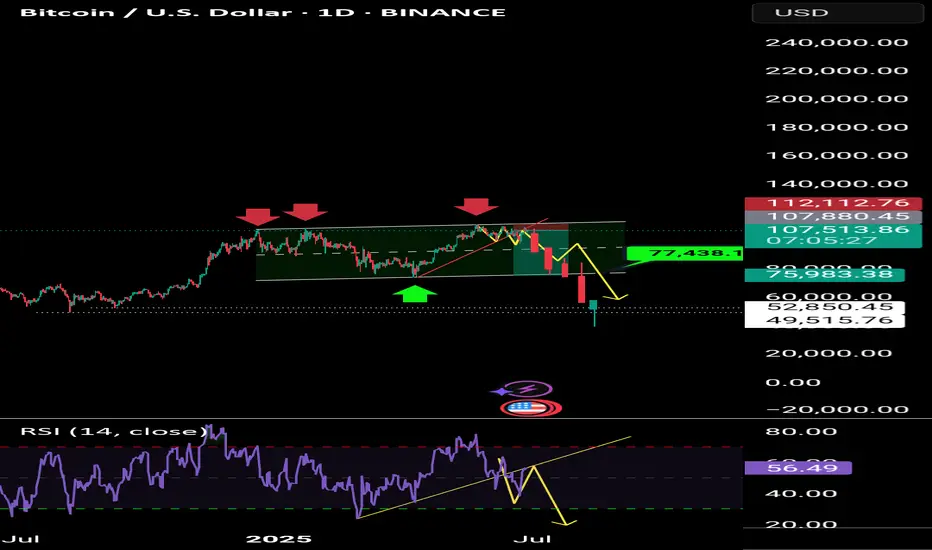
Only all market sellllll This market is just liquidating and scares you into shorting, and suddenly it drops terribly, so if you have a short trade, hold until the first target is 75,000 and the second target is 39,000.😜😜😜😜😜
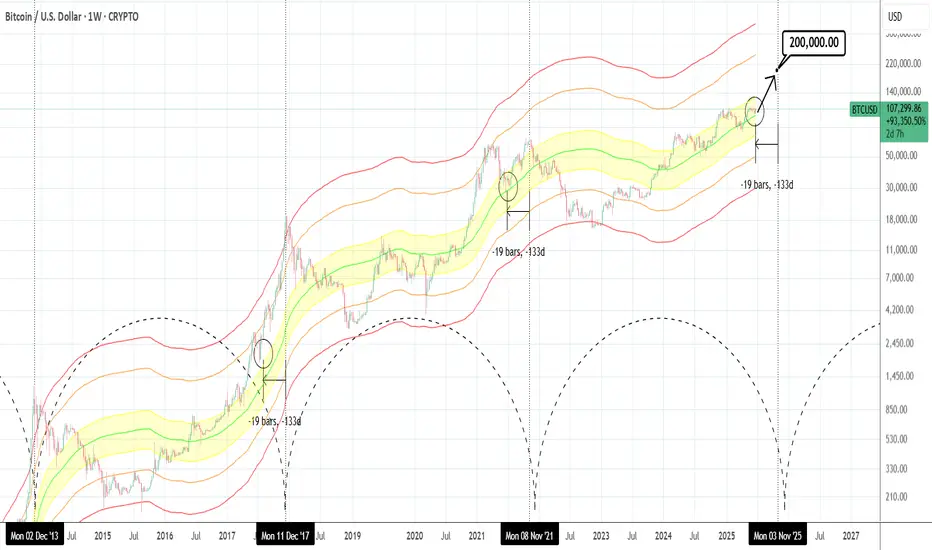
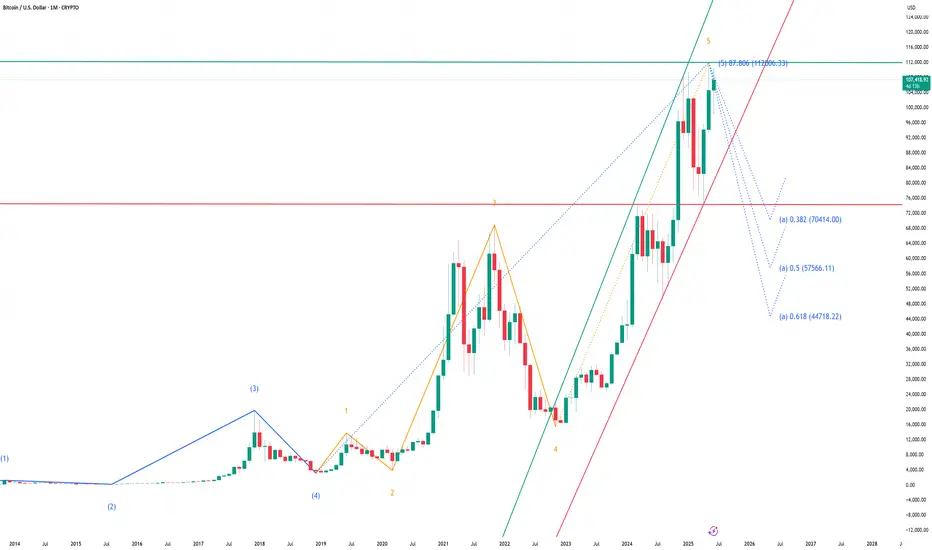
BTCUSD: Hasn't gone parabolic yet.Bitcoin is just now re-entering the bullish state on its 1D technical outlook (RSI = 55.820, MACD = 291.960, ADX = 15.180), being correcting/consolidating in the past 30 days. According to the Mayer Multiple Bands, it's stil inside the range (upper band) of the 1 Stdev Below-Mean-1 Stdev Above (yellow range). This suggest significant upside potential as being roughly 19 weeks before the Cycle tops, it matches the late June 2021 bottom inside that zone as well as the July 2017 bottom just over the top of that zone. The orange trendline has been the minimum target on every Cycle but looks unlikely to hit it by the end of the year. If however it goes parabolic as all Cycles had at this stage, $200,000 isn't at all far fetched before the Cycle tops.
## If you like our free content follow our profile to get more daily ideas. ##
## Comments and likes are greatly appreciated. ##
Bitcoin sell short This market is just liquidating and scares you into shorting, and suddenly it drops terribly, so if you have a short trade, hold until the first target is 75,000 and the second target is 39,000.
Bitcoin ready for big sell This market is just liquidating and scares you into shorting, and suddenly it drops terribly, so if you have a short trade, hold until the first target is 75,000 and the second target is 39,000.
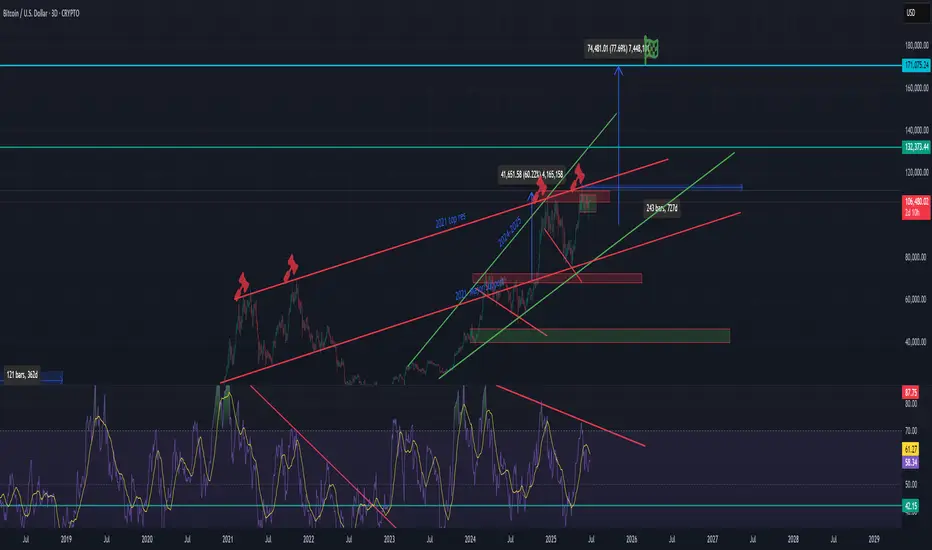
BTC Breakout or dropBitcoin has been trading in a range from 97.5K-112K for some time we tested 97K weekend and we bounce over 10% but we fail to make a ATH, also Bitcoin has strong bearish divergences that hardly anyone pays key attention to and these are almost identical to 2021 cycle top.
I have draw the resistance line and support from 2021 my theory is that IF we invalidate the bearish divergences we can see price action between 145K + . I do not think we can see a 320K price per bitcoin this cycle this will maybe happen in 2028 or 2032 cycle. Now if we do not breakout and invalidate the bearish divergences we can see the price dropping back to test the major 2021 support which is around 78K-84K only when this support if broken and we close a full body weekly candle below it then this confirms bear market has started.
Price action has move almost 8X from the 2022 ATL which is a decent return if you bought and hold.
If you enjoy the TA feel free to join my network its absolutely FREE.
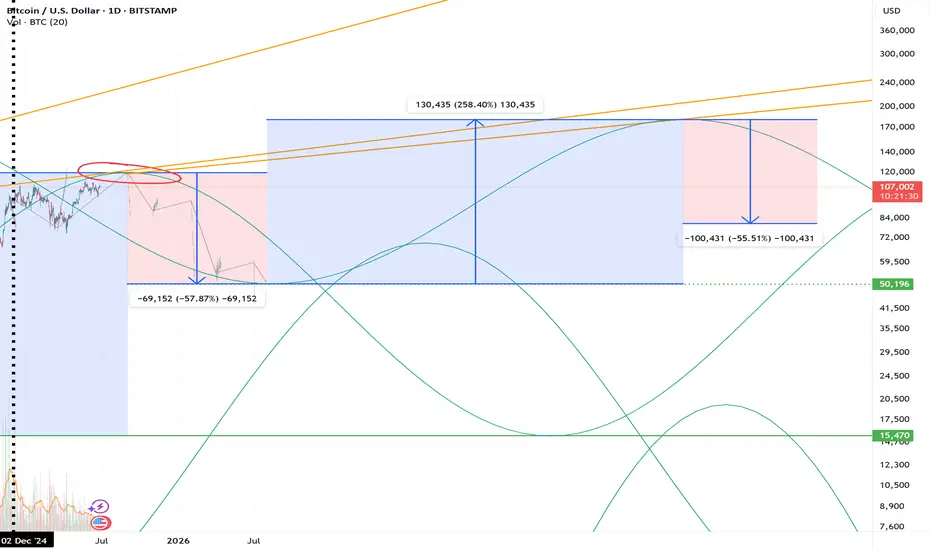
Future idea: Bitcoin Valuation in 2030I've been thinking about how this and previous cycles seems to follow some general trends and my previous prediction is seemingly playing out pretty well. I'm hoping to look back in 5 years and be right.
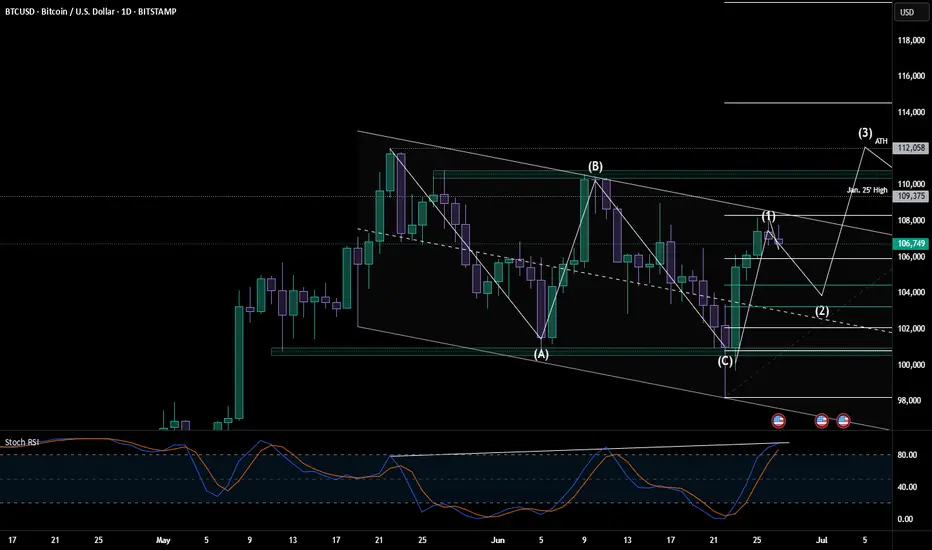
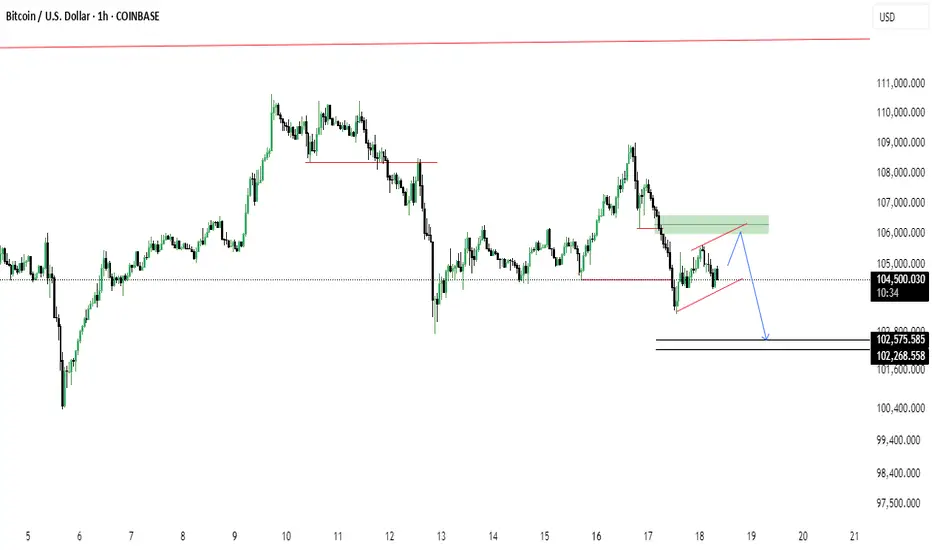
BTC Looking for a Wave 2 Reset Before the Real MoveBITSTAMP:BTCUSD looks like it just wrapped a clean ABC correction and kicked off a fresh 5-wave impulse. We’ve probably topped out on wave 1 heading into the weekend, Stoch RSI is flashing overbought, price is hitting resistance just under 108.3K, and we’re also seeing some bullish divergence creeping in.
I’m expecting a pullback from here, ideally into that 0.5–0.618 retrace zone (103.2K–104.4K). That would line up well with the mid-channel and EMA support. From there, we could be set up for a proper wave 3 breakout (as long as we don't get any more surprise tariffs or wars).
Fed still leaning dovish into Q4, even with some Q3 inflation and tariff noise. Rate cut odds ramp into Sept/Dec, so bigger picture looks constructive. In my eyes, the longer the FED holds off on these cuts, the longer this cycle extends.
Key zones I’m watching:
Support: 105.3K > 103.2K > 100.8K
Resistance: 108.3K > 112K > 114.5K+
If we dip and hold structure, I’ll be watching for confirmation to load into wave 3.
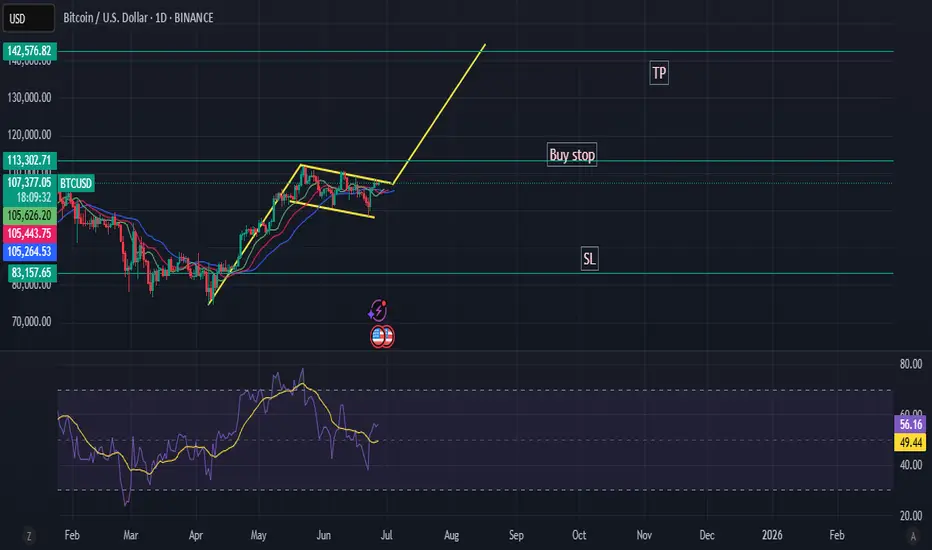
$BTC – Three Possible Scenarios in the Near FutureCRYPTOCAP:BTC – Three Possible Scenarios in the Near Future:
🔹 Optimistic: Growth up to $140,000
🔹 Conservative: Growth up to $112,000
🔹 Pessimistic: Decline to $75,000 – $85,000
🚨 Key Levels to Watch:
▪️ $112,000 — a breakout above this level could open the path to $135,000 – $145,000
▪️ $100,000 – $103,000 — if BTC drops into this zone, it could trigger a decline toward $85,000 – $95,000
▪️ $83,000 — falling to this level may indicate further downside to $30,000 – $50,000
Trading balanceTrading balance The price of the asset has rebounded from the balance zone. With the prospect of growth into the resistance zone.
BTC LONG TP:108,600 26-06-2025Looks like a classic fakeout before a big move 💥
Entry between 105,800 – 106,450, targeting 108,400 – 108,900, with an average 3.5 RR.
🕐 Timeframe: 1H
⏳ Duration: Fast move
Context: Expecting a quick manipulation before an expansion toward 108,500 – 109,500. The only problem? The stop. Manage it based on your own strategy — this one’s spicy.
If the move doesn’t happen within the expected time, the setup is invalid.
We don’t use indicators, we’re not out here drawing lines or cute little shapes — I just give you a clean trade.
BTCUSDTPrice action trading is a methodology in financial markets where traders make decisions based on the actual price movements of an asset over time, rather than relying heavily on technical indicators or fundamental analysis. It involves observing and interpreting patterns and trends in price charts to predict future price movements.
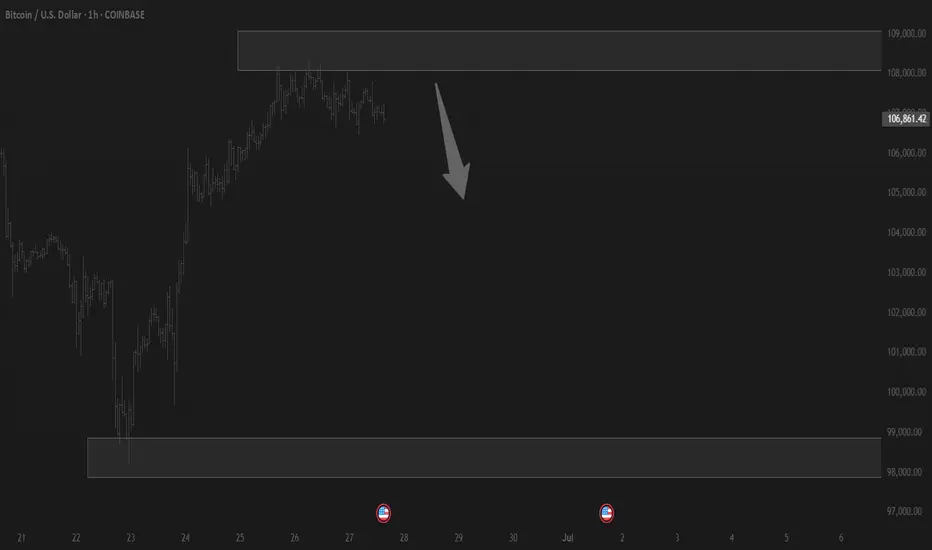
BTC/USD Rising Wedge Breakdown Ahead?Bitcoin shows signs of a potential bearish reversal as price forms a rising wedge beneath a key supply zone. After a recent drop, price is retesting the 106k area (green zone), possibly setting up for continuation to the downside.
🔹 Rising wedge pattern near resistance
🔹 Bearish retest at previous support turned resistance
🔹 Potential drop targets: 102,575 and 102,268
🔹 Break below wedge support could accelerate the fall
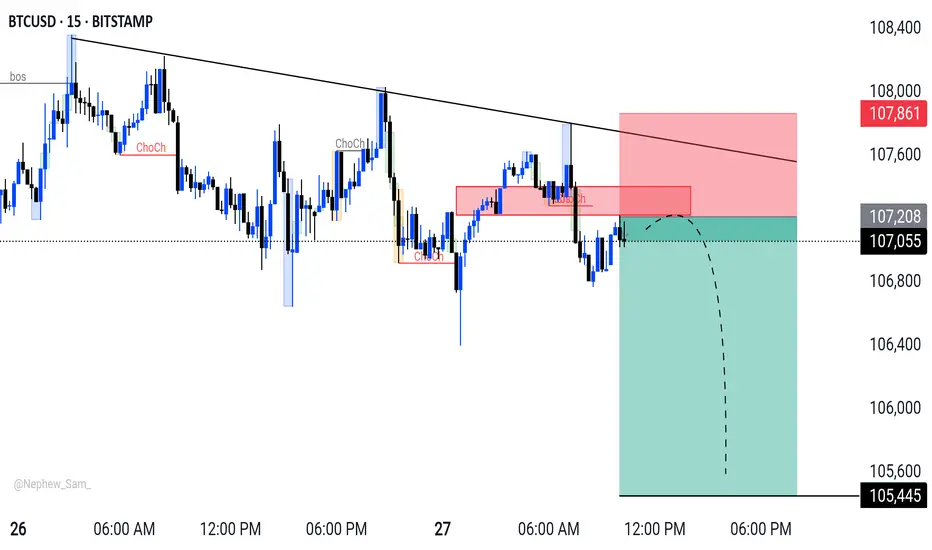
BTCUSD Short Idea - Looking for further downsideBTCUSD (15m timeframe).
* Bearish Trend: Price has been respecting the downtrend line.
* Structure Break (ChoCh): Multiple 'ChoCh' (Change of Character) signals indicate a shift in market structure to bearish.
* Supply Zone Entry: I'm looking for a retest of the recent supply zone around 107,208 - 107,059 for a short entry.
* Stop Loss: Placed above the last significant high and supply zone around 107,861.
* Target: Aiming for 105,445, potentially lower, targeting previous lows and liquidity.
Always manage your risk! Let me know your thoughts."
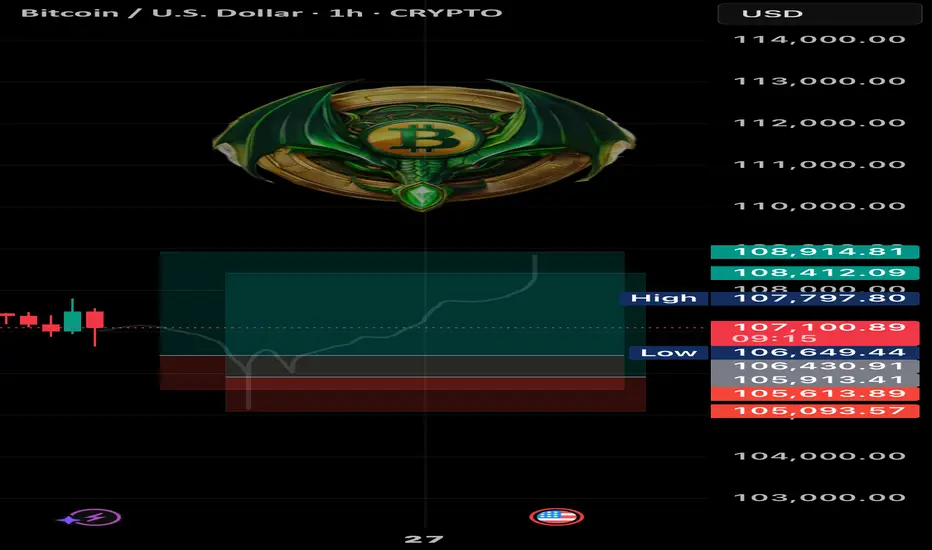
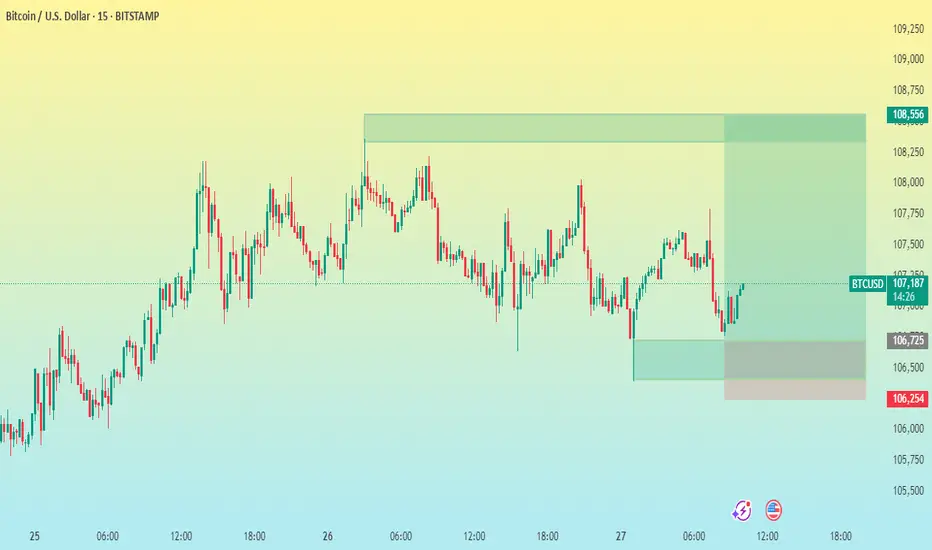
BTC/USD 15 M CHART PATTERN 🕵♂ Chart Context
Asset: Bitcoin (BTC) vs. USD
Exchange: Bitstamp
Timeframe: 15-minute
Date Range: June 25–27, 2025
Chart Type: Candlestick
---
📊 Technical Analysis
1. Trend
Short-term trend: Sideways to slightly bullish.
Market saw an earlier uptrend, then consolidation with lower highs and higher lows (forming a range).
Price is currently rebounding from the lower part of the range.
2. Key Levels
Entry Level: ~107,123 – likely where a long trade was entered.
Support Zone:
Minor: 106,725
Strong: 106,254 (stop-loss level, clear structure support)
Resistance Zone / Target: 108,556 – a prior high and possible supply zone.
3. Risk-Reward Ratio
Entry: 107,123
SL: 106,254 (−869 points)
TP: 108,556 (+1,433 points)
RR Ratio: ≈ 1.65:1 – acceptable for intraday trading.
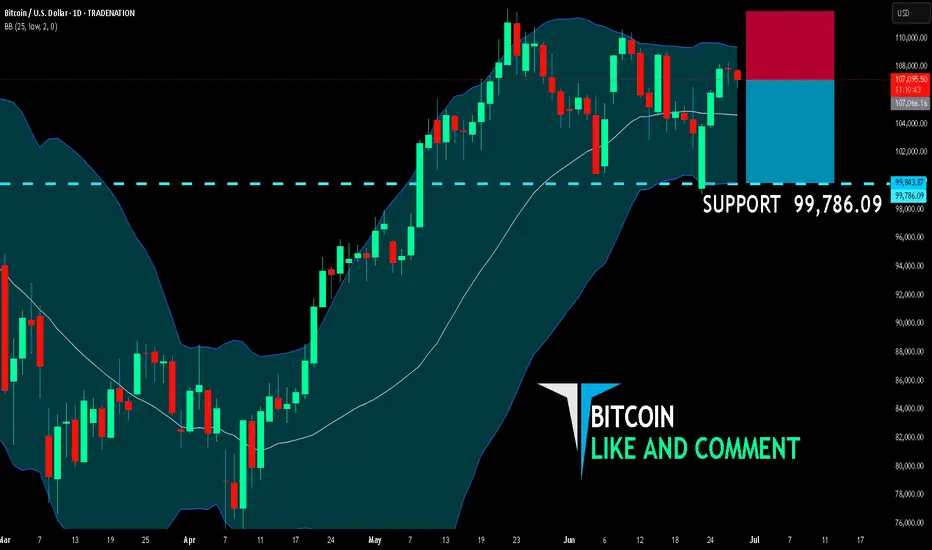
BITCOIN SHORT FROM RESISTANCE
BITCOIN SIGNAL
Trade Direction: short
Entry Level: 107,066.16
Target Level: 99,786.09
Stop Loss: 111,861.76
RISK PROFILE
Risk level: medium
Suggested risk: 1%
Timeframe: 1D
Disclosure: I am part of Trade Nation's Influencer program and receive a monthly fee for using their TradingView charts in my analysis.
LIKE AND COMMENT MY IDEAS
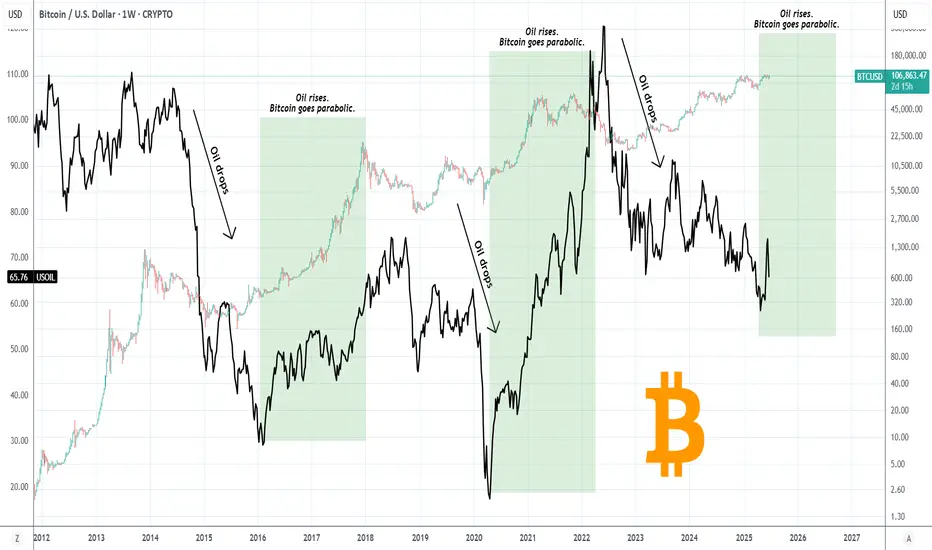
BITCOIN Just wait until OIL turns bullish!Bitcoin (BTCUSD) has a unique long-term relationship/ correlation with WTI Oil (USOIL) and this charts shows why.
In the past 11 years, when Oil started to decline sharply, Bitcoin formed a market bottom before Oil did. When Oil started to rise again, Bitcoin was out of its bottom and has initiated its Parabolic Rally stage (green Rectangle). Then Oil peaked after BTC has already priced its own Cycle Top.
Based on this correlation, we can assume that we haven't yet seen BTC's Parabolic stage as Oil hasn't yet started to rise. If we assume that the late April Low on Oil was its market bottom, then only now it has started its rise, so at best BTC has just started the Cycle's Parabolic Rally. If that turns out o be true, then the upside potential is huge for BTC. Needless to say other key macroeconomic factors have to assist e.g. higher adoption, ETF inflows, FED Rate Cut, but that's what the current chart says!
So do you think that Oil can be the driver behind a new Bitcoin parabolic rally? Feel free to let us know in the comments section below!
-------------------------------------------------------------------------------
** Please LIKE 👍, FOLLOW , SHARE and COMMENT if you enjoy this idea! Also share your ideas and charts in the comments section below! This is best way to keep it relevant, support us, keep the content here free and allow the idea to reach as many people as possible. **
-------------------------------------------------------------------------------
💸💸💸💸💸💸
👇 👇 👇 👇 👇 👇
“DXY at 3-Year Low | Gold Slips, BTC Stalls – What PCE Data Meann this week’s Market Recap, we break down the key moves across the US Dollar Index (DXY), Gold (XAUUSD), and Bitcoin (BTCUSD) — and how they’re all being shaped by rising Fed uncertainty and looming U.S. inflation data.
🔹 DXY is hovering near 3-year lows as political pressure and expectations of Fed rate cuts weigh on sentiment.
🔸 Gold is slipping near 4-week lows as Middle East tensions ease and risk appetite returns.
🔹 Bitcoin remains flat but poised for a breakout, with macro data in the driver's seat.
We explain how each market is reacting, what traders are pricing in ahead of the upcoming PCE inflation data, and how to position yourself in the week ahead.
📌 Covered in this recap:
Market sentiment shifts and key news drivers
Practical insights for interpreting price action
What to watch in next week’s economic calendar
📊 Stay informed, stay prepared.
👉 Like, follow, and comment if you found this helpful. Let’s trade smart.

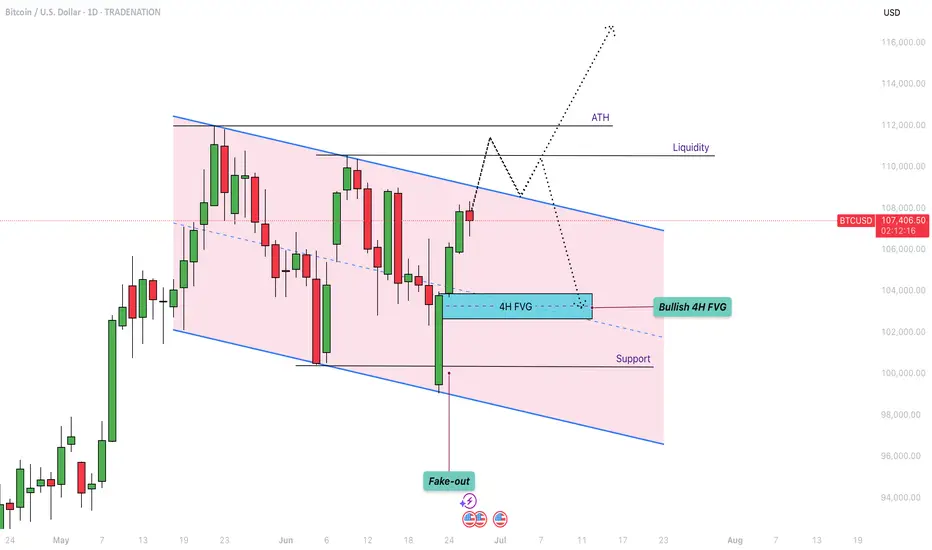
Bitcoin - Bullflag formation towards $111k?After the long and steep rally in Bitcoin that began on April 9th, the price is now entering a period of consolidation and forming a classic bullish continuation pattern known as a bull flag. This type of structure often appears after a strong impulsive move to the upside and signals that the market may be gearing up for another leg higher.
Bull Flag
On the daily timeframe, BTC is in the process of developing a bull flag by printing a series of lower highs and lower lows within a narrow descending channel. This pullback phase comes after a significant rally and is generally considered a healthy part of a trending market. It reflects a cooling-off period in which the market digests the prior gains while maintaining a bullish bias. This type of structure typically resolves to the upside, continuing the dominant trend. At present, BTC is approaching a key upper boundary of the flag formation, which also aligns with a prior zone of price rejection. This area could act as resistance in the short term and will likely play a crucial role in determining the next directional move.
4H Fair Value Gap
Zooming in on the 4-hour chart, we can observe a clearly defined fair value gap (FVG) between the $102,700 and $103,800 levels. This imbalance was created during the sharp move up and now represents a potential area of interest for buyers. If price retraces into this zone, it could act as strong support where demand steps in, filling the imbalance and potentially triggering the next upward leg. Fair value gaps often serve as magnet zones in trending markets, and in this case, could offer a key entry point for those looking to position long within the larger bullish structure.
Liquidity Levels
One of the more critical areas to watch lies around the $111,000 level, where we see a double top on the lower timeframes. This region holds a significant amount of resting liquidity just above it, as evidenced by the liquidation heatmap. These clustered stop-loss orders and leveraged positions create a liquidity pool that could attract market makers and large players looking to trigger a stop run. As price approaches this level, it becomes increasingly likely that the market may spike into this liquidity before deciding on a longer-term direction. This liquidity zone acts like a magnet and is a common target for short-term wicks and fake-out moves.
Expectations
The current expectation is for Bitcoin to push higher toward the $111,000 level before the market makes a more definitive move. While this upside continuation seems likely in the short term, caution is warranted, especially considering the structure on higher timeframes. The weekly chart is starting to show some signs of exhaustion, with momentum slowing and potential bearish divergence forming. As such, the move to $111,000 could simply be a liquidity grab—a final push to trap breakout traders—before a deeper correction or reversal unfolds. If price does manage to break the all-time high with convincing volume and sustained follow-through, the bullish case would strengthen significantly. Until then, however, it’s important to remain cautious and recognize the risk of a fake-out at these elevated levels.
Conclusion
Despite the strong rally in recent weeks, Bitcoin still faces substantial resistance overhead. The $111,000 level stands out as a critical zone that could act as a magnet, drawing in price action before reversing to the downside. This area is not only technically significant but also loaded with liquidity, increasing the risk of a bull trap. Traders should remain vigilant and avoid getting caught on the wrong side of the move. Watch closely for signs of exhaustion or divergence as price approaches this level, and be prepared for potential fake-outs designed to lure in overly aggressive participants. Staying patient and waiting for confirmation remains the most prudent strategy in this environment.
-------------------------------
Disclosure: I am part of Trade Nation's Influencer program and receive a monthly fee for using their TradingView charts in my analysis.
Thanks for your support.
- Make sure to follow me so you don't miss out on the next analysis!
- Drop a like and leave a comment!
Bitcoin is bullish again!Bitcoin’s been on a wild ride lately!
After crashing down from its all-time highs earlier this year, it’s suddenly bounced back and shot up again over the last few weeks. Here’s what’s really going on, in plain English:
First off, a lot of this has to do with what’s happening in the broader economy and politics. The US dollar has gotten weaker recently, especially after Trump started criticizing the Federal Reserve and pushing for interest rate cuts.
When the dollar drops or there’s drama around central banks, people start looking for alternatives, and BITSTAMP:BTCUSD is like the go-to “digital gold” for a lot of investors these days.
There’s also been a ton of money flowing into Bitcoin ETFs (those are investment funds that directly hold Bitcoin), especially from big institutions like BlackRock and Fidelity. These huge inflows mean more demand, but since there’s only so much Bitcoin out there, the price gets pushed up even more.
Another big reason is the recent Bitcoin “halving,” which happened about a year ago. Basically, every four years, the reward for mining new Bitcoin gets cut in half, so fewer new coins are created. This makes Bitcoin even scarcer , and historically, prices have always jumped in the months after a halving event. As we said in previous ideas BTC could be near USD 200k this summer.
On top of that, there’s been some good news about trade relations between the US and China, which has made investors more optimistic and willing to take risks again. When people feel better about the global economy, they’re more likely to put money into things like crypto.
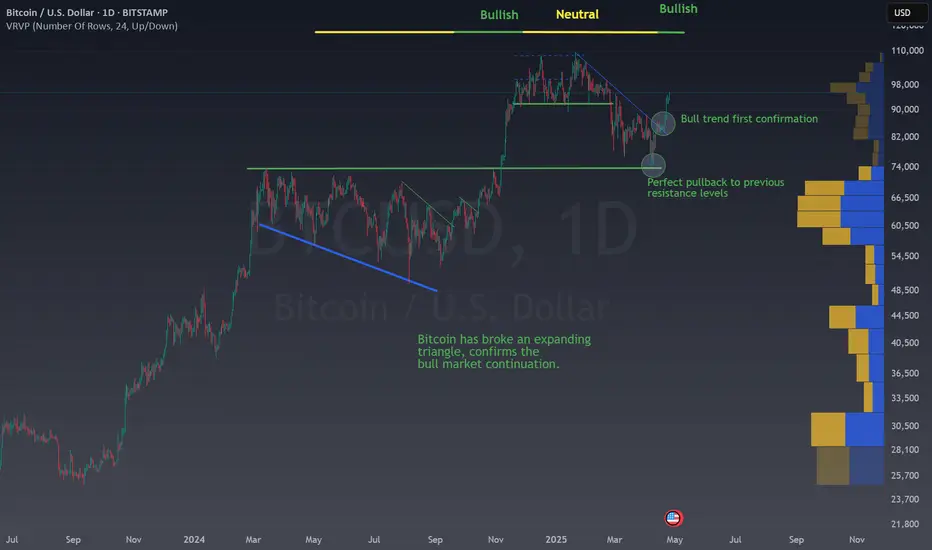
Technical confirmations
Bouncing in the previous 2024 highs is really good for Bitcoin, people was ready to buy a lot of BTC in the right price and after that a lot of inflows moved the price over the blue trendline meaning that this small downtrend is over.
Bitcoin is volatile, so this kind of movements are ideal to make money or invest in a discount. If the price moves below the support line, then I recommend to stay away of BTC because there could be a free fall...
So, to sum it up: weaker dollar, big institutional buying, post-halving scarcity, better vibes around global trade, and people running from stock market chaos—all of that has pushed Bitcoin back up after its recent dip. Who knows how long it’ll last, but right now, crypto’s hot again!
BTCUSD printing a bullish flag BTCUSD printing a bullish flag expected to make a all time high, entry with a buy stop above the last HH, RR .75: .75