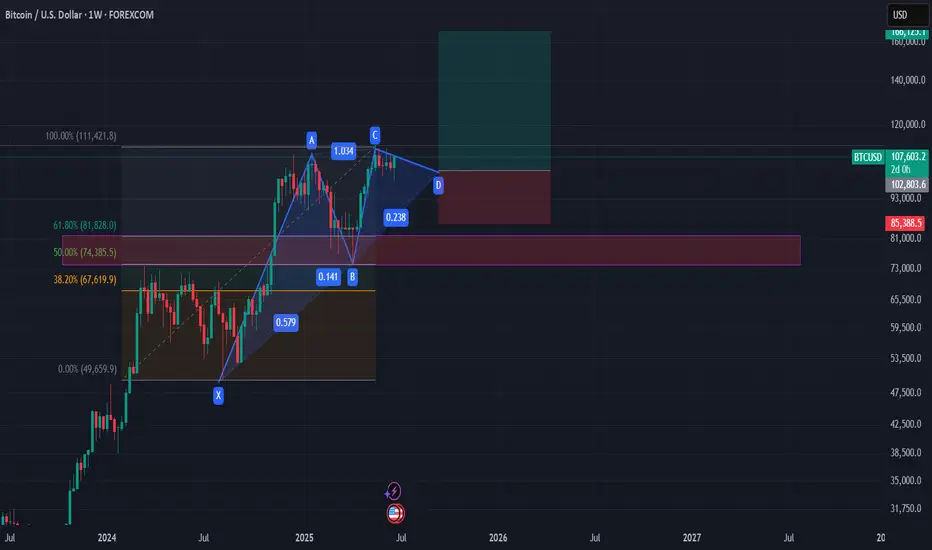
XABCD pattern with strong confirmation on Golden Zone of Fibo?XABCD pattern with strong confirmation on Golden Zone of Fibo?
I im strong bullish i think we are in the D Wave and then we gonna have some Pump IMO
do your own research
BITCOIN trade ideas
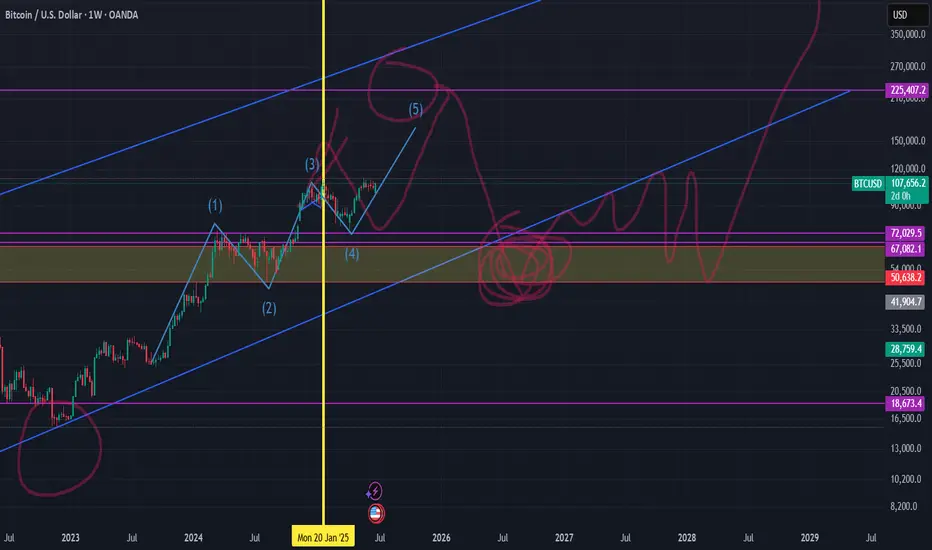
btc 5th wave of elliot wave?im still bullish on Btc i think we are in the last and 5th wave that will be in the next 3-4 months , and then blood in the streets for a huge bear market.
DYOR
₿itcoin: Grinding higherBitcoin has extended its recent rally, reclaiming the $106,000 level in the last few hours. While short-term setbacks remain possible, our primary scenario continues to point higher: prices should aim for the upper blue Target Zone between $117,553 and $130,891. Within this zone, BTC should complete green wave B before initiating a corrective decline in wave C, which should extend into the lower blue Target Zone between $62,395 and $51,323. At the low of major wave a, a temporary recovery in wave b is likely, preceding the final downward push that should mark the end of the broader wave (ii) correction. Our alternative scenario (30% probability) suggests that Bitcoin remains within blue wave alt.(i). If true, a breakout beyond the upper blue Target Zone could occur.
📈 Over 190 precise analyses, clear entry points, and defined Target Zones - that's what we do.

BTCUSD HTFBitcoin is a decentralized digital currency that you can buy, sell and exchange directly, without an intermediary like a bank. Bitcoin’s creator, Satoshi Nakamoto, originally described the need for “an electronic payment system based on cryptographic proof instead of trust.”
Every Bitcoin transaction that’s ever been made exists on a public ledger accessible to everyone, making transactions hard to reverse and difficult to fake. That’s by design: Core to their decentralized nature, Bitcoins aren’t backed by the government or any issuing institution, and there’s nothing to guarantee their value besides the proof baked in the heart of the system.

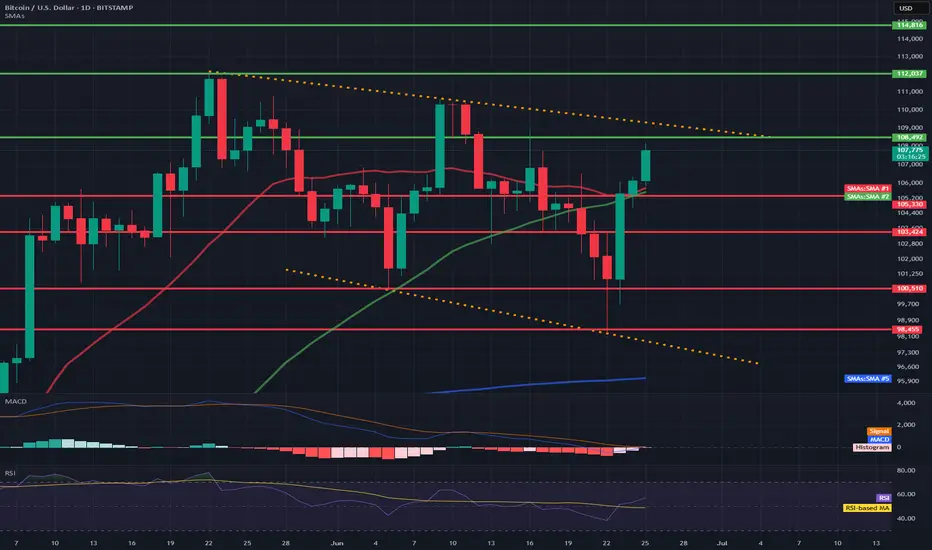
BTC/USD 1D Chart📊 1. Technical formation: Downtrend channel marked with orange lines
Upper trend line (resistance): ~108,200 – 110,000 USD
Lower trend line (support): ~98,455 – 97,000 USD
➡️ Such a formation usually ends with a breakout. The direction of the breakout will be key – currently, the price is testing the upper resistance line.
💵 2. Support and resistance levels
📈 Resistance:
108.202 – currently tested
112.037 – psychological level
114.816 – local top
📉 Support:
105.300 – SMA 50 + local support
103.424 – local lows
100.510 – key psychological support
98.455 – lower edge of the triangle
📉 3. Moving averages (SMA)
SMA 50 (green): currently as dynamic support (~105.300)
SMA 200 (blue): far below the price (~96.000), inactive in the short term
SMA 20 (red): price broke through it upwards – a signal of bullish strength
➡️ A bullish crossover took place between SMA 20 and SMA 50 → bullish signal.
📉 4. MACD (Momentum)
MACD line is approaching the intersection with the signal line from below.
The histogram is becoming less and less red → a potential intersection and a bullish crossover signal may occur any day now.
📉 5. RSI (Relative Strength Index)
Currently: 57.19
RSI is rising and approaching the overbought zone (70), but it is not overheated yet.
Exceeding 60 would be a signal of further bullish strength.
🔍 6. Volume and context
There is no volume marking on the candles, but:
The current bullish candle is strong and breaks through the key averages (SMA 20, 50).
This indicates buyer activity with technical support.
🟢 Bullish scenario (if a breakout occurs up)
A breakout above 108.200 with a close of the daily candle could open the way to:
112.037 (next resistance)
then even 114.816
🔴 Bearish scenario (false breakout)
A rejection from 108.200 and a drop below 105.300 → a possible return to:
103.424 or even 98.455 (lower triangle line)
BTCUSD Massive Long! BUY!
My dear subscribers,
BTCUSD looks like it will make a good move, and here are the details:
The market is trading on 99659 pivot level.
Bias - Bullish
My Stop Loss - 97824
Technical Indicators: Both Super Trend & Pivot HL indicate a highly probable Bullish continuation.
Target - 10315
About Used Indicators:
The average true range (ATR) plays an important role in 'Supertrend' as the indicator uses ATR to calculate its value. The ATR indicator signals the degree of price volatility.
Disclosure: I am part of Trade Nation's Influencer program and receive a monthly fee for using their TradingView charts in my analysis.
———————————
WISH YOU ALL LUCK
SELL BTCUSD NOW🚨 TRADE ALERT:
SELL BTCUSD NOW 💥📉
🔻 Market showing bearish signs.
🎯 Set your TP (Take Profit) levels wisely.
🛡️ Use SL (Stop Loss) to manage risk.
📊 Confirm with your strategy before entry.
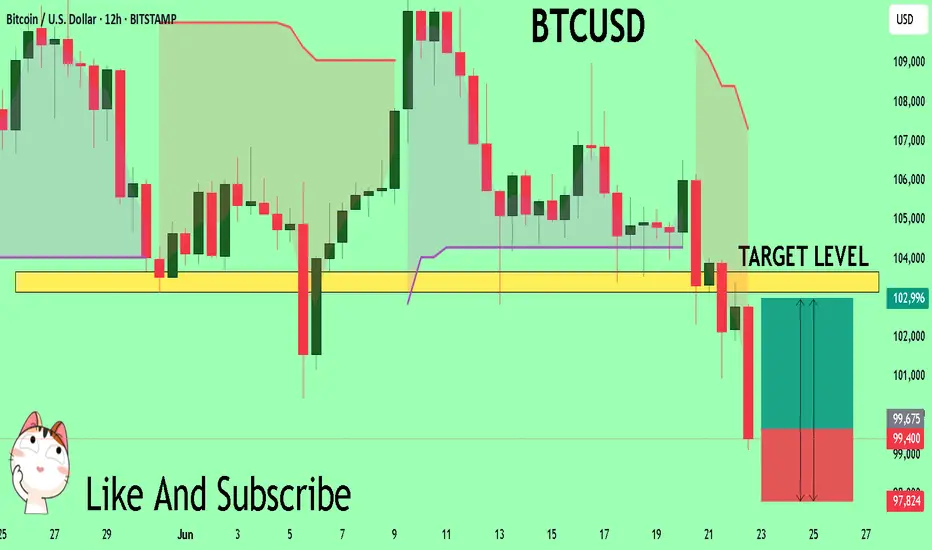
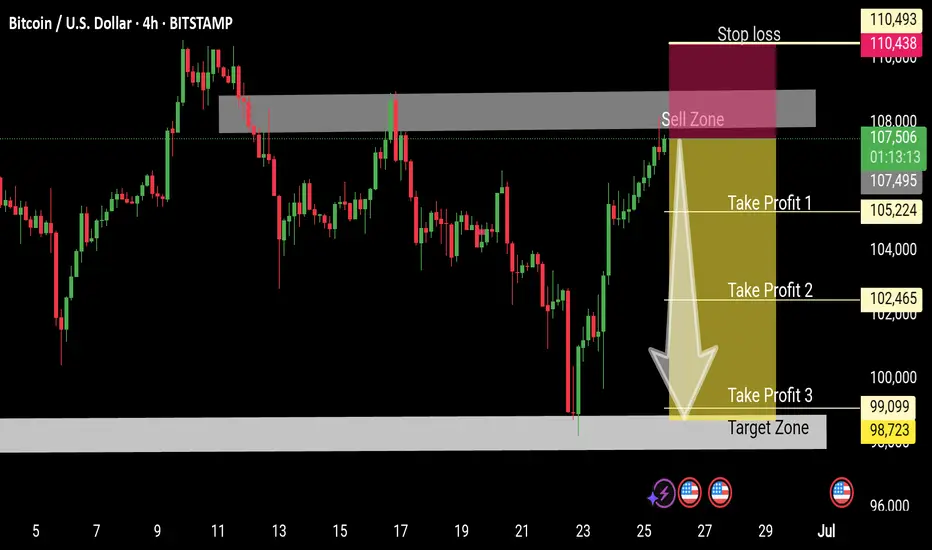
BTC/USD Potential Short Trade Setup - Detailed AnalysisThis chart indicates a potential short trade opportunity, where the price is approaching a key resistance zone. The current market scenario suggests a possible reversal or downward movement, especially if the price reacts to the sell zone ($107,495) and begins to decline.
Trade Parameters:
Sell Zone: $107,495
Stop Loss: $110,438 (Placed slightly above the resistance zone to account for any unexpected breakout)
Take Profit Targets:
1. Take Profit 1: $105,224 (Initial support level)
2. Take Profit 2: $102,465 (Second key support level for further downward movement)
3. Take Profit 3: $99,099 (Final target level)
Target Zone: $98,723 (A critical area for further downside potential)
Technical Analysis:
The price is currently in a strong resistance area where sellers have previously taken control.
A break below the sell zone could lead to a move towards the indicated targets.
RSI and other technical indicators suggest the market is approaching overbought conditions, increasing the likelihood of a downward move.
Risk and Reward Ratio:
This setup offers a balanced risk-reward ratio. Ensure the stop loss is strictly adhered to in order to protect against any unexpected movements.
BTC continues to short at high levels during the day📰 Impact of news:
1. Geopolitical impact
📈 Market analysis:
BTC has reached an intraday high of 108,125, just one step away from the all-time high of 112,000. With the increase in trading volume and institutional sentiment turning bullish, the momentum seems to be in the bulls' favor. In addition to institutional buying, the ceasefire agreement in the Iran-Israel war is also an important factor in Bitcoin's sharp rebound. Trump's announcement of the end of the war almost immediately triggered a surge in the cryptocurrency market. However, the overall pattern has not changed, and the range resistance has not been broken, so we still keep the idea of shorting at high levels.
🏅 Trading strategies:
SELL 108000-107500
TP 104500-103500
If you agree with this view, or have a better idea, please leave a message in the comment area. I look forward to hearing different voices.
1 Year of Bitcoin Bull Run Remaining? In the chart above, we’re analyzing Bitcoin’s historical cycles to see if the current cycle follows a similar pattern.
Bear Run (1 Year): In each of the last three cycles, Bitcoin experienced a bear market lasting exactly 1 year from the all-time high (ATH). This phase saw a significant drop in price as the market corrected.
Bull Run from Bottom (1,064 Days): In the last two cycles, once the bottom was established, Bitcoin entered a consistent bull market that lasted approximately 1,064 days. During this period, the price gradually climbed, eventually reaching new highs.
Current Bitcoin Cycle:
So far, the current cycle appears to be following the same pattern as previous cycles. We’ve already experienced a 1-year bear market after reaching the previous all-time high (ATH).
Currently, we have completed 2 years of a bull run from the bottom, aligning with the 1,064-day bull run observed in past cycles. Based on this historical pattern, we may have 1 year of bull run remaining, which could potentially push Bitcoin to new highs by late 2025.
If this trend continues, it suggests a strong opportunity for growth over the next year, mirroring the end phase of past cycles.
BINANCE:BTCUSDT BITSTAMP:BTCUSD CRYPTOCAP:BTC
Regards
Hexa

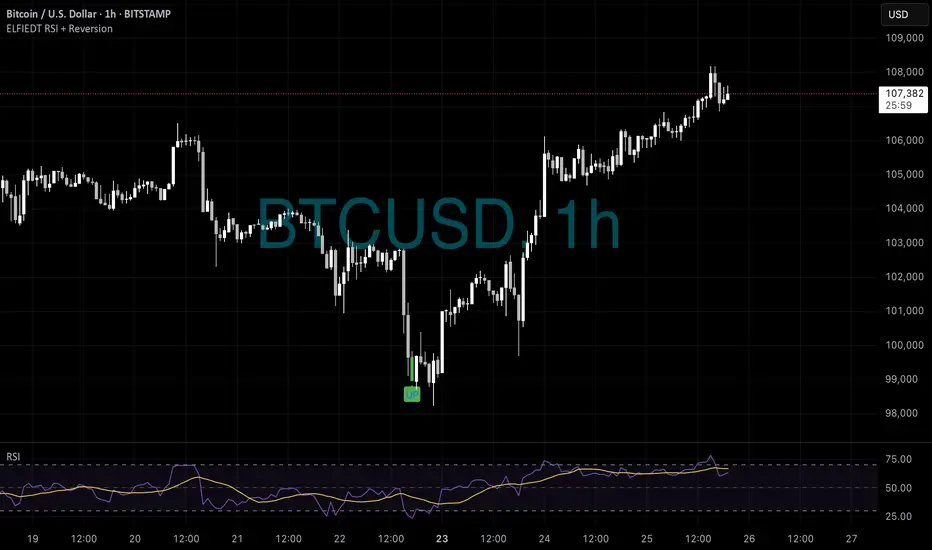
BTC - Longs???₿ Perfect Bitcoin Long from the Bottom
Instrument: Bitcoin (BTCUSD)
Timeframe: 1-Hour
Date: 22 June 2025
Indicator: ELFIEDT RSI + Reversion
🔍 The Setup:
After a sharp selloff, Bitcoin printed an “UP” signal just as price reached local exhaustion near the $100,000 zone.
While fear was high and momentum pointed downward, ELFIEDT detected the reversal conditions forming — and flagged the shift before any breakout was visible.
📈 The Result:
From the moment the “UP” signal appeared, BTCUSD launched into a clean rally — climbing over $7,000 in just a few days.
Traders who followed the signal saw:
✅ A low-risk entry from the bottom
✅ No chasing required
✅ A strong, clean uptrend with minimal drawdown
The early signal was key — while most were still bearish, ELFIEDT was already long.
📌 Key Takeaway:
ELFIEDT didn’t predict the news. It didn’t follow the herd.
It simply reacted to what the market was truly showing: an extreme condition with reversal potential.
The result was a near-perfect long.
🚀 Trade What You See, Not What You Feel
BTC’s bounce wasn’t random — it was algorithmically identified by ELFIEDT.
Your edge is in the data. Let the system guide you.
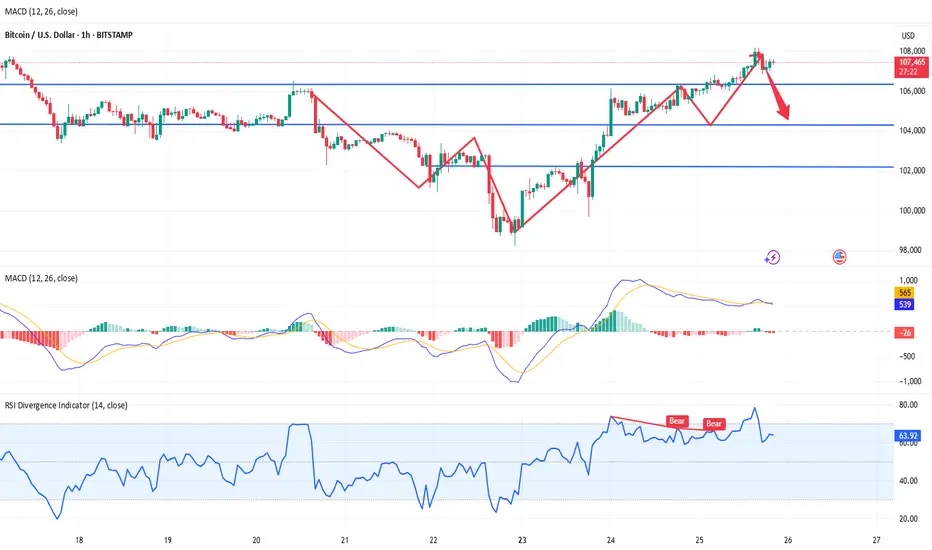
RSI High High 4HR RSI making a higher high breaking the Bear downtrend .
There is also an inverse head & shoulders and also price back inside the Bull pennant on the 1D .
BTCUSDNow that BTCUSD has reached our previous target at 107,848, we are updating our forecast.
The market remains structurally bullish, with the next upside objective at 109,400.
Although we've seen a reaction from a short-term supply zone, a slight pullback or pause is possible. However, due to visible liquidity resting above, there's a strong likelihood that price will extend higher toward 109,400.
At that point, we will closely monitor price action for signs of exhaustion or reversal to evaluate potential short opportunities.
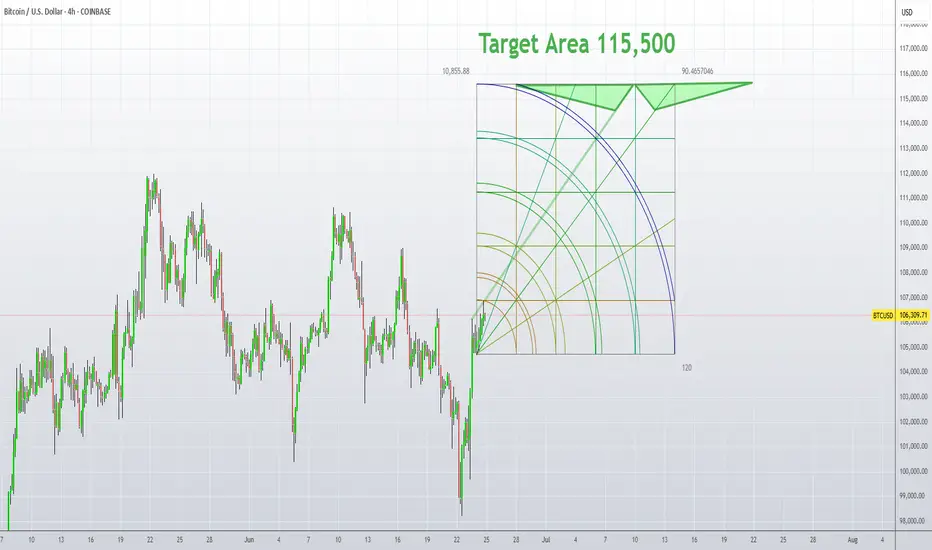
BTC 4-Hour Long Target 115,500Hello fellow Traders.
I am long, only posting my target area.
This Chart is very clean.
I came to the target conclusion area, with some Math, and I have used a Gann Square to monitor a time frame to reach the target area.
Yes, your reading it correctly, seems like it can happen as early as this Friday, and as late as July 22.
PA doesn't necessarily have to stay in the positive area of this Gann Square, and has all the right to swing back up inside positive, to finish it's goal.
The Plan:
The probability to reach the target within the time frame will fade slowly out, far past the Gann Square.
Yes, I am actually guessing where the nearest chance to reach this price level is going to happen "if it will happen" within the green target area, so I may close out my long trade somewhere along the way up. Afterwards scalp the box up and down till it hits the Target Area.
Except price to have an extremely high chance to bounce down from the Target Area, when it hits.
Good Luck !!
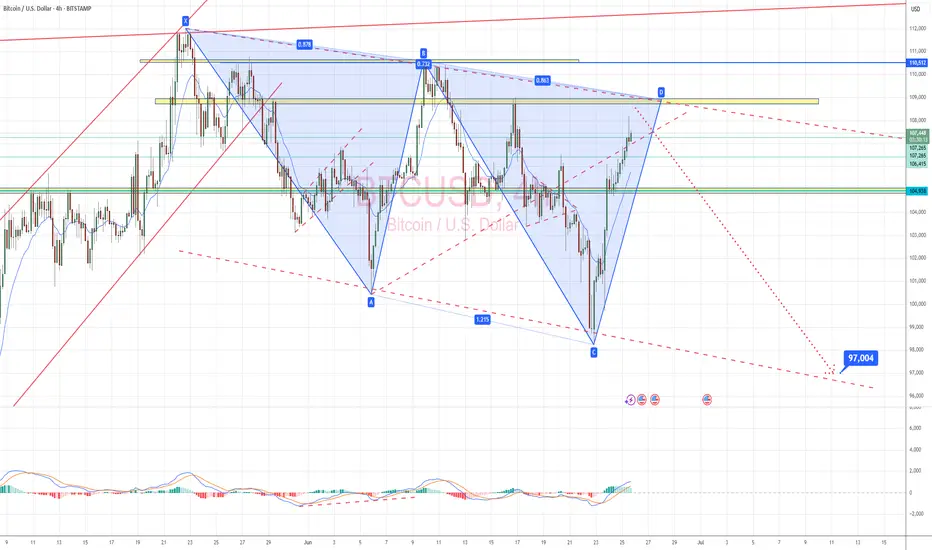
BTC next target!!!It's not the new ALL TIME HIGH, it's 97k.
Chart is saying everything in detail.
Let's go!!!
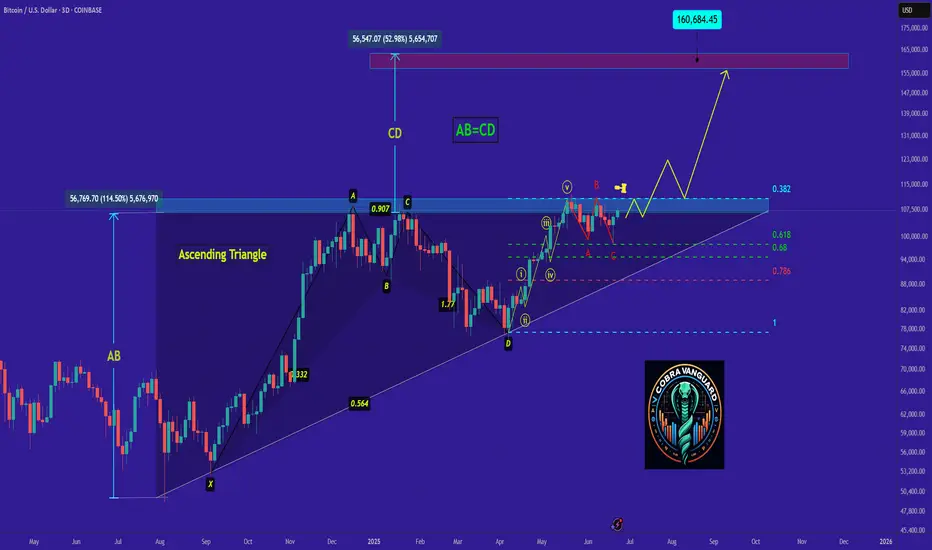
I don't know why ???Bitcoin is now at a point where it cannot be ignored! In my view, the bullish wave has started after the corrective wave ended. This wave could continue until it breaks the ascending triangle, then with a slight correction, push the price upward again. The current period and the coming days could be crucial in determining the market's trend.
Best regards CobraVanguard.💚
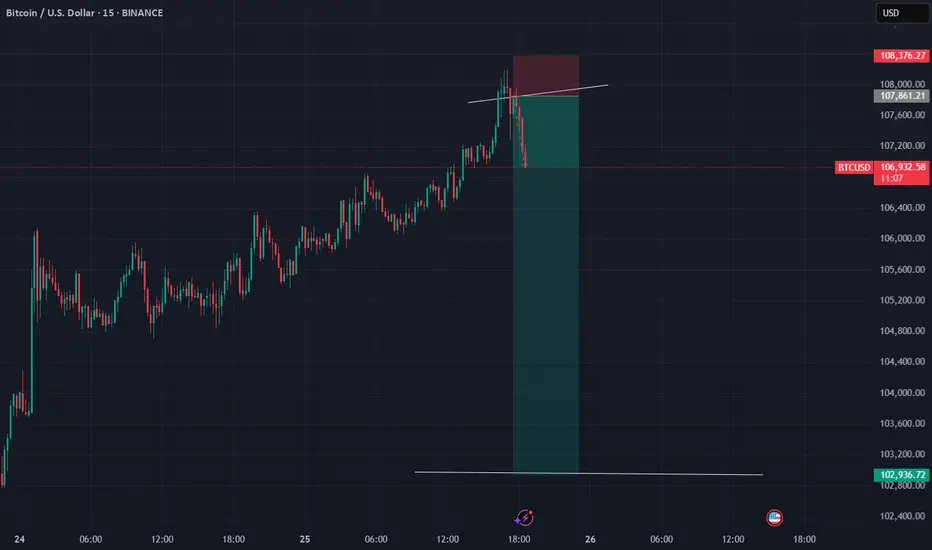
New buying opportunity may emerge for BTCBTC tends to fluctuate in the short term, but as BTC builds a double bottom structure to support the rebound pattern, it is currently inclined to fluctuate upward. Although the upward momentum has weakened after reaching around 106,000, as long as it stays above the 105,300-104,800 area, BTC is still expected to continue to rise and may challenge the 108,000-109,000 area again.
And with the collapse of the gold and oil markets, funds in the two markets may flow into BTC, which is more attractive and the mainstream market of cryptocurrencies. So as BTC retreats in the short term, BTC may have new short-term buying opportunities. Then if BTC retreats to the 105,500-104,500 area and does not fall below this area, we can consider going long on BTC at the right time.
BTCUS pullback before bullish continuation.Here we can see the trend is still bullish, however a potential pullback back to around 105000 is expected. Lets gooo!!!
Bitcoin Climbs Above $107K with Overbought Signals in PlayBitcoin closed above the 107,792 resistance after breaking the previous day's high. RSI and Stochastic indicators show overbought conditions, signaling short-term overpricing.
BTC may test the $109,000.00 resistance next, followed by a potential pullback toward $104,618.00, offering a favorable entry point for bulls.
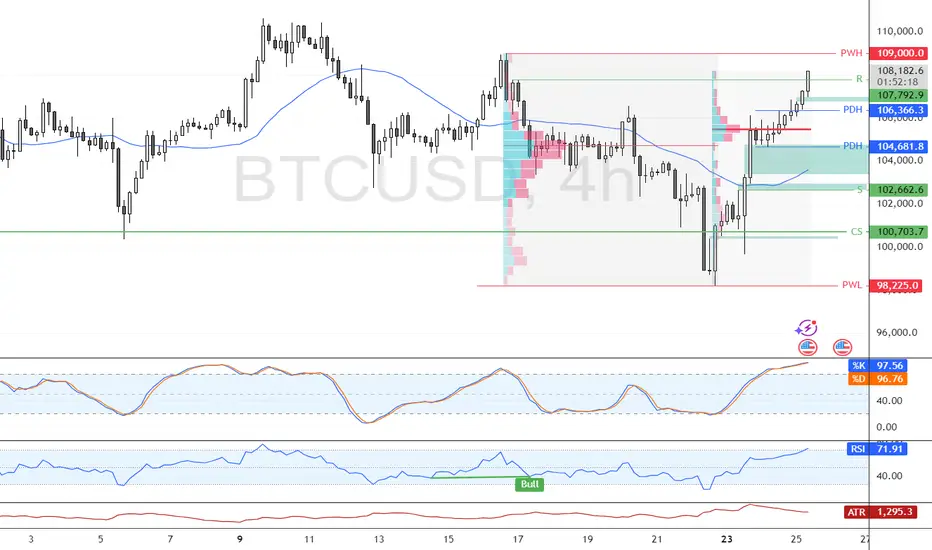
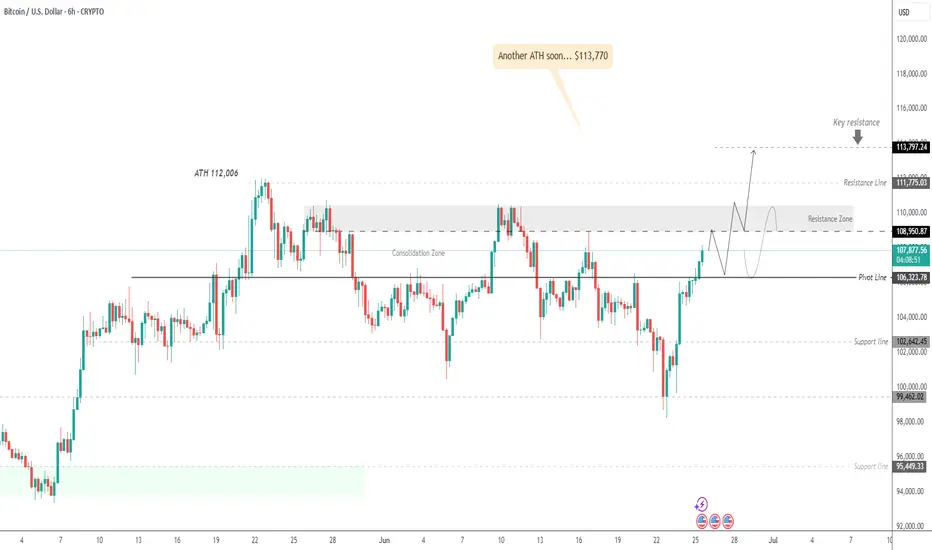
BTC Consolidates Above Pivot – Bullish Momentum Toward 113,770?BITCOIN OVERVIEW
Crypto Breakout or Crash? Powell's July Message Becomes the Deciding Factor
Federal Reserve Chair Jerome Powell’s testimony on Capitol Hill has intensified the uncertainty surrounding risk assets.
He emphasized that while inflation has eased significantly since mid-2022, it remains “somewhat elevated”, and the Fed is in no rush to shift its policy stance.
This leaves markets with a binary outcome: crypto breakout or macro-driven pullback—and July may be the turning point.
TECHNICAL OUTLOOK – BTC/USD
Bitcoin remains in bullish momentum, having stabilized above the pivot level at 107,750.
The price is currently pushing toward the key resistance zone between 108,950 and 110,360.
A breakout above this zone would likely lead to continuation toward the next ATH target at 113,770.
However, consolidation is expected between 108,950 and 106,320 until a breakout occurs.
Key Levels
Pivot Line: 107,750
Resistance: 108,950 → 110,360 → 113,770
Support: 106,320 → 104,150
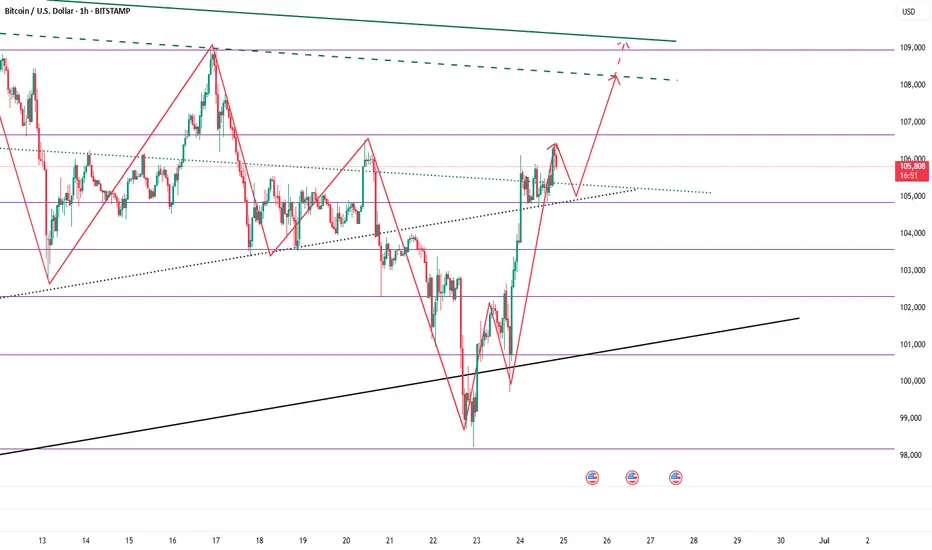
BTCUSD is about to sellFrom the chart, you will see that usdjpy is about sell after a small bull run.
Reasons;
1] Trendline touch strategy
2] Double top pattern
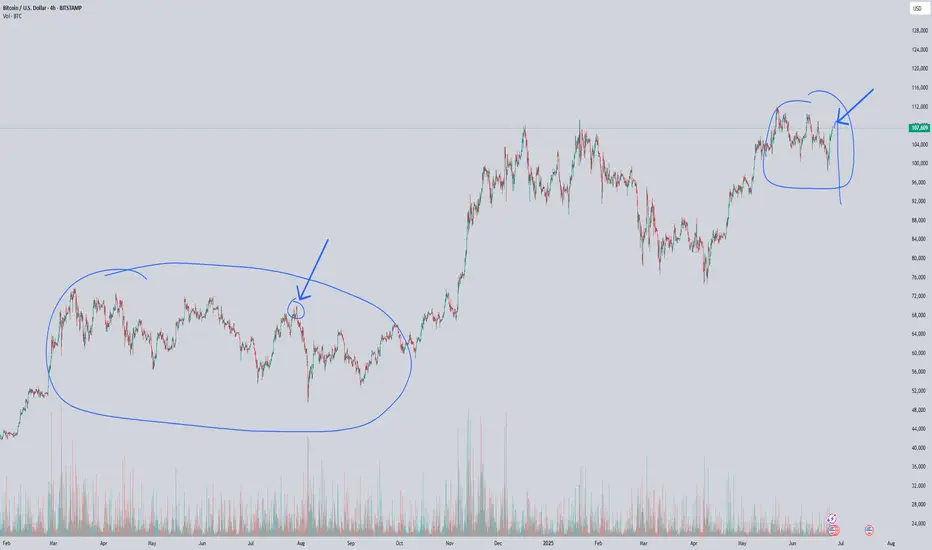
2/1/15I’ve found a fractal on Bitcoin. Today is June 25, 2025, 13:22 — I’m analyzing the 2-hour timeframe from the high on May 22 up to today, and the same pattern of pre-accumulation is forming as in 2024, from March 13 to July 29, 2024.
We are also inside a pattern I named “Dragon’s Wings.” It forms two peaks at the highs after a strong rally, and the shared low between them creates a deep retracement.
Whether this pattern leads to the beginning of a major drop and a bear cycle, or whether it’s a pre-accumulation structure in a buffer zone, depends on the area in which it forms.
In this case, the 93–74K zone is potentially a re-accumulation zone, with a reversal to the upside — possibly taking Bitcoin above $140,000.