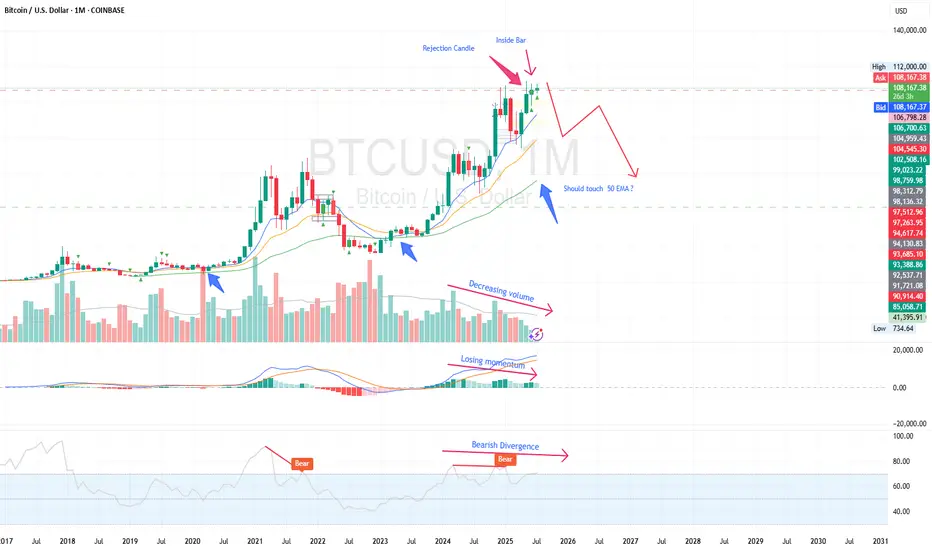
BTC monthly yelling at us for something interesting ?We read daily news about ETF, accumulation by institutes and scarcity in the exchanges, but I recognize something different in the chart based on multiple indicators. Historically, BTC boomed after touching 50 EMA and whenever it is extended it traces back to 50 EMA on monthly chart. As per current data, BTC is extended far from it. Also RSI and MACD indicating that it is losing momentum with -ve divergence. Volume as well descreasing since last leg, though price moved up. So, I expect price to retrace to 50 EMA which coincides with previous high at 60K. Let us see how it unfolds.
BITCOIN trade ideas
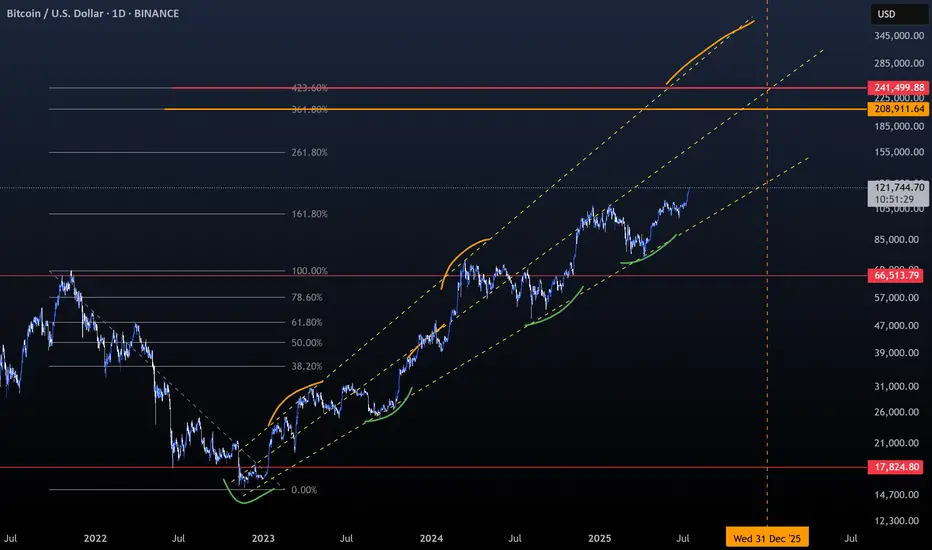
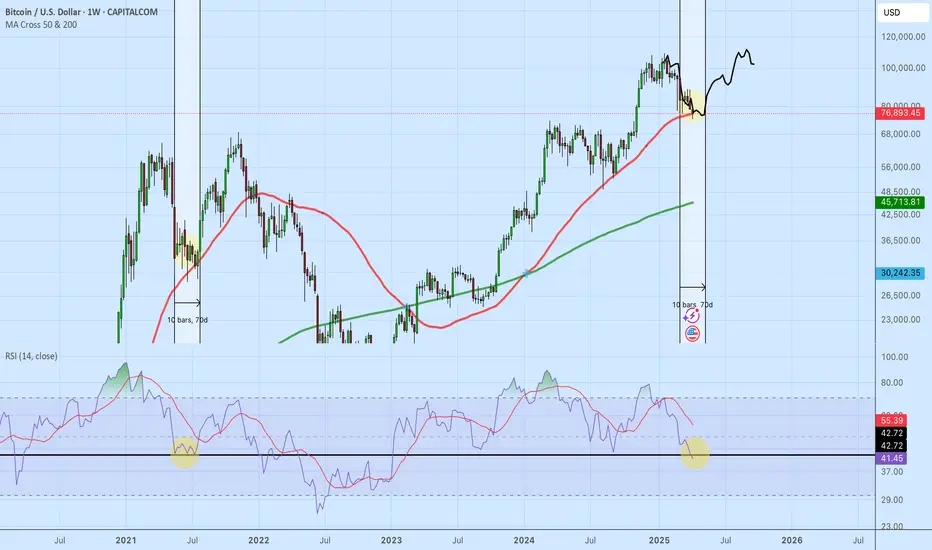
BTC - Onward and upwardThe 200 EMA is about to cross the 200 DMA and I show the last time that happened then I use the fractal from that period to project what BTC could do if something similar. It also lines up with fibs and channels. Let's see what happens
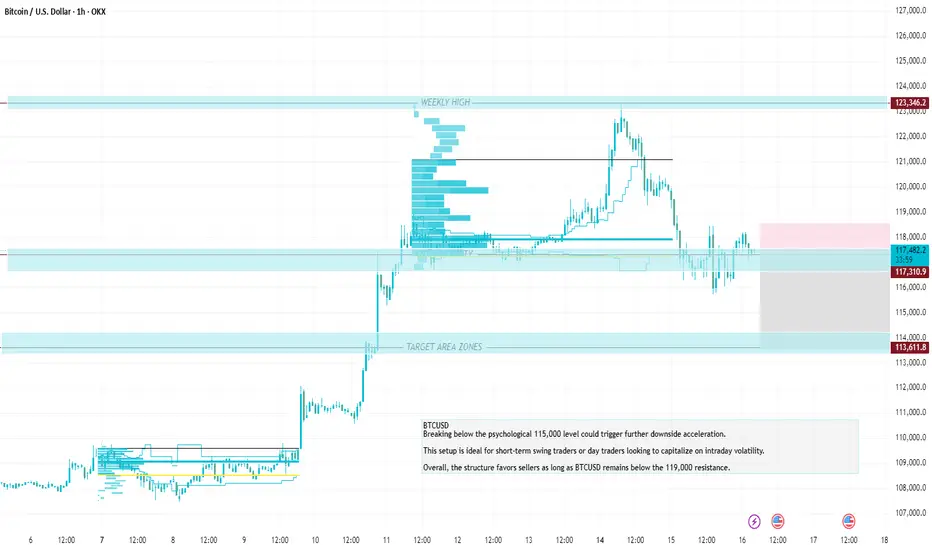
Breaking below the psychological 115,000 level could trigger furMomentum indicators such as RSI and MACD likely show bearish divergence or downward momentum, supporting the short thesis.
The recommended stop-loss for this setup is at 119,000, which is just above recent resistance and protects against false breakouts.
This SL level offers a good risk-reward ratio, with approximately 2:1 or better depending on entry precision.
If price fails to reclaim 119,000 or form higher highs, the bearish momentum is expected to persist.
Price rejection candles or bearish engulfing patterns near 117,500 further validate short entries.
Breaking below the psychological 115,000 level could trigger further downside acceleration.
This setup is ideal for short-term swing traders or day traders looking to capitalize on intraday volatility.
Overall, the structure favors sellers as long as BTCUSD remains below the 119,000 resistance.
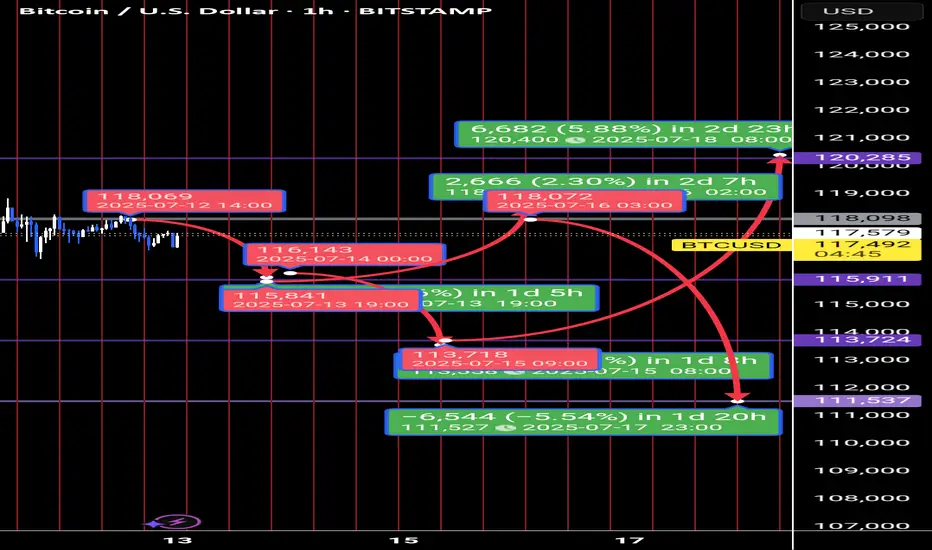
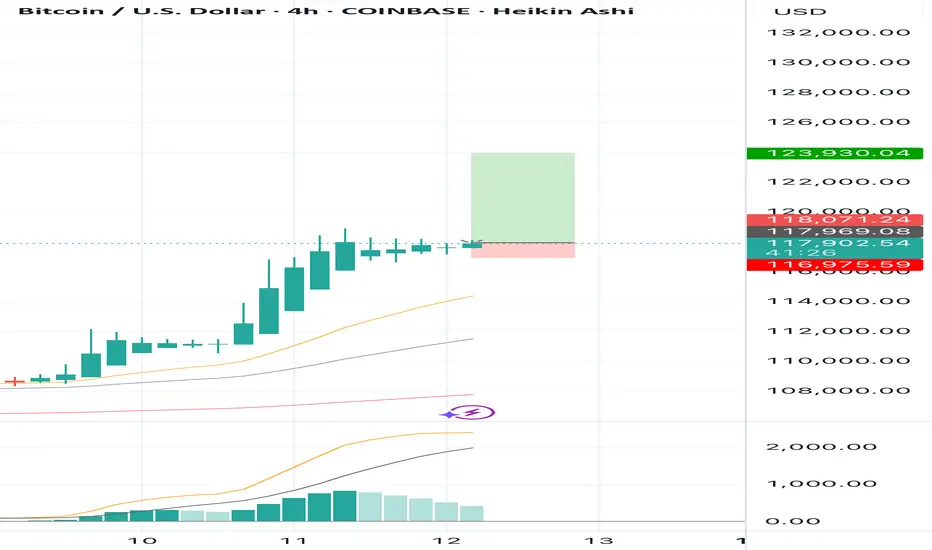
BTC - LTF Retracement TargetsPlease refer to our previous post:
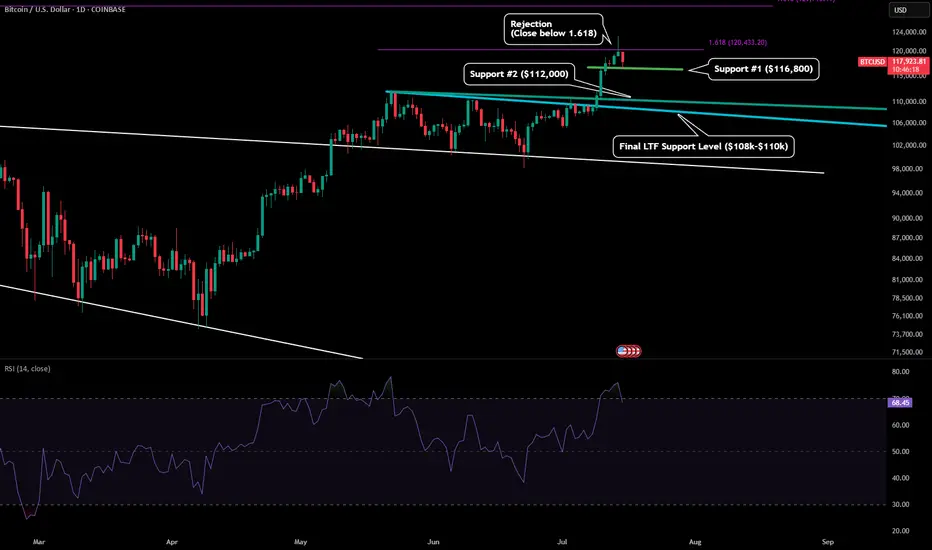
After identifying our first target right around $120.4k we are seeing the first signs of a cooloff. Until we get a daily candle close above this level price is likely to flush some leverage. The main move to $140k area is still likely to happen, but if we see a retracement in the short term here are the LTF levels to watch.
Support level #1 has been established with most of the candle bodies around $116.8k. If we lose that level then price is likely to test our previous ATH.
Support level #2 would be a test of our previous ATH around $112k or our teal trendline that connects the wick tops.
The final support level would be our macro old ATH right around $108-$110k. There is also a trendline there (which depending on what time it could be tested) would also be right in line with those price targets.
Bitcoin Early, Not LateA simple graphic with all annotations included :
- Trend.
- Fibonnacci.
- Middle Line.
- Support and Bounces.
- Resistances and dips.
- Everyone gets Bitcoin at the price they deserve.
- Not a price Prediction, keep things simple.
Happy Tr4Ding !
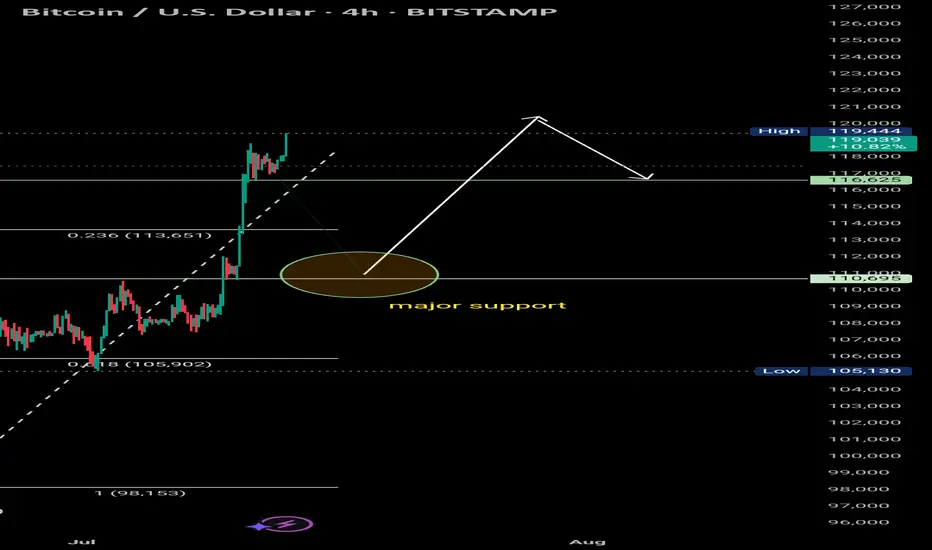
Bitcoin has made a new high at $119, 444.
High: $119,444 – New swing high reached, showing +25.71% gain from the recent low.
Bullish Continuation/If the support holds, buyers are expected to step in and push price further above the recent high toward the next resistance range of $124K+.
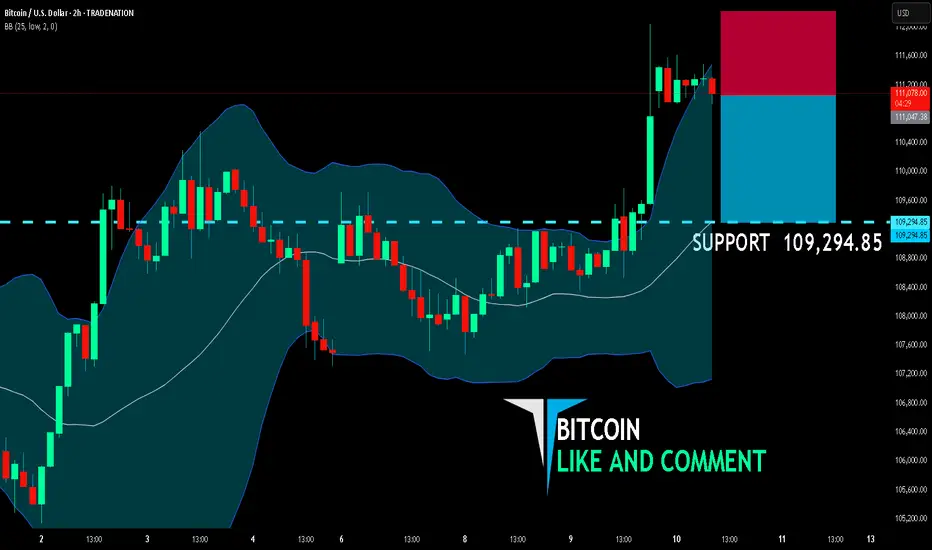
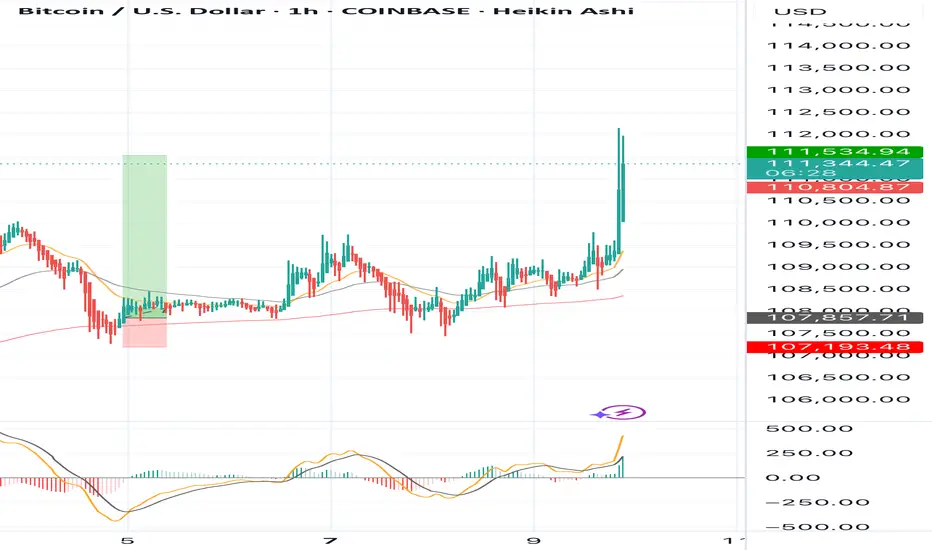
BITCOIN BEARS WILL DOMINATE THE MARKET|SHORT
BITCOIN SIGNAL
Trade Direction: short
Entry Level: 111,047.38
Target Level: 109,294.85
Stop Loss: 112,211.89
RISK PROFILE
Risk level: medium
Suggested risk: 1%
Timeframe: 2h
Disclosure: I am part of Trade Nation's Influencer program and receive a monthly fee for using their TradingView charts in my analysis.
✅LIKE AND COMMENT MY IDEAS✅
SELL BTCUSD NOW🚨 TRADE ALERT:
SELL BTCUSD NOW 💥📉
🔻 Market showing bearish signs.
🎯 Set your TP (Take Profit) levels wisely.
🛡️ Use SL (Stop Loss) to manage risk.
📊 Confirm with your strategy before entry.
BTC is clearly gearing up for its next big move.Could we see 120k next per the pattern unfolding before us?
It may not (or it could) happen now, but BTC definitely looking BULLISH!
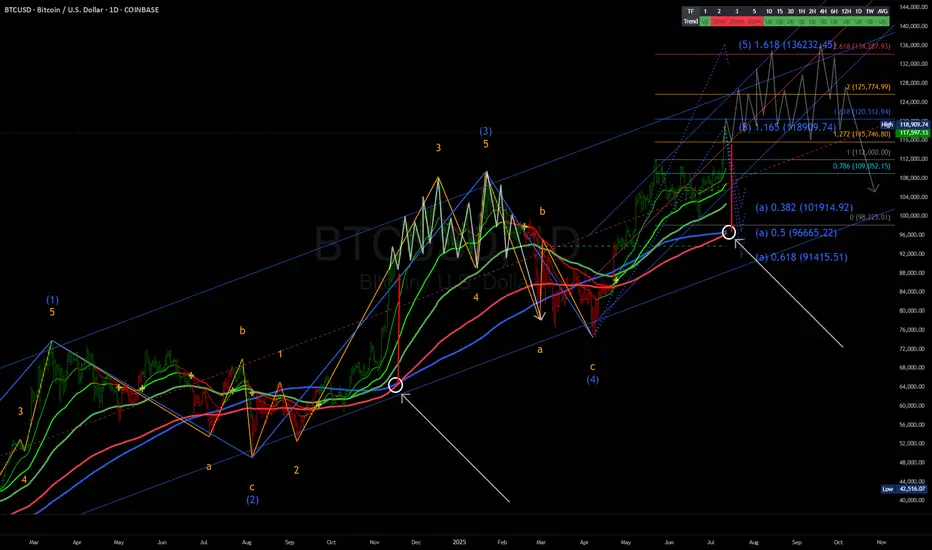
₿itcoin: ATHBitcoin recently marked a new all time high. Our primary expectation is for an even bigger breakout to the upside, allowing green wave B to reach its peak within the upper blue Target Zone between $117,553 and $130,891. After this corrective high, we anticipate a sharp sell-off during green wave C, which should drive Bitcoin down into the lower blue Target Zone between $62,395 and $51,323—where we also expect the low of the larger orange wave a. This move should, for now, signal the start of another corrective rally along orange wave b, with a retest of the freshly marked all-time high well within reach. Once this countertrend move concludes, another significant decline should follow as orange wave c develops, targeting the low of the higher-level blue wave (ii). Alternatively, there remains a 30% chance that the preceding wave alt.(i) is still in progress, which could result in a direct breakout above resistance at $130,891.
📈 Over 190 precise analyses, clear entry points, and defined Target Zones - that's what we do.

BITCOIN 2025 - THE LAST HOPECRYPTOCAP:BTC currently finds itself at the intersection of geopolitical tensions and broader macroeconomic uncertainty. Although traditionally viewed as a hedge against systemic risk, it is presently exhibiting characteristics more aligned with high-risk assets. The FED's forthcoming policy decisions will likely play a pivotal role in determining whether Bitcoin stabilizes or experiences further downward pressure.
The chart represents the most optimistic scenario for Bitcoin to date
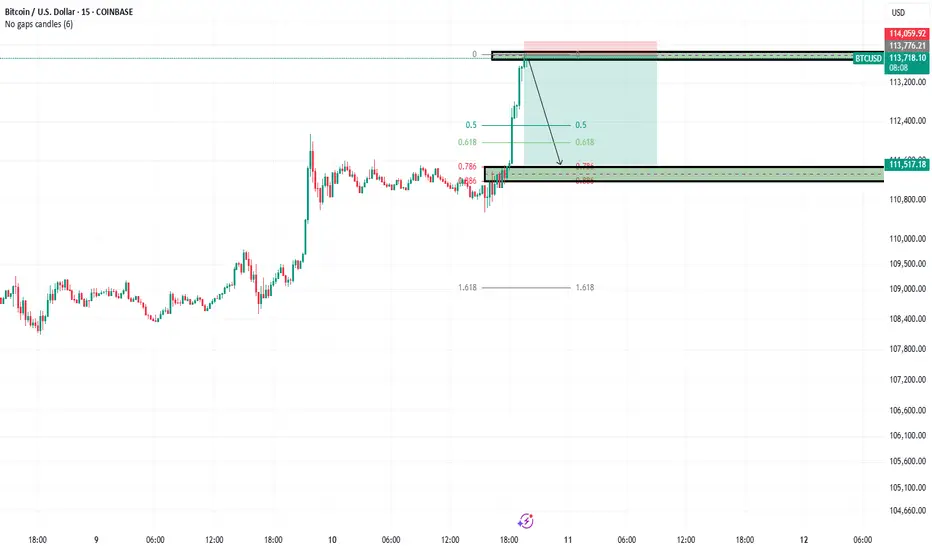
BTC Forecast: CPI Trap or Liquidity Sweep?Powered by Advanced Time-Price Analysis | Dr.Gemy | Digital Gann Strategy
Using Time Cycles, IPDA logic, and Digital Gann structure, the upcoming week for Bitcoin is setting up for a high-probability liquidity event, especially with high-impact macro data scheduled.
📍In the next 18 hours, we expect a short-term correction toward the 115,911 USD zone.
---
⏰ CPI (Tuesday) & PPI (Wednesday) = catalysts for smart money traps.
I expect a textbook liquidity hunt around the inflation data window.
Time is more important than price.
🔮 Two Critical Scenarios Unfolding:
✅ Scenario 1 – CPI Trap Setup (Tuesday News Play)
🕒 If BTC continues correcting into Tuesday (July 15), targeting 113,724 USD, this will align perfectly with the release of U.S. CPI (Inflation) data at 3:30 PM GMT+3.
📈 A fake bullish breakout above 118,098 USD could follow, luring retail traders with an inflation-driven spike, only to be reversed sharply to collect liquidity around 111,537 USD.
🧠 CPI y/y forecast is 2.6% vs 2.4% prior – higher inflation could spark temporary bullish reaction, but the underlying setup suggests it's a trap.
---
🎭 Scenario 2 – Smart Money Pump and Dump
📈 BTC might front-run expectations with an early week rally to retest 118,098 USD, only to reverse midweek (around Wednesday's PPI release) as the market reacts to deeper macro data and shifting dollar strength.
💣 Downside continuation could sweep below 113,724 USD, ultimately reaching the key demand base at 111,537 USD, which marks the beginning of the last major impulsive move.
---
🧠 Strategic Concepts Used:
Time Fractals (9H Cycle Lines)
Gann Reversal Timing & Breaker Blocks (H4)
Smart Money Traps around News
IPDA Voids & Liquidity Pools
CPI/PPI/Macro Liquidity Zones
#CryptoForecast #BTCUSD #CPIWeek #GannTiming #SmartMoney #LiquiditySweep #IPDA #ForexStyleCrypto #DigitalGann #DrGemy
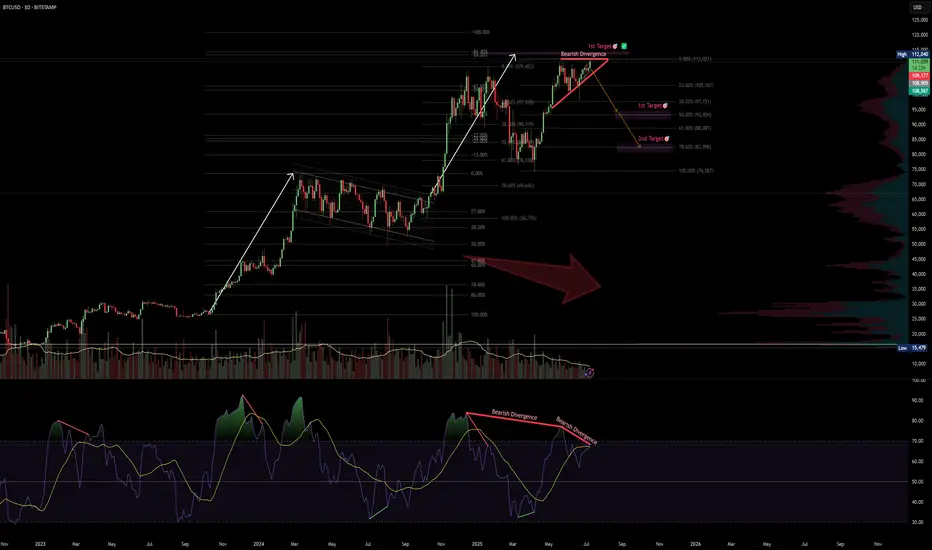
BTCUSD · 3D — Bearish Divergence + Volume Drop Suggest Pullback
🧠 Setup Overview
Bitcoin is showing signs of exhaustion after a parabolic rally:
Bearish divergence is visible on the 3D RSI — price made higher highs while RSI made lower highs.
Volume is shrinking with each push up, suggesting buyer momentum is fading.
Price is pressing into all-time highs without conviction, signaling potential for a pullback.
🔻 Downside Targets
Target 🎯 Level Why It Matters
Target 1 $92,300 (50% Fib) Midpoint of last impulse + first strong demand area.
Target 2 $82,500 (61.8% Fib) Volume-profile support + key confluence zone.
🔎 What Confirms the Setup?
Breakdown below $108K structure
Daily close below $105K with increasing volume
RSI losing midline support = momentum shift confirmed
❌ Invalidation
Daily close > $112K with strong volume = idea invalid
Would suggest continuation toward blue-sky breakout
✅ Summary
Bearish divergence + volume drop = classic topping signals
Risk is well-defined, with Fib-backed targets offering clean R:R
Trade cautiously — momentum is fading, not gone yet
📛 Disclaimer: This is not financial advice. Do your own research and manage risk according to your plan.
#Bitcoin #BTC #CryptoAnalysis #BearishDivergence #RSI #VolumeProfile #Fibonacci #TradingView
Congratulations to those of us that took this trade we just hit Congratulations to those of us that took this trade we just hit take profit now

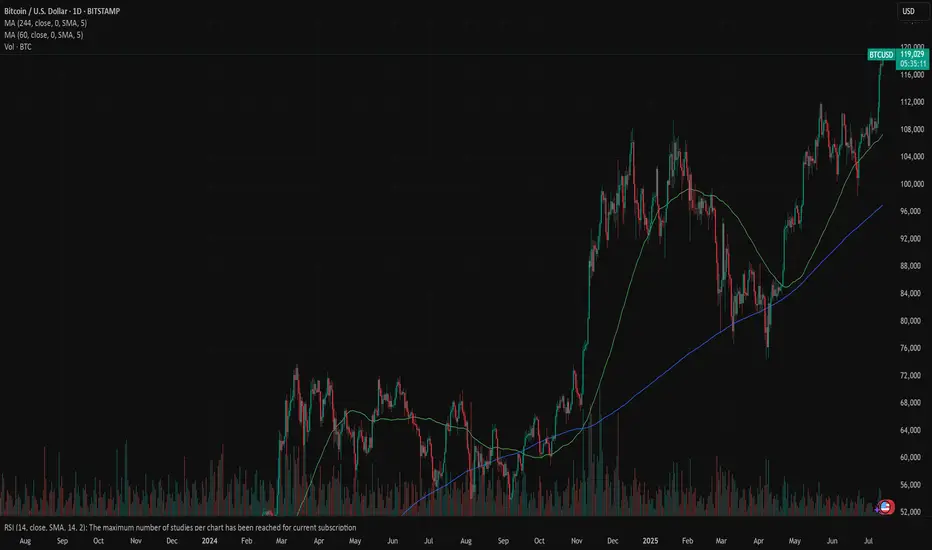
Bitcoin: celebrating new ATHCrypto enthusiasts are celebrating the latest achievement of BTC. The coin managed to reach another all time highest level during the previous week, at the level of $118,5K. Although BTC was struggling during the previous period to sustain the higher grounds, testing on several occasions the resistance level at $108K, the buying orders prevailed on Wednesday, bringing the skyrocket levels on Thursday and Friday. Crypto market significantly gained from the BTC move, as majority of other crypto coins gained in value, surging significantly total crypto market capitalization.
With the latest strong moves, the RSI reached a clear overbought market side, touching the level of 73. The indicator is closing the week at the level of 70, still continuing to move within the overbought market side. The MA50 is turning again toward the upside, leaving the MA200 aside. There is no indication of a potential cross in the coming period.
Charts are pointing to a potential for a short reversal of BTC price in the coming week. Such a move could be treated as “normal” in terms of how the market is functioning. A strong push toward the upside will make traders close their positions in order to take profits, which will shortly push the price toward downside. Where that level could be, at this moment, is hard to predict based on technical analysis, because BTC is currently moving in an uncharted territory.
BTC's increasing fomo force will push the price up furtherCRYPTO:BTCUSD just broke the important resistance zone and trendline around 110000. This price increase to create a new ATH will create a large amount of FOMO in the market pushing BTCUSD to increase more than half. 116,000 FIbonacci extension points are considered the immediate Target for the uptrend.
Waiting for retests to the support zone for the trend-following BUY strategy.
Support: 110000-107500
Resistance: 116000
Buy zone: 110000 ( support + trendline)
Buy Trigger: break above 112000
Leave your comments on the idea. I am happy to read your views.

Bitcoin in dangerzoneAgainst all influencers online let me warn you that the current Bitcoin position is one to be very aware of. We re sitting above a multi year long strong trendline, the volume is low to moderate so no blow off top coming. DO NOT BUY or chase here, you can lose it all.
My next targets are below 90k. XRP 1.5usd still valid.
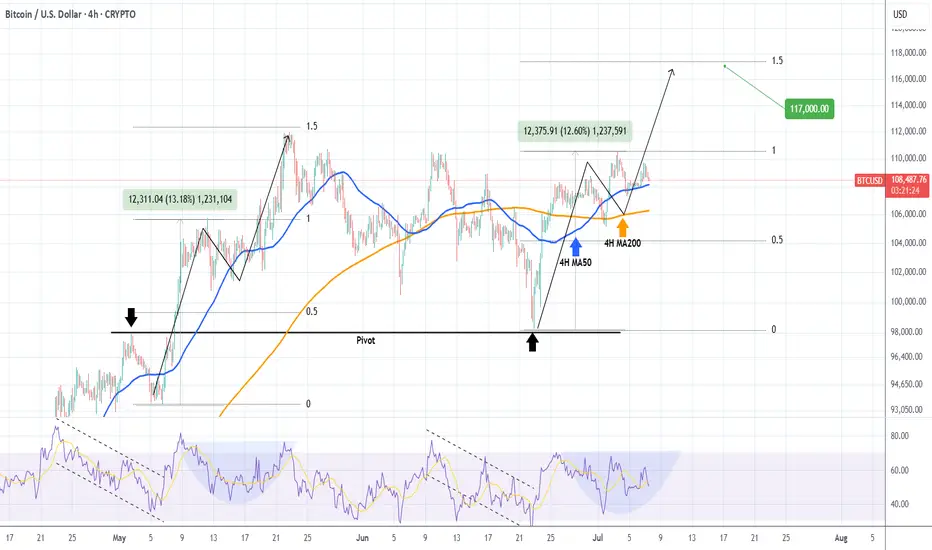
BITCOIN Short-term Target = $117kBitcoin (BTCUSD) is coming off a 4H Golden Cross, attempting to hold the 4H MA50 (blue trend-line) as its short-term Support. The early hours of the E.U. session today show that this might be a difficult task, however comparison with May's Bullish Leg, gives positive signs.
Almost the entire month of May sequence has been an uptrend, which looks very similar to today's. Almost identical rises from their bottoms (+13.60% against +12.60%) until the first top, with similar 4H RSI fractals also, we can expect the current uptrend to make a second top soon near the 1.5 Fibonacci extension at $117000.
Are you expecting such an outcome in the coming days? Feel free to let us know in the comments section below!
-------------------------------------------------------------------------------
** Please LIKE 👍, FOLLOW ✅, SHARE 🙌 and COMMENT ✍ if you enjoy this idea! Also share your ideas and charts in the comments section below! This is best way to keep it relevant, support us, keep the content here free and allow the idea to reach as many people as possible. **
-------------------------------------------------------------------------------
💸💸💸💸💸💸
👇 👇 👇 👇 👇 👇
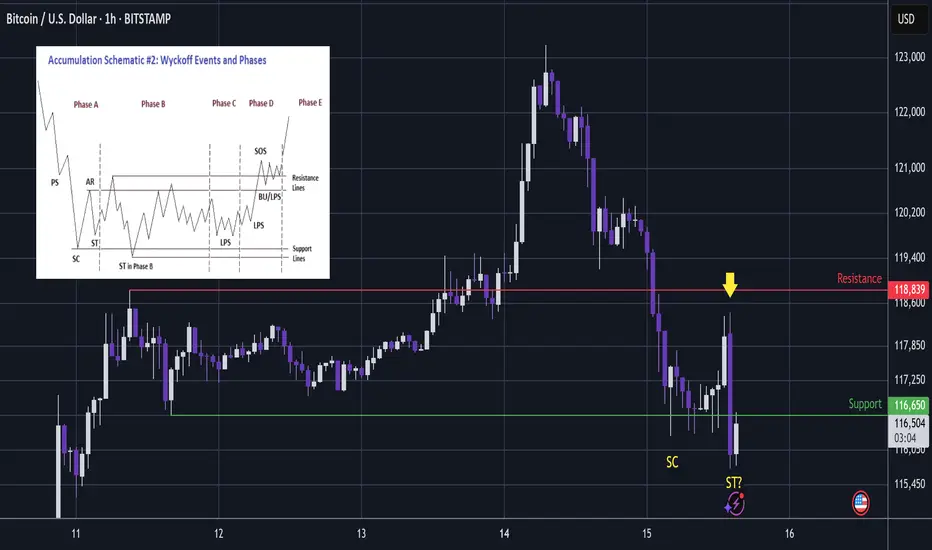
BTC - Capitulation. Now Time For A Bounce?Whenever there is a big impulsive rally, dumb money will come rushing in to buy.
And thus we can somewhat expect the market maker to print a shakeout for them to exit at best price and dumb money to carry the bags at worst price.
...
In this area we have multiple charts providing the liquidity zones for the shakeouts:
The upside shakeout (long wick) printed on TOTAL through ATH:
...
Before I make the next point, lets see the design of the chart bots 10 years ago in 2015.
Notice that the high and low of the trading range is set by the impulsive high then initial slump:
That sets the trading range.
Once set; the chart bots then print a liquidity sweeping slightly higher high...
Which slumps back to liquidity sweep the lows of the trading range.
From there the next wave up begins.
...
Now notice in these charts from the last 2 days, that the trading range was similar to that of 2015.
But once the range was set; rather than printing a simple slightly higher high, the more evolved chart bots printed a wild impulsive move up to draw in buyers.
This then became a very impulsive smackdown.
...
Although going on a wild journey, the price is effectively similar to the pattern of 2015; liquidity sweep at the highs and now it is below the low.
Notice on these 2 charts from the last two days that the support that Bitcoin has hit today was the obvious trading range low - similar to 2015.
And so the question is now; whether it will also be a liquidity sweep at the lows and a bounce will follow?
Notice on the chart, there was a big smackdown and then we have had another fast smackdown (arrow) to take price beneath the lows.
This looks very much like a fear test - where the chart bots try to sell you another immediate capitulation, but yet the price holds in the zone of higher liquidity below support.
Wyckoff would call these 2 lows SC Selling CLimax and ST Secondary Test.
The selling climax completes the real bearish wave down.
Secondary Test is the probe into higher liquidity which is a fear test to scare longs away.
...
So if we consider that history may not repeat, but it does rhyme then there will likely be a bounce in this area - as the market maker gets best price for their short positions while dumb money panic sell their long positions at a loss.
Not advice
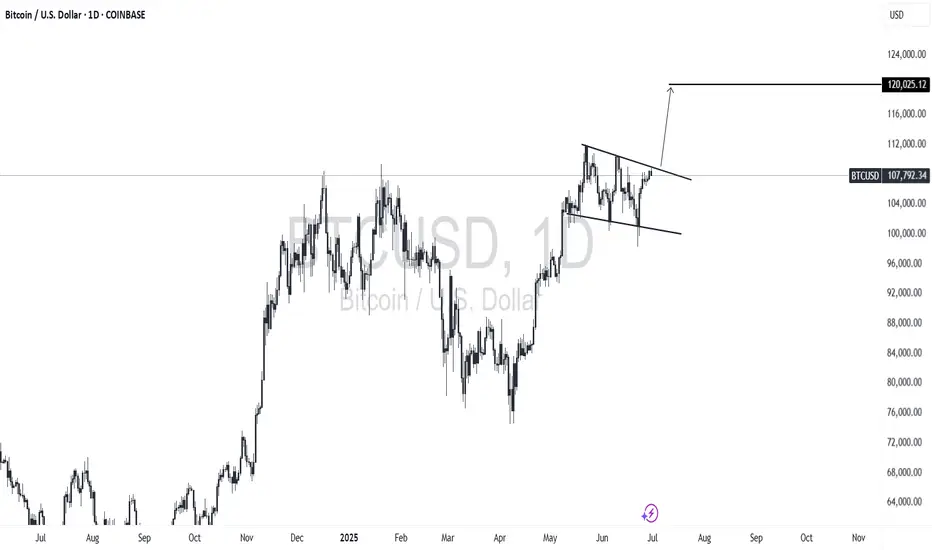
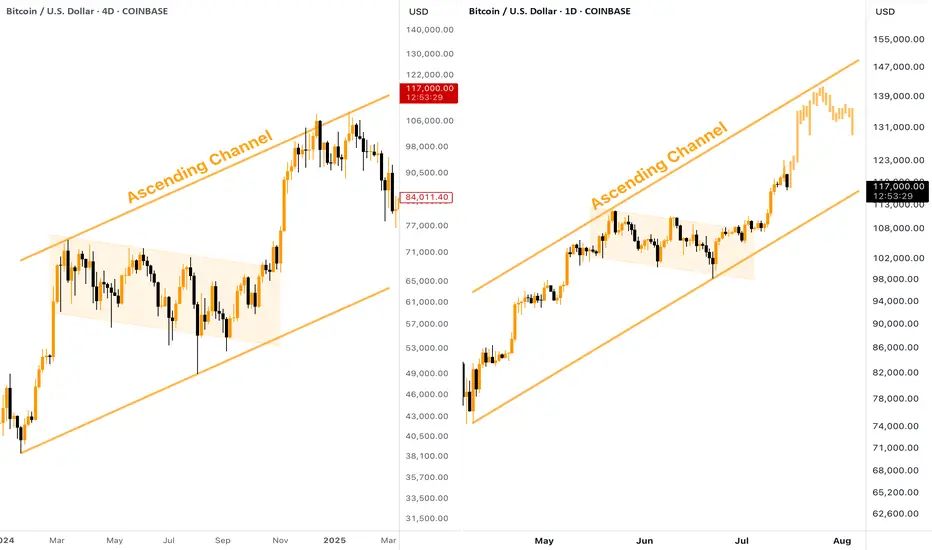
[BITCOIN] - Where is Potential TOP (ATH) of the Bull Cycle?Many people wondering where is the potential TOP of the current Bitcoin Bull Run? Besides setting a Fibo Retracement, we can take a look at the past. The current situation on CRYPTOCAP:BTC chart reminds me of what we've seen in the end of 2024, here is why:
Big ascending channel, price perfectly moves inside without breaking borders
Descending consolidation inside the bull flag
Strong breakout and pump towards the resistance of the channel
👉 According to this pattern, the target for the current Bitcoin upward move should be located in the $140,000 zone. Keep this in mind when planning your trades.
Buy bitcoin now..Let's scalp bitcoin buy for the weekend, Buy bitcoin now..Let's scalp bitcoin buy for the weekend, Is all fun to buy here because the strategy is so successful
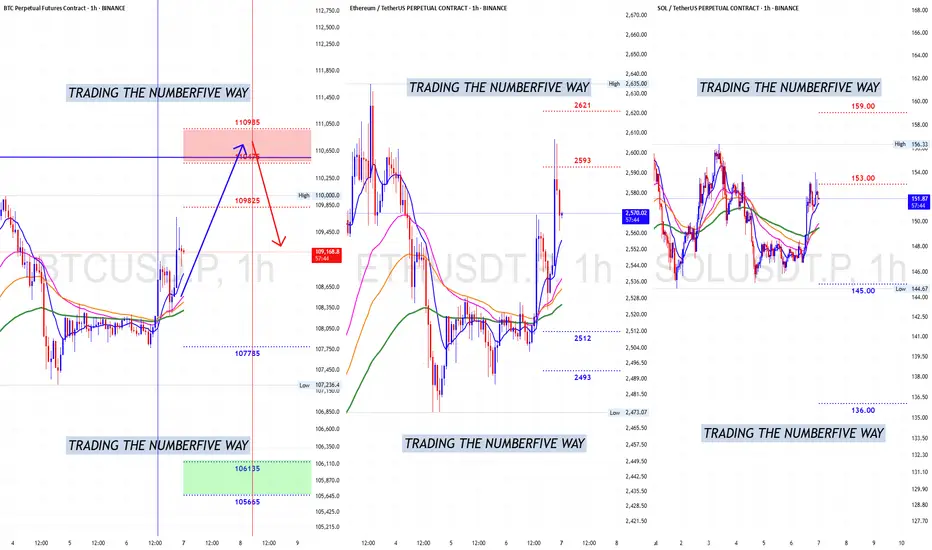
Bitcoin Running Out Of TIME.Bulls are doing a nice job at holding price in a tight range but are running out of TIME from the 1hr and 4hrs TF's pov while the Daily still needs a few days more to complete its setup for its next burst.
As long as Bitcoin stays within that $106k - $110k range soon we will be testing the ATHs which it should it done by now but its playing a little bit lazy.
Bitcoin still has like 26 1hr bullish candles of TIME to go as high as it can before the next drop take place and that drop will be the one that can put and danger the uptrend direction again so the higher the drop starts the less damage to the trend bears will do.
Buckle up ladies and gentlemen cause Bitcoin will get wild again.