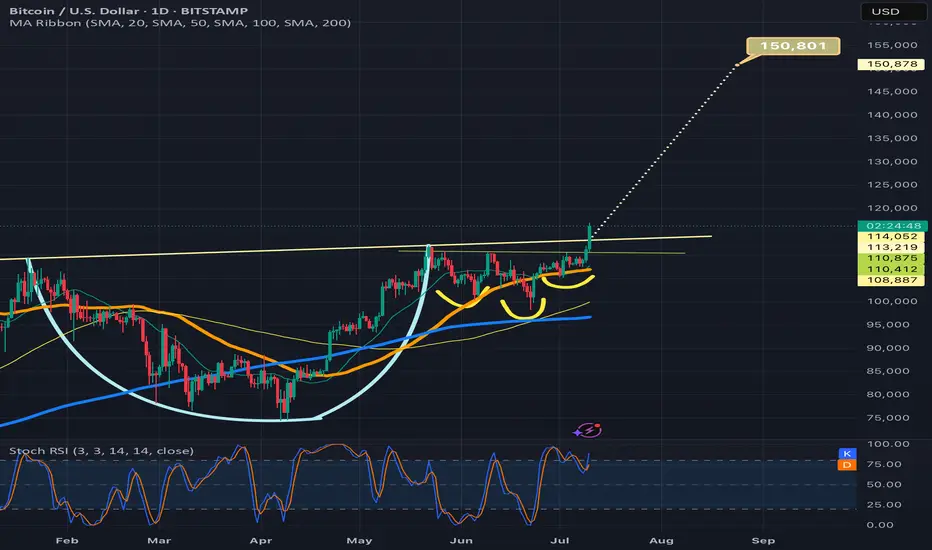
Btcusd breaking above cup and handle necklineIf it confirms the bullish breakout the target is 150k. Also by breaking above 116k and solidifying that level as strong support, we will trigger an even bigger inverse head and shoulders pattern (not shown here) with a breakout target around 208k! I will provide a link below to the chart I posted of that pattern. Thanks for reading, liking, and following. *not financial advice*
BITCOIN trade ideas
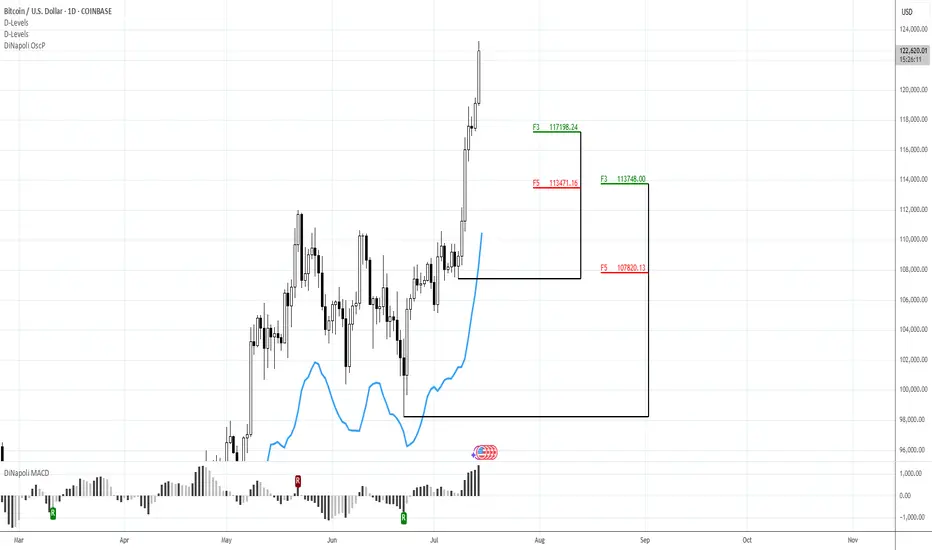
127KMorning folks,
So, BTC shows even better performance that we thought, although it obviously something stands behind, this is not market-natural motion. Anyway, we consider 127K level as all-time nearest target that stands on monthly chart.
If any pullback starts (BTC now is at daily overbought and near Yearly Resistance Pivot), we keep an eye on 117.2K and 113.5K levels to decide on long entry
BTCUSD supported at 114,000BTCUSD broken a major resistance at 113,000.
I would be buying any dip towards 114,000 for higher levels.
The target is located at 150,000 and 160,000 in coming three months.
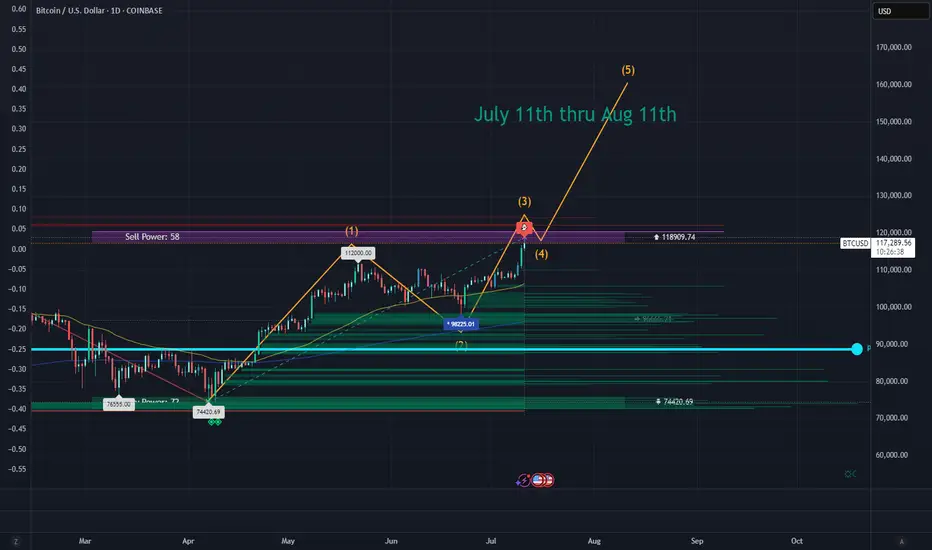
$160K BTC by AUG 11thI think we are in the 2nd to last leg up to top of Bull run. 5 waves to this one should put us at $160k, then a 3 wave down before the last 5 waves up for top by end of year. this could all be done in Aug or sept. Will have to check then to see what happens. But I call for $160k within 30 days. Bold I know. Lets go Moon shot. Top of bull run. $190k ? thoughts?
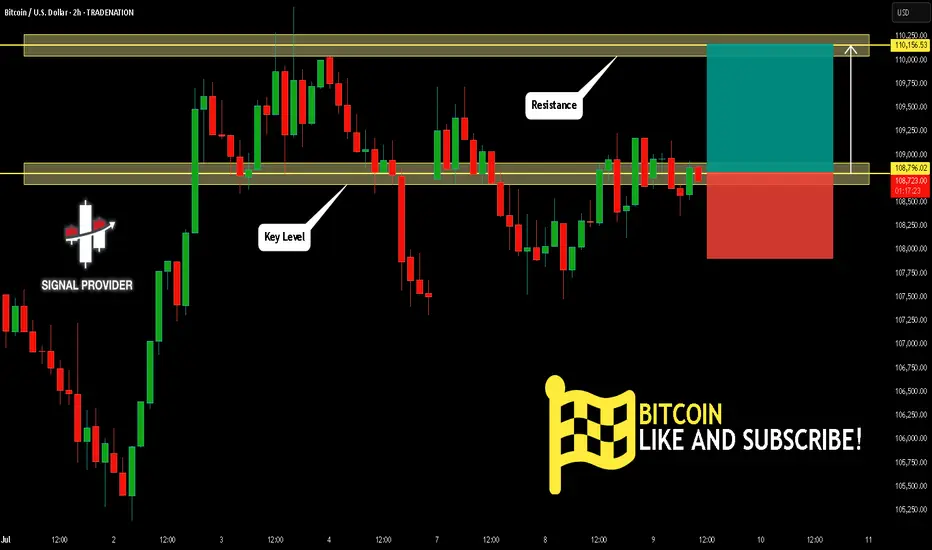
BITCOIN Will Go Up From Support! Buy!
Take a look at our analysis for BITCOIN.
Time Frame: 2h
Current Trend: Bullish
Sentiment: Oversold (based on 7-period RSI)
Forecast: Bullish
The market is testing a major horizontal structure 108,796.02.
Taking into consideration the structure & trend analysis, I believe that the market will reach 110,156.53 level soon.
P.S
Please, note that an oversold/overbought condition can last for a long time, and therefore being oversold/overbought doesn't mean a price rally will come soon, or at all.
Disclosure: I am part of Trade Nation's Influencer program and receive a monthly fee for using their TradingView charts in my analysis.
Like and subscribe and comment my ideas if you enjoy them!
BRIEFING Week #29-30 : BTC stalling, ETH & then Alts ?Here's your weekly update ! Brought to you each weekend with years of track-record history..
Don't forget to hit the like/follow button if you feel like this post deserves it ;)
That's the best way to support me and help pushing this content to other users.
Kindly,
Phil

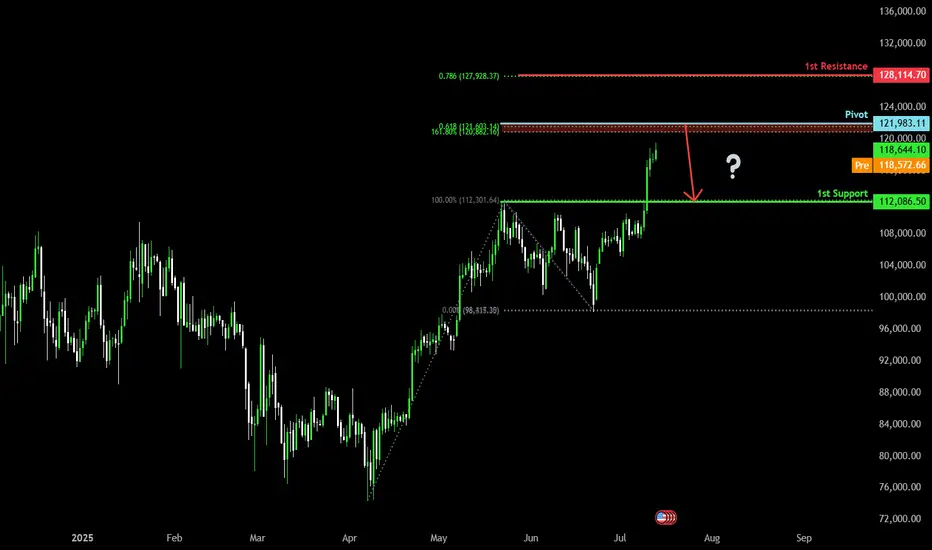
Bearish reversal off Fibonacci confluence?The Bitcoin (BTC/USD) is rising towards the pivot and could reverse to the 1st support which is a pullback support.
Pivot: 121,983.11
1st Support: 112,086.50
1st Resistance: 128,114.70
Risk Warning:
Trading Forex and CFDs carries a high level of risk to your capital and you should only trade with money you can afford to lose. Trading Forex and CFDs may not be suitable for all investors, so please ensure that you fully understand the risks involved and seek independent advice if necessary.
Disclaimer:
The above opinions given constitute general market commentary, and do not constitute the opinion or advice of IC Markets or any form of personal or investment advice.
Any opinions, news, research, analyses, prices, other information, or links to third-party sites contained on this website are provided on an "as-is" basis, are intended only to be informative, is not an advice nor a recommendation, nor research, or a record of our trading prices, or an offer of, or solicitation for a transaction in any financial instrument and thus should not be treated as such. The information provided does not involve any specific investment objectives, financial situation and needs of any specific person who may receive it. Please be aware, that past performance is not a reliable indicator of future performance and/or results. Past Performance or Forward-looking scenarios based upon the reasonable beliefs of the third-party provider are not a guarantee of future performance. Actual results may differ materially from those anticipated in forward-looking or past performance statements. IC Markets makes no representation or warranty and assumes no liability as to the accuracy or completeness of the information provided, nor any loss arising from any investment based on a recommendation, forecast or any information supplied by any third-party.
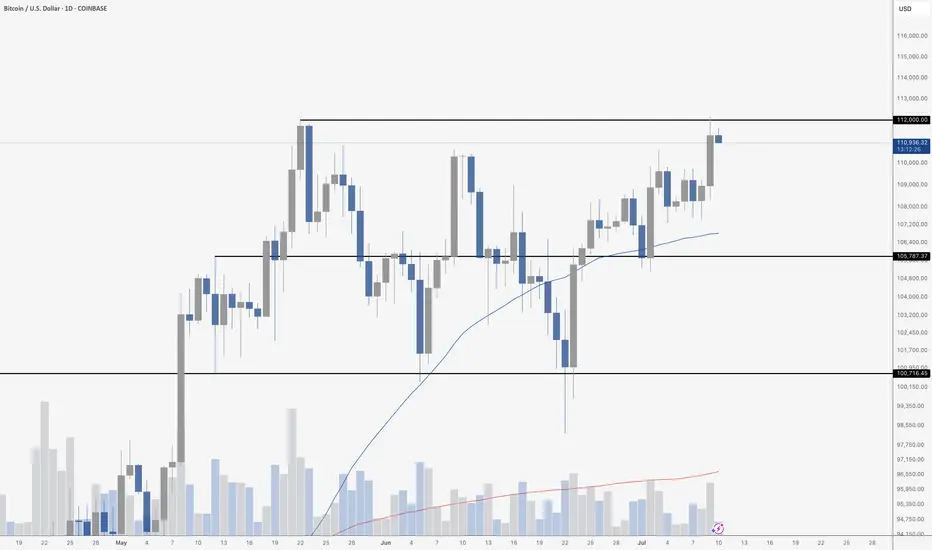
Bitcoin Makes New All Time High - BrieflyBitcoin briefly made a new all-time high yesterday, tagging $112,000 before pulling back slightly. The breakout came after a multi-week consolidation that formed higher lows and built pressure just below resistance. Price is now hovering just under that key $112K level, which has become the short-term line in the sand for bulls. A daily close above would confirm the breakout and likely bring strong continuation, but for now BTC remains in a tight battle between buyers and sellers.
The 50-day moving average continues to trend upward and is providing dynamic support, while the recent surge in volume suggests traders are positioning for a larger move. If price fails to break cleanly above $112K, we could see a short-term retest of the $105,787 area – the previous breakout level – before any further upside. Overall, Bitcoin remains in a strong uptrend, with the path of least resistance clearly higher if bulls can secure a decisive close above all-time highs.
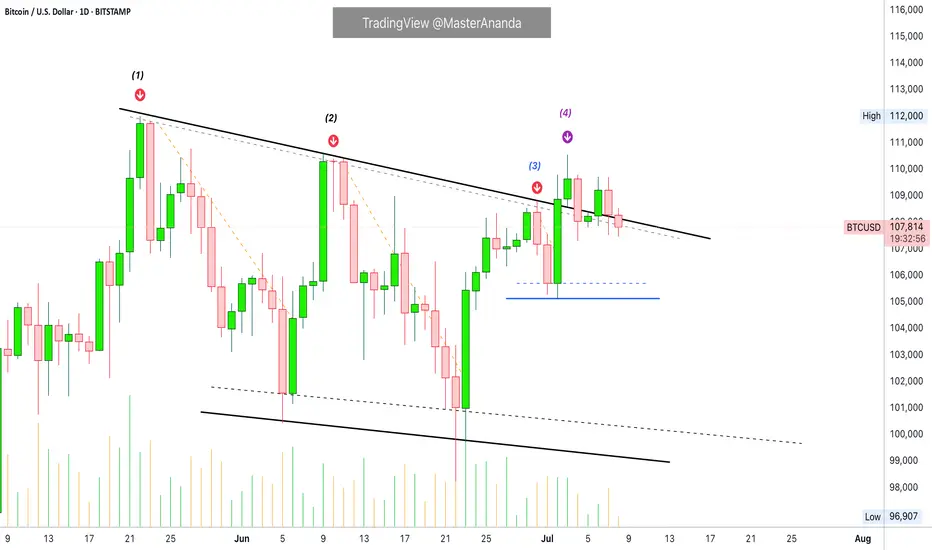
Evolving Price & Candle Patterns: BitcoinLook what is happening here with the candle patterns and price action. In the most recent challenge of resistance something changed. Change is good. It can mean the end of this sideways period.
At (1) Bitcoin finds resistance and immediately starts a decent. The same happens at (2). When we reach (3) everything changes. (1) & (2) produced a low and lower low. The down-move was extended. (3) produced only two red candles, a strong higher low and the third day was a full green candle moving above the descending trendline resistance. The price pattern is now erratic, completely different to previous moves.
Now, consider (4). If the strong green candle was intended as a bull-trap, then we would expect a down-move to follow right after the peak, just as it happened with (1) and (2). But nothing, after (4), Bitcoin has been sideways within the bullish zone.
This change is good, bullish.
A drop can develop anytime but the market already had two changes to produce a down-wave, (3) and (4). The fact that a down-move didn't materialize means that the market has something different in store for us, change. This change is good because when resistance is challenged, prices tend to drop when the market is moving within a range. No drop can signal the end of the range trading which in turn can translate into the start of the next bullish wave.
If this idea turns out to be true, Bitcoin will start growing within days. Growth should be strong because consolidation has been happening for months.
Namaste.
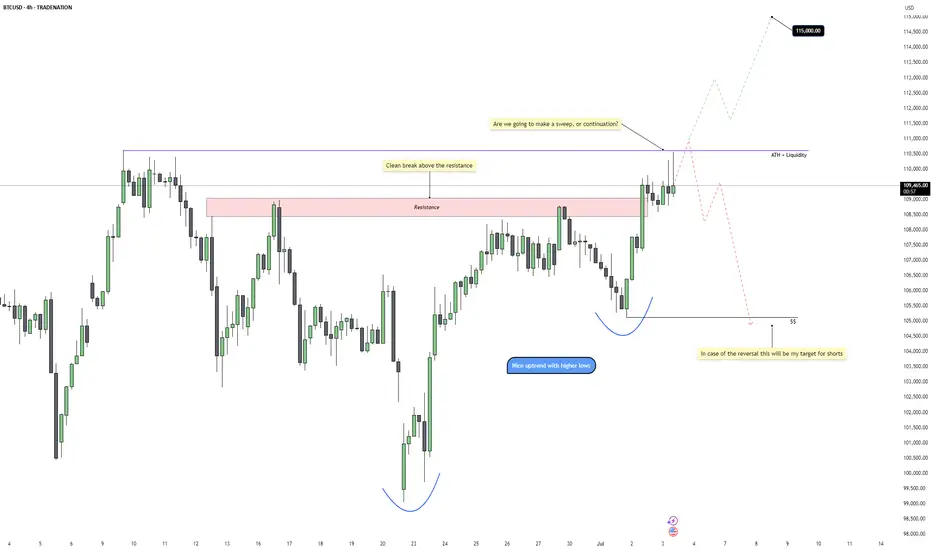
Bitcoin – ATH Sweep or Breakout?Bitcoin is pushing into a critical decision point as it challenges the previous all-time high near 110k. After a strong push out of a rounded bottom formation with clean higher lows, price has now broken above the last visible resistance area and is hovering just under the ATH liquidity. This rally has been aggressive, but the reaction here will determine whether this move becomes an extended breakout or a classic trap.
Liquidity and Key Resistance
The ATH zone around 110k carries a large pool of liquidity, and price is now testing it for the first time since the breakout. We’ve already had a clean break above the prior resistance zone, but we haven’t yet seen a confirmed close above ATH with convincing volume. If price manages to close strongly above this level on the 4H or daily chart, that would be a sign that bulls are in full control. Until then, the possibility of a sweep and rejection remains firmly on the table.
Sweep Scenario and Downside Levels
If we fail to close convincingly above the ATH and instead see a wick through followed by a strong reversal, that would confirm the sweep. In that case, I’d expect short setups to activate quickly, with downside targets sitting around 105k. This level marks the structure support below the most recent breakout, and would be a logical point for price to rebalance before continuing any broader uptrend. A rejection from current levels would also trap late longs and provide fuel for a quick retracement.
Bullish Breakout Scenario
If we do get that proper breakout above 110k, backed by strong volume and continuation candles, the upside opens fast. There’s very little structure above the ATH, so price could move cleanly up into the next round psychological target around 115k. This move would confirm continuation of the higher timeframe trend and offer short-term breakout retests for potential long re-entries.
Volume and Candle Confirmation Are Crucial
At this stage, the setup is binary and all about confirmation. A clean 4H or daily close above ATH with follow-through volume will flip the bias fully bullish. But if we get signs of exhaustion and a failed breakout attempt, the sweep setup becomes highly probable. Waiting for confirmation here is key, rather than trying to front-run the move.
Conclusion
Bitcoin is sitting right at a high-stakes level. We either continue into price discovery toward 115k if momentum follows through, or we see a classic liquidity sweep and rejection back into 105k. The clean structure and recent higher lows support both sides of the argument, but execution will depend on how price reacts around the ATH. Either way, this zone is the key pivot for the next major swing.
Disclosure: I am part of Trade Nation's Influencer program and receive a monthly fee for using their TradingView charts in my analysis.
___________________________________
Thanks for your support!
If you found this idea helpful or learned something new, drop a like 👍 and leave a comment, I’d love to hear your thoughts! 🚀
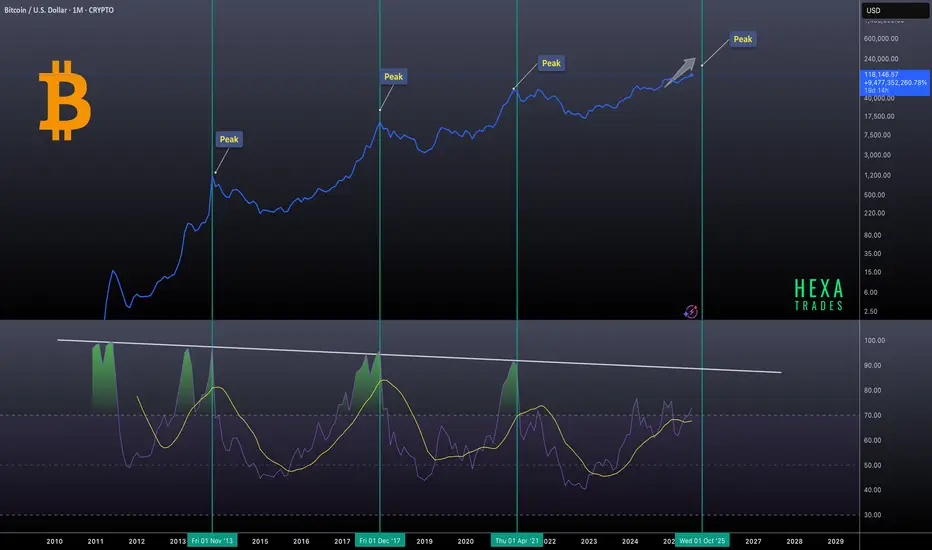
Bitcoin Macro Cycles: Sell Signal at RSI 90Bitcoin’s historical market cycles, using monthly RSI data to identify previous bull market peaks. Notable tops in 2013, 2017, and 2021 are highlighted, with the next potential peak projected around October 2025. A consistent pattern emerges where each market top aligns with the monthly RSI reaching or nearing the 90 level, indicating extremely overbought conditions.
Sell when the monthly RSI hits 90. This has consistently marked previous market tops and can serve as a reliable signal for long-term investors.
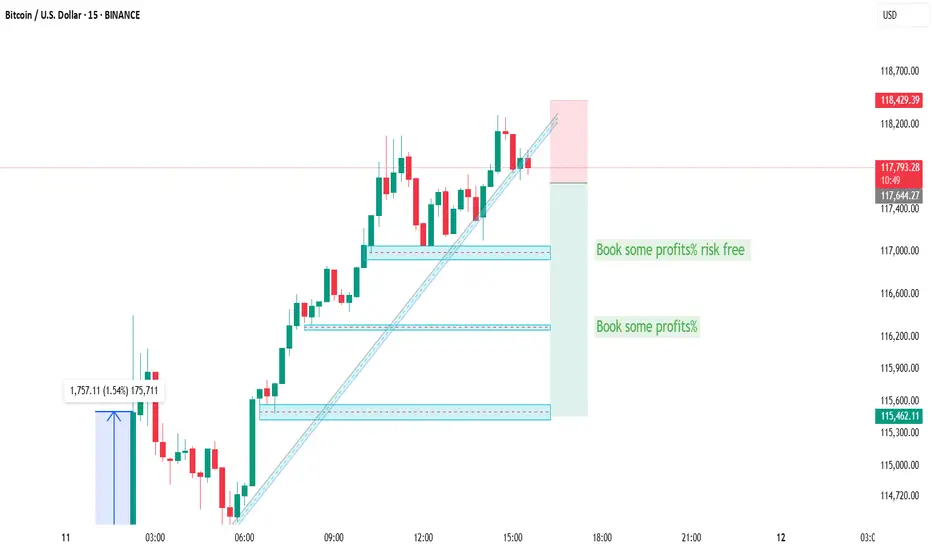
Bitcoin Longer: Clear Blue Skies for Wave 3 of 5As I explained in this video, I believe that we are currently in a wave 3 of 5 for Bitcoin and we should be breaching new highs as we have an undergoing wave 3. However, take note that the risk-reward is not good to go long. So I would recommend holding if you already have a position but to be very cautious if you are thinking of initiating a new long position.
The stop loss is $109,700. The near-term take profit is $113,923 before a potential pull back and then up to $115,000.
Good luck!

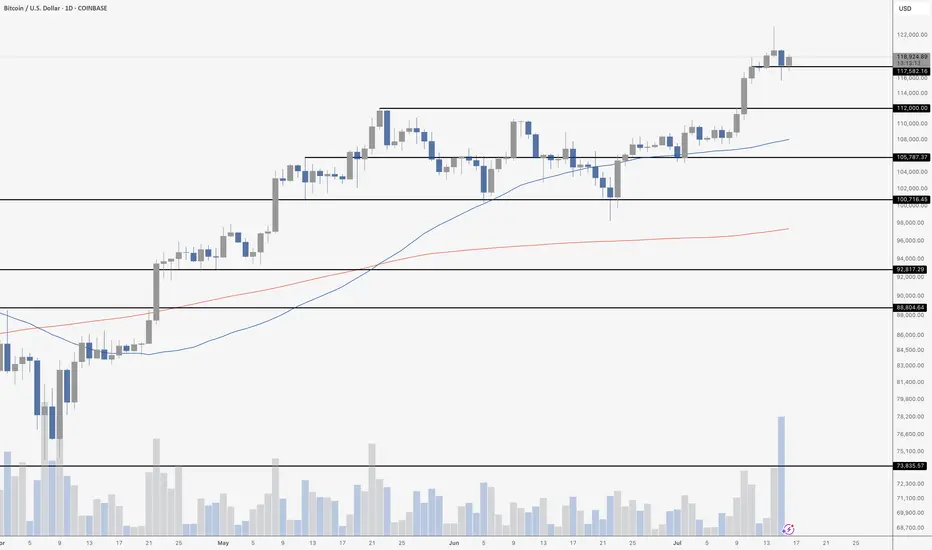
Bitcoin Dips On High VolumeThe Bitcoin daily chart paints a nuanced picture following Tuesday’s pullback – which came on the highest volume day since the $74K bottom in mid‑April, specifically on Coinbase. But notably, that surge in volume was primarily driven by selling, not buying – a key detail that shifts the tone of the candle.
Despite the aggressive downward move, price found support around $116,000 and recovered into the close, finishing the day above $117,000. However, the heavy sell volume behind that move suggests it wasn’t just a casual dip – it was real distribution.
That said, bulls showed resilience on Wednesday, pushing price back toward $119,000 and defending the key $116,000–$118,000 zone. If Bitcoin can maintain this level and digest the selloff without rolling over, it may absorb the supply and build a base for continuation.
But traders should stay cautious – high‑volume sell days near local highs can sometimes mark short‑term tops or signal a shift in momentum. The $112,000 breakout zone remains the critical downside level to watch if the current range fails.
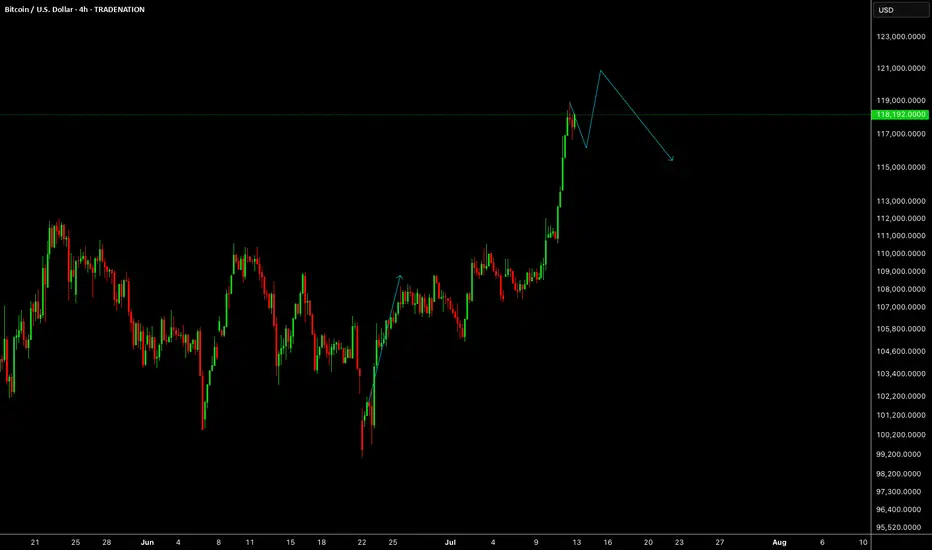
BTCBTC is still bullish, it needs correction and next reaction is above 120K.
Disclosure: We are part of Trade Nation's Influencer program and receive a monthly fee for using their TradingView charts in our analysis.
BTC / ETH / SOL / XRP / HYPE: Potential Trend StructuresIn this video, I share my current daily and weekly analysis on the trend structures of BTC, ETH, SOL, XRP, and HYPE, highlighting key support and resistance zones to watch in the coming sessions.
Charts featured in the video:
BTC
ETH
SOL
XRP
HYPE
Thank you for your attention and I wish you successful trading decisions!
If you’d like to hear my take on any other coin you’re tracking feel free to ask in the comments (just don’t forget to boost the idea first 😉).

SELL BTCUSD for bullish divergence trend reversal STOP LOSS: 120SELL BTCUSD for bullish divergence trend reversal STOP LOSS: 120,246
Regular Bearish Divergence
In case of Regular Bearish Divergence:
* The Indicator shows Lower Highs
* Actual Market Price shows Higher Highs
We can see a strong divergence on the MACD already and There is a strong trend reversal on the daily time frame chart.....
The daily time frame is showing strength of trend reversal from this level resistance so we are looking for the trend reversal and correction push from here .....
TAKE PROFIT: take profit will be when the trend comes to an end, feel from to send me a direct DM if you have any question about take profit or anything
Remember to risk only what you are comfortable with........trading with the trend, patient and good risk management is the key to success here...
BTCUSD Short Plan from ATH
EVE STAR CANDEL
Manage your risk!!!
SL TP EP all in chart You can try for longer targets!!!!!!
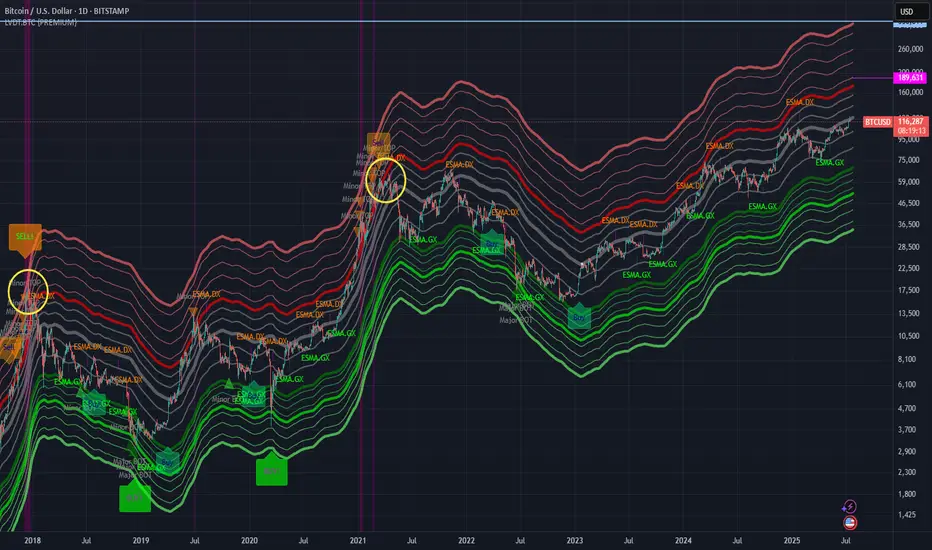
$300k+: LVDT estimated BTC ATH target this cycle.According to my old LVDT indicator, BTC should reach $300k or even higher at ATH this cycle.
The real parabolic (banana zone) run will only start when BTC touches the thick red line again.
Time to gradually DCA sell every time BTC pierces significantly above the thick red line (signaling a potential point of Blow-off-Top).
I plan to be updating this tread from time to time as the chart progresses until the absolute "Sell" signal is triggered.
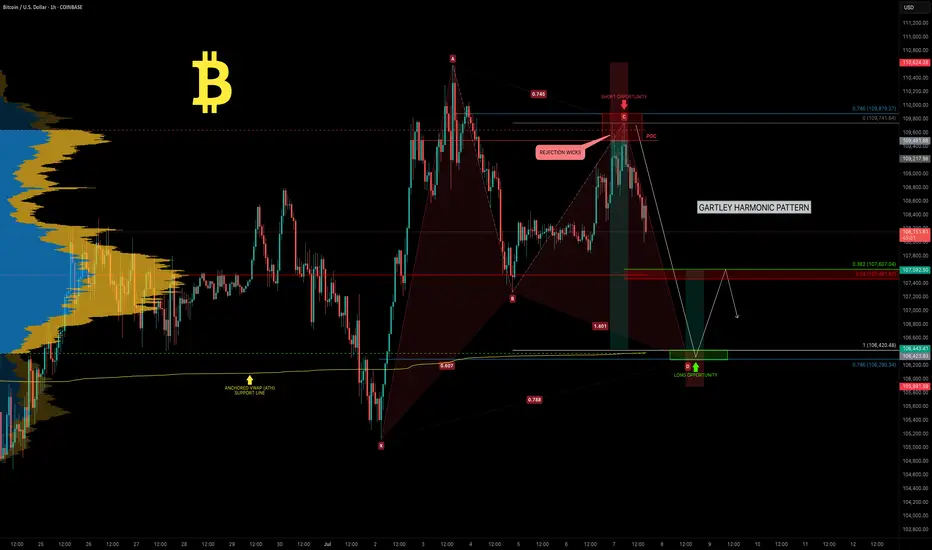
BTC — Weekend Pump Fades.. All Eyes on the Gartley Reversal ZoneBitcoin has been consolidating in a tight range between $110K and $105K over the past two weeks. This weekend’s attempted breakout stalled out quickly! BTC was rejected at the Point of Control (POC) of the previous range and came close to the 0.786 retracement of the recent drop.
🧠 Reminder: Weekend pumps are notorious for being unreliable, especially without strong volume.
Now, the charts point toward something much more structured — a potential Gartley harmonic pattern forming, with multiple levels of confluence suggesting the next key decision zone is just around the corner.
🧩 Gartley Completion Zone: $106,290–$106,400
This price zone is loaded with confluence:
✅ 0.786 Fib retracement of the XA leg sits at $106,290
✅ 1.0 trend-based Fib extension of the BC leg is at $106,370
✅ Anchored VWAP from all-time high aligns precisely at $106,370
✅ VAL (Value Area Low) sits at the same level
✅ Imbalance (Fair Value Gap) from earlier price inefficiency lies in this exact region
All of this stacks up into a high-probability reaction zone.
🎓 Educational Insight: How to Trade a Gartley Harmonic
The Gartley pattern is one of the most powerful harmonic setups — a structured form of retracement and extension that captures exhaustion before reversals. Here's how it works:
🔹 XA: Impulse leg
🔹 AB: Retracement of 61.8% of XA
🔹 BC: Retraces 38.2%–88.6% of AB
🔹 CD: Extends to 78.6% retracement of XA and aligns with a 1.0–1.272 Fib extension of BC
🟢 Point D is the entry zone — your reversal opportunity.
📉 Stop-loss sits just below invalidation (Point X).
💰 Targets usually lie at 0.382 and 0.618 of the CD leg.
🔎 Why It Works: It traps late traders and captures price exhaustion at natural Fibonacci ratios. Combined with other tools — like VWAP, liquidity zones, and order flow — it becomes a high-conviction strategy. These patterns are most effective on higher timeframes like 4H or daily.
_________________________________
💬 If you found this helpful, drop a like and comment!
Want breakdowns of other charts? Leave your requests below.
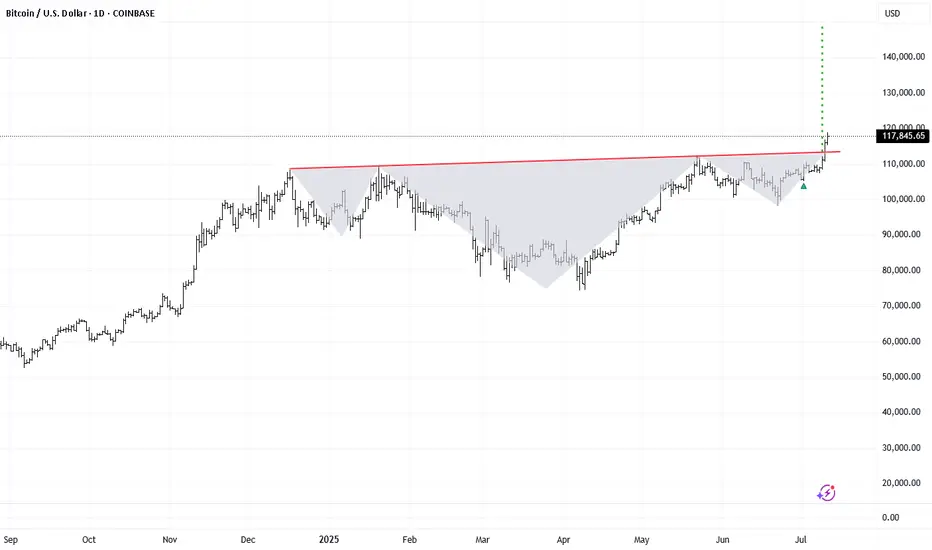
Bitcoin -> The bullrun is not over!📣Bitcoin ( CRYPTO:BTCUSD ) is still totally bullish:
🔎Analysis summary:
A couple of months ago Bitcoin broke above the previous all time high. This was basically just the expected creation of new highs, perfectly following the underlying cycles. With respect to the long term rising channel formation, this bullrun on Bitcoin is just starting.
📝Levels to watch:
$100.000
🙏🏻#LONGTERMVISION
Philip - Swing Trader

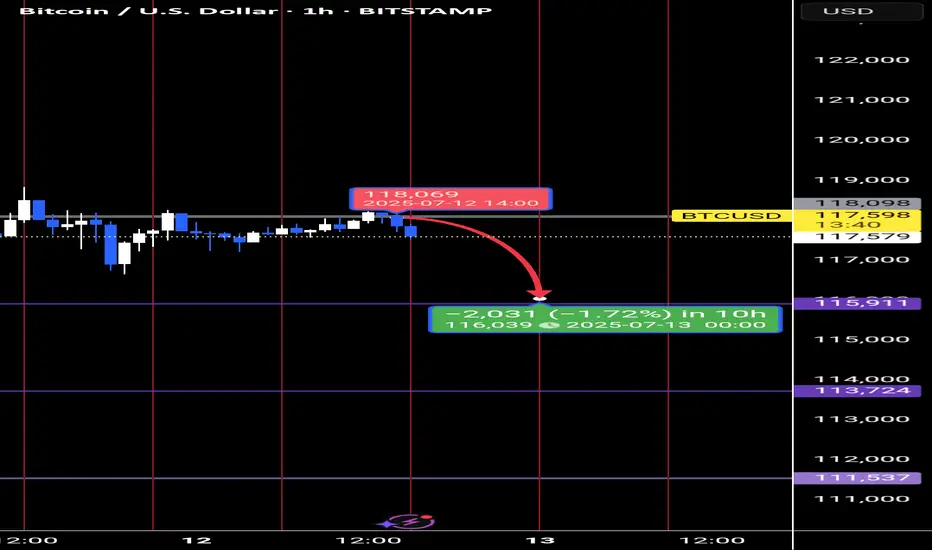
bitcoin will go down for the next 8hrs After sweep the liquidity above 118098. the price goes down for the correction . I expect it will reach the one hr order block at 115911.
Entry : 118098- 117500
St : 118200
tp: 116000
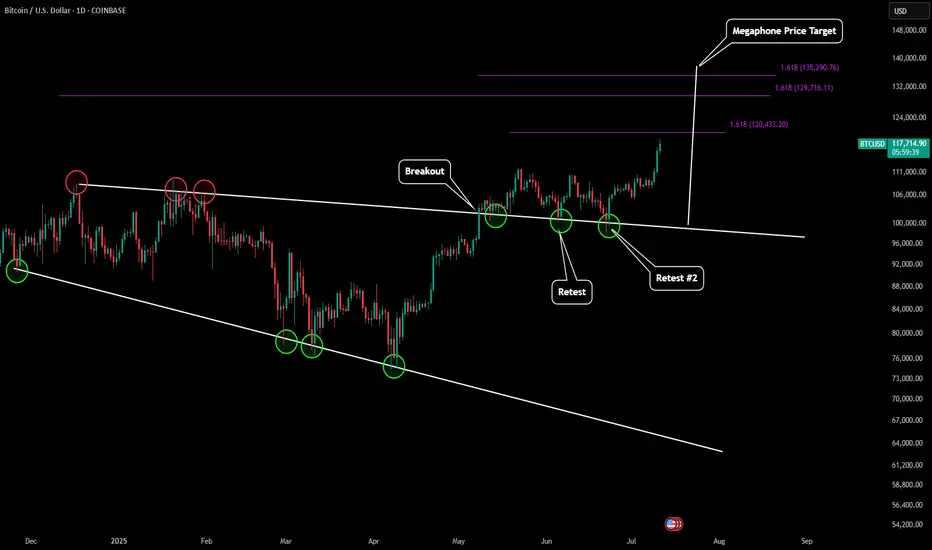
BTC - Next ATH Upside Price Targets After outlining the last low for BTC (which can be found here):
Now BTC is skyrocketing to new all time highs. Based on predictive Fibonacci modeling and also our price target of our macro megaphone pattern we can estimate where BTC's next top might be.
Our first target is just slightly above $120k. This would be our extension target of our most recent LFT trend.
If we take a look back at our last mid-macro trend it would give us an extension target slightly below $130k.
Our final target would be $135-136k which would be from our last high to our last low of our mid-macro trend. This is also in alignment with the full measured move of our megaphone pattern.
As more candle structure form around these levels we will update this prediction with even more precise targets. Happy All Time High everyone!
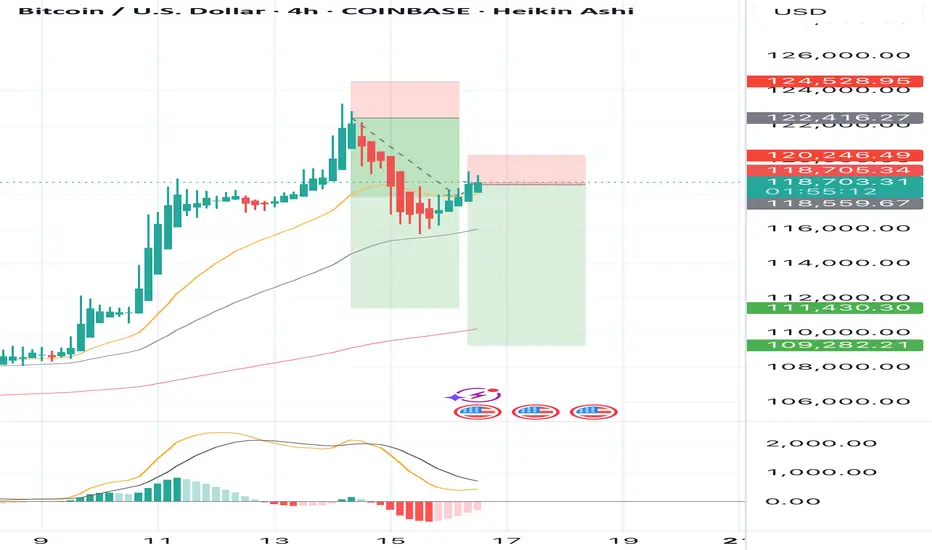
BTCUSD - Exhausted? Second time rejected, now down.BTCUSD got rejected at the Centerline the second time. This is super bearish. If it's closing below yesterdays low, that's a clear short signal to me.
Taking 50% gains off the table is never bad. Because then you still have 50% if it's going up further. Otherwise, you got 50% booked.
Don't let gree eat your brain §8-)
