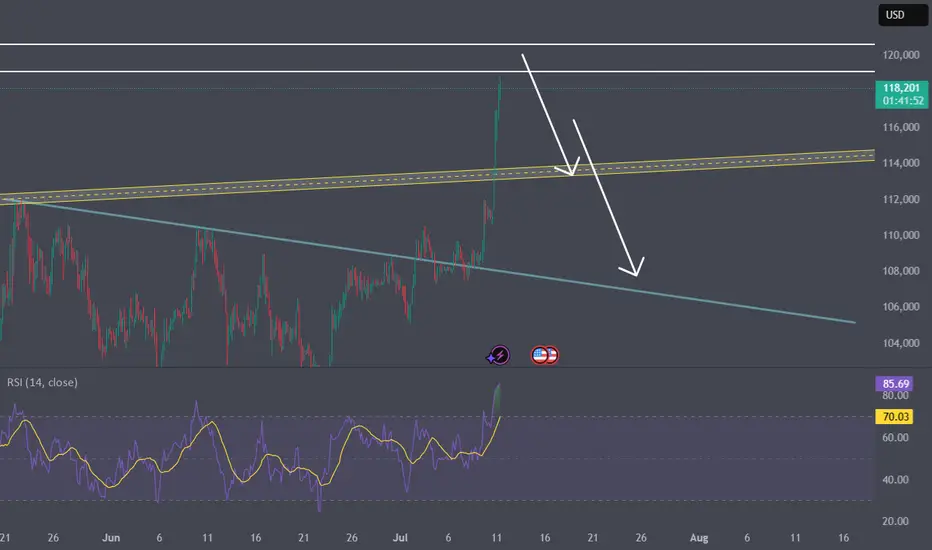
$BTC Rejection at 119K | Eyes on 112K Retest as RSI Cools DownBitcoin faces strong rejection near the $119K resistance zone, showing signs of a cooling market as the RSI exits the overbought territory. Historically, BTC tends to revisit key structural levels after such overheated moves. A favorable re-test zone lies between $114K and $112K, with $112K aligning closely with the previous all-time high — a psychologically significant support area.
Support levels to watch: $112K (favorable retest) and $110K (strong base).
As RSI continues to cool, keep an eye on bullish reactions around these levels for potential entries.
BITCOIN trade ideas
Bitcoin Price Prediction and TimelineThe Chart clearly shows everything. 100 days remain until the top. about 240000-260000
Bitcoin Hits First Target: What I Traded and What Comes NextBitcoin just hit my first target. I went long on BTC, XRP, Chainlink, and more. Booked profits and jumped into two new breakouts with better risk-reward. In this video, I break down my trades, the setup, and why I’m still bullish between 116K and 120K. I also explain how crypto deregulation and the Genius Act could fuel the next move.
Let me know in the comments how you traded this breakout.
This content is not directed to residents of the EU or UK. Any opinions, news, research, analyses, prices or other information contained on this website is provided as general market commentary and does not constitute investment advice. ThinkMarkets will not accept liability for any loss or damage including, without limitation, to any loss of profit which may arise directly or indirectly from use of or reliance on such information.

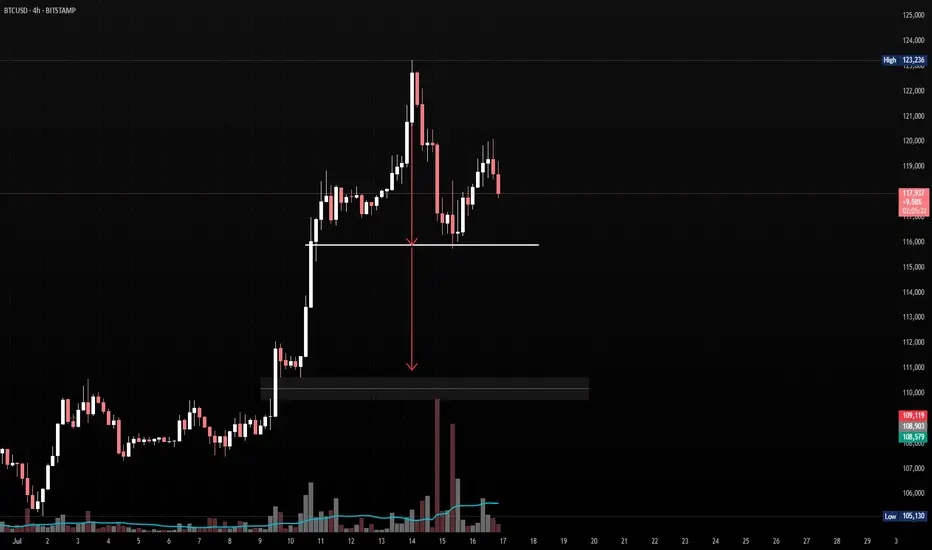
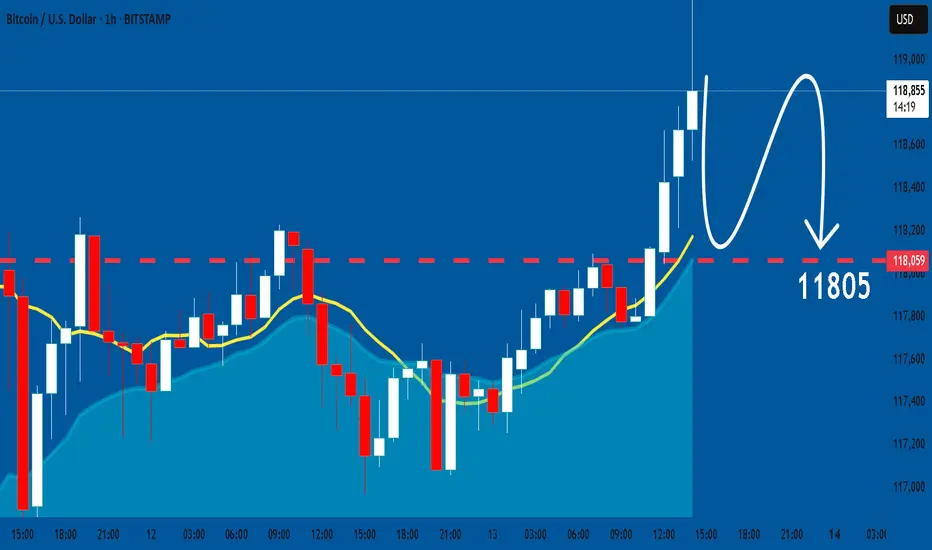
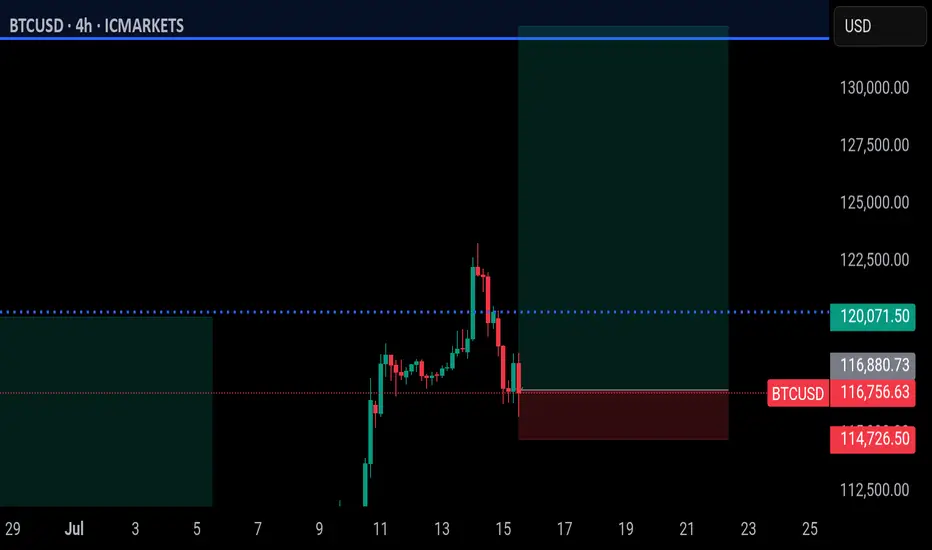
BTCUSD – Potential Head & Shoulders Forming⚠️If and only if the price break below $115,000
⚠️ BTCUSD – Potential Head & Shoulders Forming
Pair: BTC/USD
Timeframe: 4H
Pattern in Focus: Head and Shoulders
Key Neckline: ~$115,000
Confirmation Trigger: Only valid if price breaks below the neckline zone with strong volume
🧠 Idea Summary:
Bitcoin has formed what appears to be a classic head and shoulders pattern. The right shoulder is completing, and the neckline is clearly respected. A break below $115K could confirm this bearish setup, with a measured move pointing toward the demand zone between $108K–$109K.
📌 Watch for:
Volume spike on breakdown
Retest of neckline turning into resistance
Potential long setups only if price reclaims $119K+
Bias: Bearish if $115K breaks. Neutral until then.
Bitcoin / U.S. Dollar 4-Hour Chart (July 2025)4-hour price movement of Bitcoin (BTC) against the U.S. Dollar (USD). The price has risen from 118,714.64 to 118,714.64 (+937.9 or +0.80%) over the period. Key levels include a support zone around 115,451.45 to 117,451.45 and a resistance zone near 120,000.00 to 122,188.85,
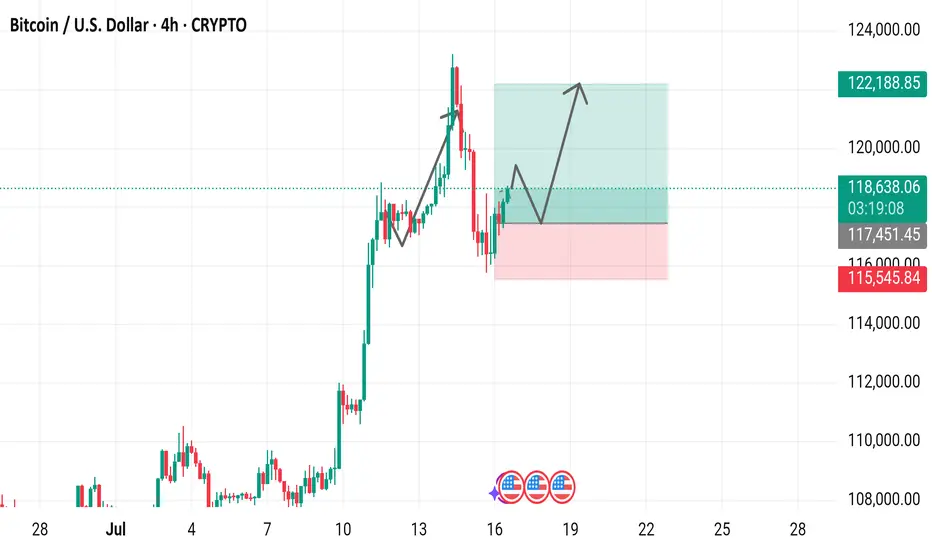
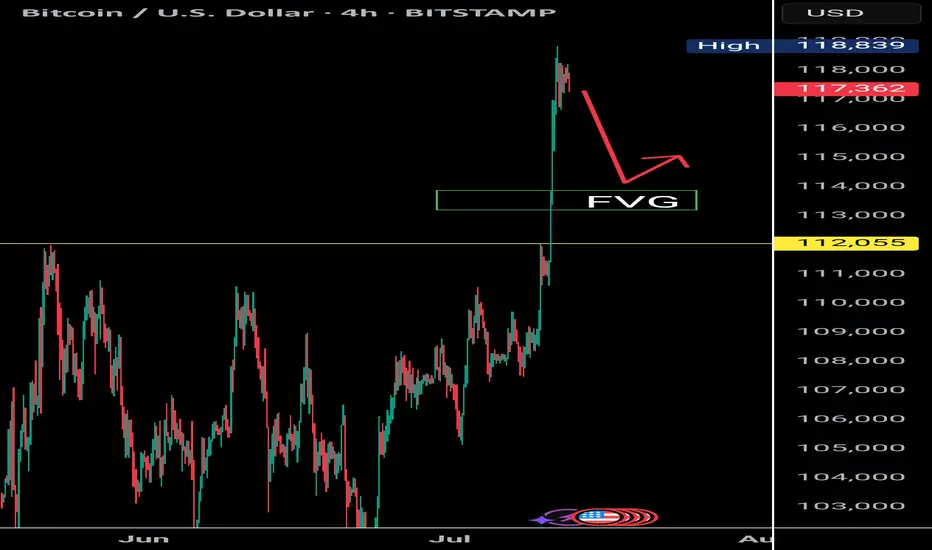
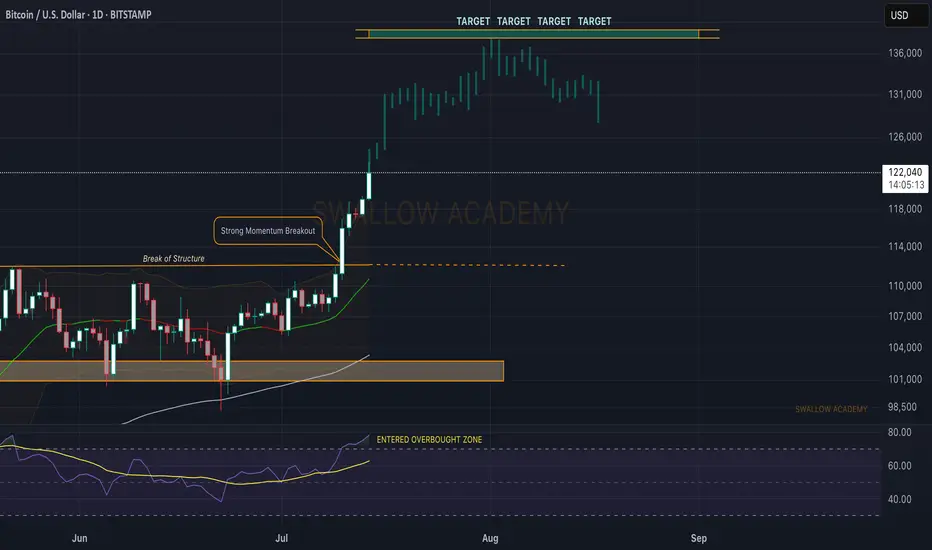
Bitcoin (BTC): Targeting $140K | Our ATH for This Bullish Cycle$120K was broken too easily, and we are now setting our new ATH to $140K, which will be our last target and local top before entering into a bearish market.
Now, as we recently had a strong break of structure that was not retested properly (meaning buyers have not secured this area), combined with the RSI being in the overbought zone, we might see some pullback happening anytime from here so keep an eye out for it.
About RSI, our yellow line is still in the neutral area, and we see the demand and buyside volume growing, so we are going to look for that line to also enter into overbought zones before looking for potential selloffs.
Swallow Academy
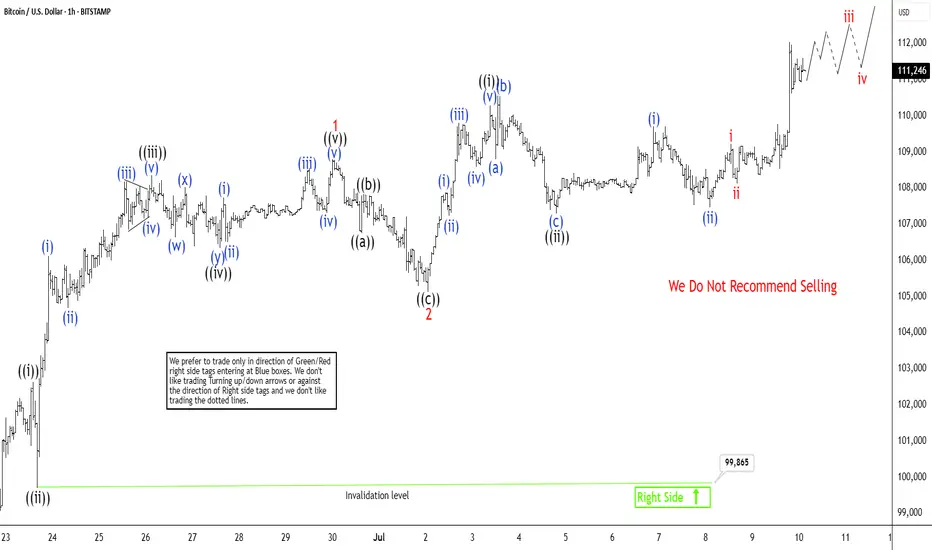
Bitcoin (BTCUSD) Breaking to New All Time HighBitcoin (BTCUSD) has recently achieved a new all-time high, signaling the onset of the next upward phase in its price trajectory. From the significant low recorded on June 22, 2025, at $98,240, Bitcoin has exhibited a robust five-wave advance, reinforcing the bullish outlook. This rally aligns with a classic five-wave impulse structure per Elliott Wave theory, a framework often used to forecast market trends. Starting from the June 22 low, wave ((i)) peaked at $102,647. It was then followed by a corrective pullback in wave ((ii)) to $99,865. The cryptocurrency then surged in wave ((iii)) to $108,358. Wave ((iv)) concluded at $106,351 after a brief dip. The final leg, wave ((v)), culminated at $108,800, completing wave 1 of a higher-degree impulse.
Subsequently, Bitcoin experienced a wave 2 correction, retreating to $105,130. From this level, it has begun nesting higher in wave 3. This is a phase often associated with strong momentum. Within this structure, wave ((i)) reached $110,292. Wave ((ii)) pullback followed to $107,303, forming an expanded flat pattern. Further subdividing, wave (i) peaked at $109,717, with wave (ii) dips concluding at $107,471. In the near term, as long as the pivotal low at $99,865 remains intact, any pullbacks are likely to attract buyers in a 3, 7, or 11-swing sequence, supporting further upside. This technical setup suggests Bitcoin’s bullish momentum is far from exhausted, with higher levels anticipated as the wave structure continues to unfold.
BTC Live: Resistance 111592/ Breakout soon or 109440 first?In this short video breakdown, we reviewed some key structural levels. We've identified a resistance at 111.592, which is critical for near-term price action. However, zooming out to the bigger picture, the major resistance to watch sits at 114.921 — this is a level we’ve respected many times before and could act as the next big test if momentum continues upward.
On the support side, we've previously leaned on 109.079, and we're now observing strong confluence zones thanks to our Fibonacci pull — notably around 110.505, lining up with the 0.61 and 0.5 retracement levels.
What we’re seeing is an ascending channel in play. If we break and hold above 111.592, that opens the door to challenge the 114.900 level. Until then, price might need to consolidate or retest some of these key supports.
Always worth checking past ideas to see how significant some of these zones have been historically. This wasn’t a fakeout — just part of the bigger structure.
Are you watching the same levels? Let me know your setups — it's always great to see different perspectives in the community.
One Love,
The FXPROFESSOR 💙
Disclosure: I am happy to be part of the Trade Nation's Influencer program and receive a monthly fee for using their TradingView charts in my analysis. Awesome broker, where the trader really comes first! 🌟🤝📈

BTCUSD: Bearish Continuation
The charts are full of distraction, disturbance and are a graveyard of fear and greed which shall not cloud our judgement on the current state of affairs in the BTCUSD pair price action which suggests a high likelihood of a coming move down.
Disclosure: I am part of Trade Nation's Influencer program and receive a monthly fee for using their TradingView charts in my analysis.
❤️ Please, support our work with like & comment! ❤️
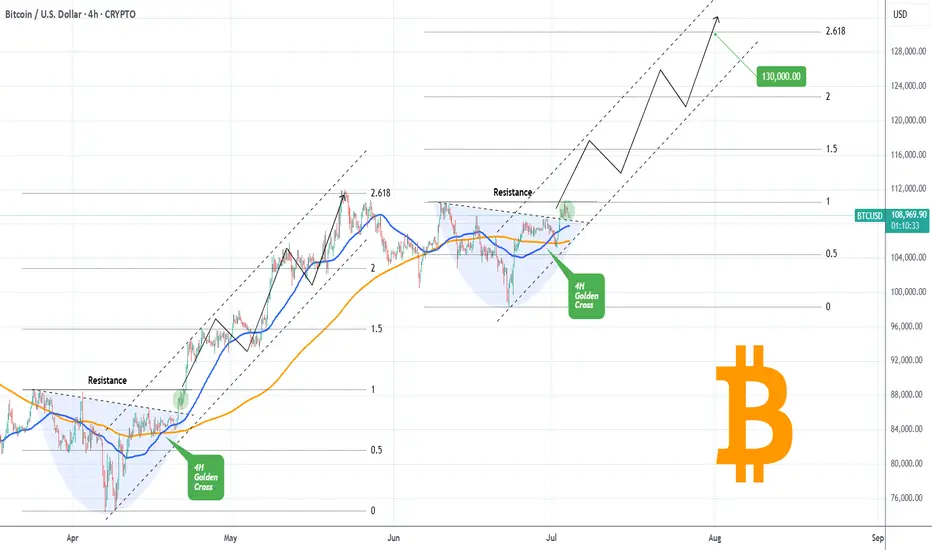
BITCOIN Golden Cross going to slingshot it to $130kBitcoin (BTCUSD) has completed a Golden Cross on the 4H time-frame and is attempting to keep the 4H MA50 (blue trend-line) as Support. If successful, it has high probabilities of staging a Channel Up similar to April - May, which peaked on the 2.618 Fibonacci extension.
So far, the bases of those to fractals are virtually identical, with a Lower Highs trend-line initially acting as a Resistance, which broke and on the current one it is testing the final Resistance (dotted trend-line).
This is the green circle, which on April 21 staged a quick consolidation before breaking aggressively upwards. If the pattern continues to repeat itself, we can get $130k (Fib 2.618 ext) at the end of the Channel Up.
Do you think it will? Feel free to let us know in the comments section below!
-------------------------------------------------------------------------------
** Please LIKE 👍, FOLLOW ✅, SHARE 🙌 and COMMENT ✍ if you enjoy this idea! Also share your ideas and charts in the comments section below! This is best way to keep it relevant, support us, keep the content here free and allow the idea to reach as many people as possible. **
-------------------------------------------------------------------------------
💸💸💸💸💸💸
👇 👇 👇 👇 👇 👇
Are you falling for 141k?The bull run on BTCUSD was not sudden, it corrected properly making a flat from 98K and breaking out the structure. this upward impulse looks too sharp to peirce 120-122k range its 1.618 fib extension of the broken structure.
Be cautious with the sell though, any rejection followed by a bear flag could be a great short with Stop above the top.
Good luck.
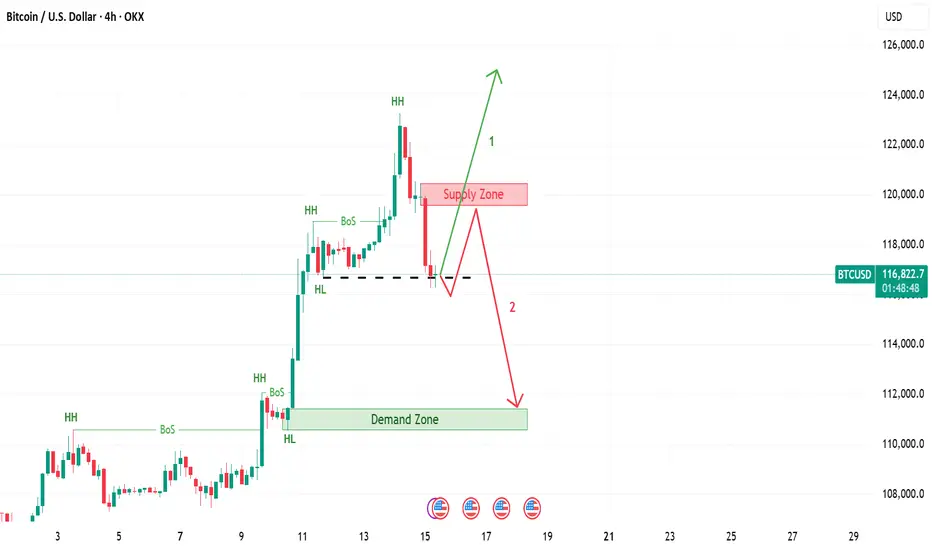
Bitcoin | 2 Scenarios If the 4 hour candle closes below last HL, then expect price return to supply zone and then go down till demand zone. If not, expect continuation of the upward trend, when 4 hour candle breaks last HH.
Which scenario you expect?
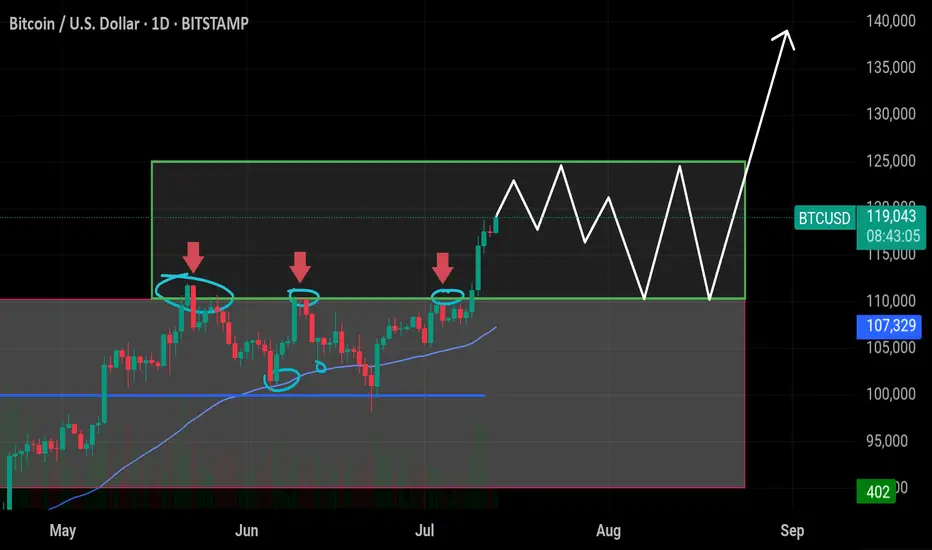
$BTC Ready to Explode – Targeting $125K+ Soon! Bitcoin has finaCRYPTOCAP:BTC Ready to Explode – Targeting $125K+ Soon!
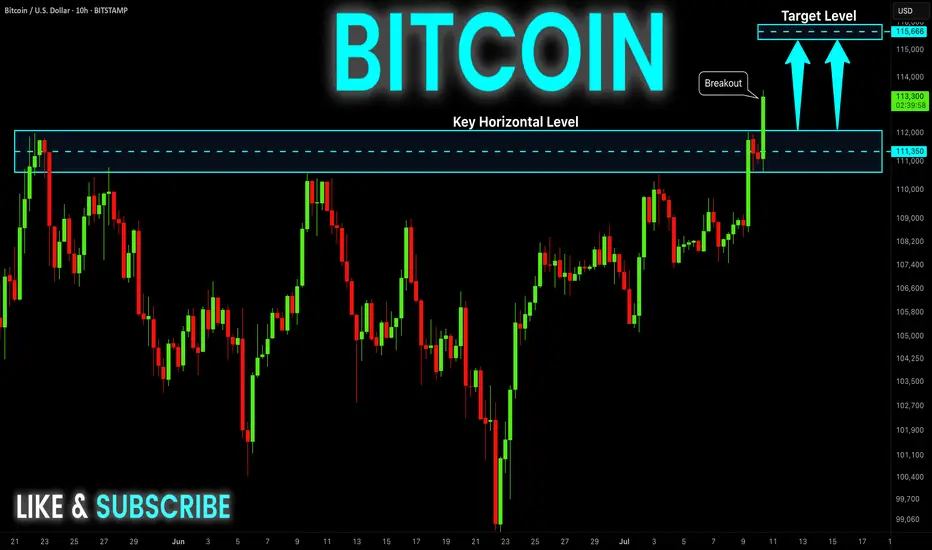
Bitcoin has finally broken out of the previous resistance range (~$110K–$111K), where it was rejected multiple times in June. Now it's consolidating in a tight box, setting up for a big move.
🔸 Support $110k–$113k
This area was previous resistance and is now acting as strong support. Holding above this confirms bullish strength.
🔸 Upside Target: $125k
If BTC holds within the current range and breaks above, the next leg could push price toward $125K. A clean breakout could even extend toward $140K.
🔸 Short-Term Take Profits:
✅ TP1: $120,000
✅ TP2: $122,000
✅ TP3: $125,000
🔸 Risk Level at $110,000:
Break below this level would invalidate the bullish setup and increase downside risk.
BTC CUP and HANDLE?BTC made triple top not it is making cup and handle pattern. If it successfully brakes the handle it might reach to 120-122K

July 10 Bitcoin Bybit chart analysisHello
It's a Bitcoin Guide.
If you "follow"
You can receive real-time movement paths and comment notifications on major sections.
If my analysis was helpful,
Please click the booster button at the bottom.
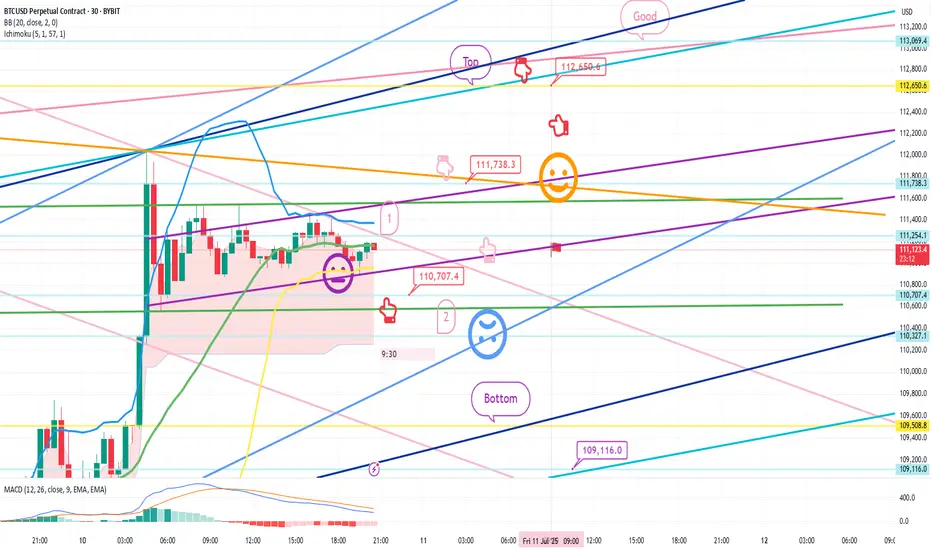
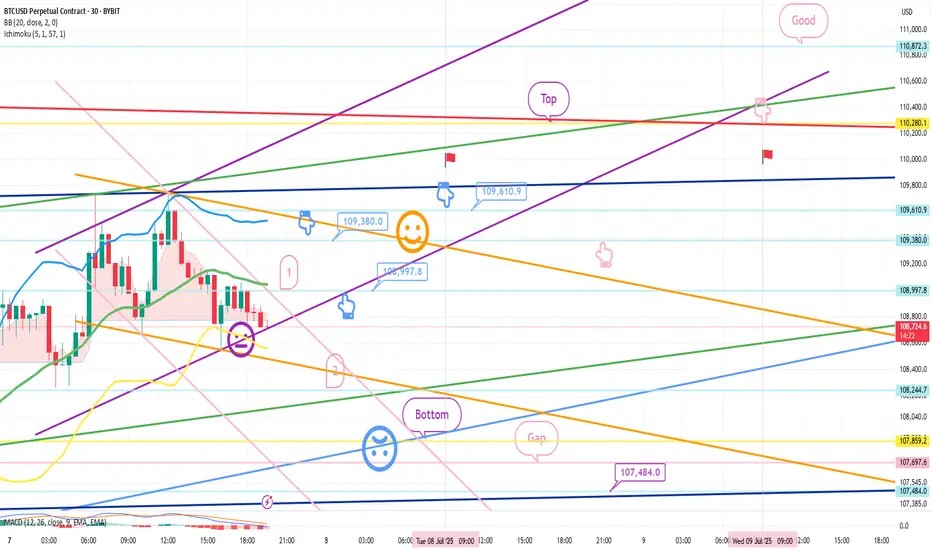
Here is the Bitcoin 30-minute chart.
There will be a Nasdaq indicator announcement at 9:30 in a little while.
There is a high possibility that Nasdaq will shake up and down significantly,
but Bitcoin still looks safe in terms of signal and pattern.
In the analysis article on July 7,
I connected the strategy as it was at the last long position entry point of 107,484 dollars.
*When the red finger moves,
it is a one-way long position strategy.
1. 110,707.4 dollars long position entry point / stop loss price when the sky blue support line breaks
2. 111,783.3 dollars long position 1st target -> Top 2nd -> Good 3rd target price
The 1st section at the top is today's best short position entry point,
and the 2nd section at the bottom is a sideways market.
In the middle, with a pink finger,
I left a re-entry position after liquidating a long position, so
I think it would be good to use it.
From the breakout of the sky blue support line, it can be pushed to Bottom -> 109,116 dollars.
The report is not yet renewed,
but from now on, it will be very important, right?
This week, it seems like it will continue to shake up and down,
so I hope you operate safely with principle trading and stop loss prices.
Thank you.
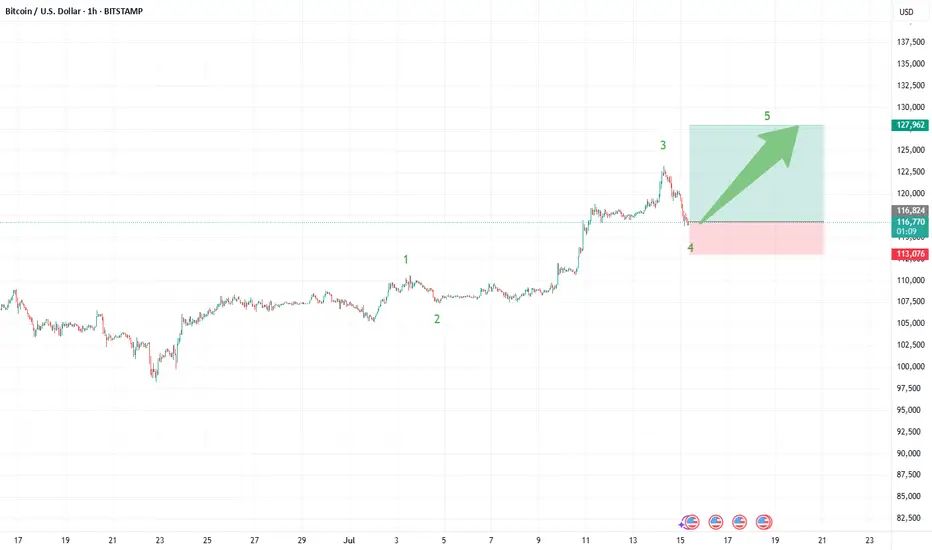
Bitcoin (BTCUSDT): Trade Wave 5—Next Stop $127,000?Bitcoin’s current structure is lining up for a classic Elliott Wave fifth wave scenario, and the setup could offer a high-reward trade as we look for a measured push toward the $127,000 area. Here’s what’s standing out in the recent price action:
What the Current Structure Shows (Primary Scenario)
Wave 4 Correction Complete: After peaking in wave iii near $124,000, BTC pulled back and has potentially completed a wave iv correction. Price respected the Fibonacci retracement zones bouncing near the 38.2% retracement at $117,116.
Preparing for Wave 5: With support confirmed, price action is stabilizing and looks primed for a final motive push—wave 5—to the upside. The target projection for wave 5 is around $127,000, in line with both the 61.8% extension of the previous swing and the common equality projection for wave 5 vs. wave 1 when wave 3 is extended.
Why the Count Is Labeled This Way
The advance from early July kicked off with impulsive movement, subdividing cleanly into smaller waves that align with classic Elliott structure.
Wave iii is the clear standout—steep, extended, and carrying most of the move’s energy, which checks the box for a strong third wave.
The cluster of Fibonacci and previous resistance/support near $127,000 offers strong technical confluence for the next objective.
Trade Setup: Riding Wave 5 to $127,000
Entry Zone: Consider longs on breakouts above the current consolidation, ideally after confirmation of support holding near $117,100–$116,000.
Stop Loss: Place stops just below $113,300 (the 61.8% retracement), or tighter for risk management depending on your position size and timeframe.
Target: $127,000—where wave 5 projects to equal the length of wave 1 and aligns with multiple Fibonacci targets.
What to Watch Next (Confirmation or Invalidation)
Confirmation: An impulsive move above the interim high at $120,000–$121,000 with strong volume would confirm wave 5 is underway and that bulls have regained control.
Invalidation: A break below $110,500 would invalidate this setup and suggest a more complex correction is taking shape.
Final Steps: Monitor for impulsive character in the rally—wave 5s can sometimes truncate, so don’t get complacent at resistance.
Alternate Count
If price fails to hold support and breaks down, BTC could still be in an extended or complex fourth-wave correction—possibly a running flat or triangle—before wave 5 eventually resumes.
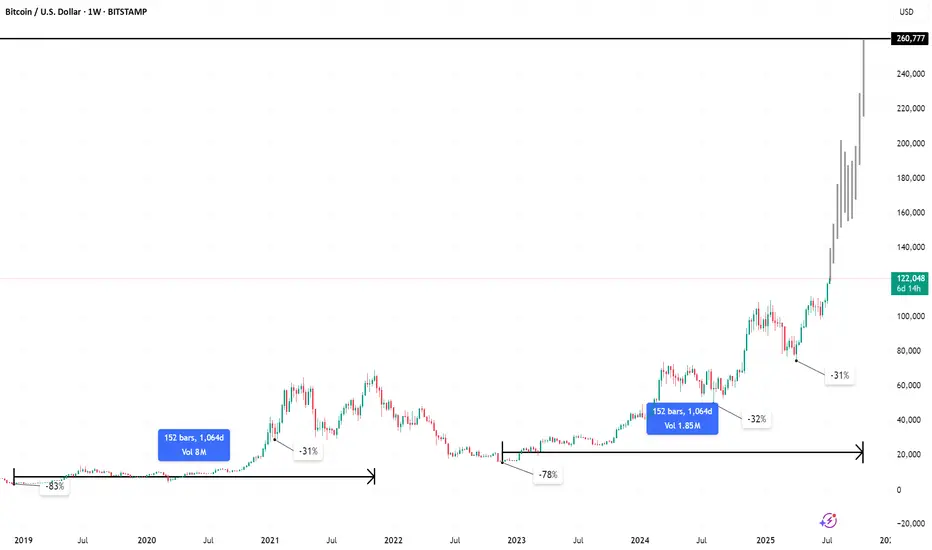
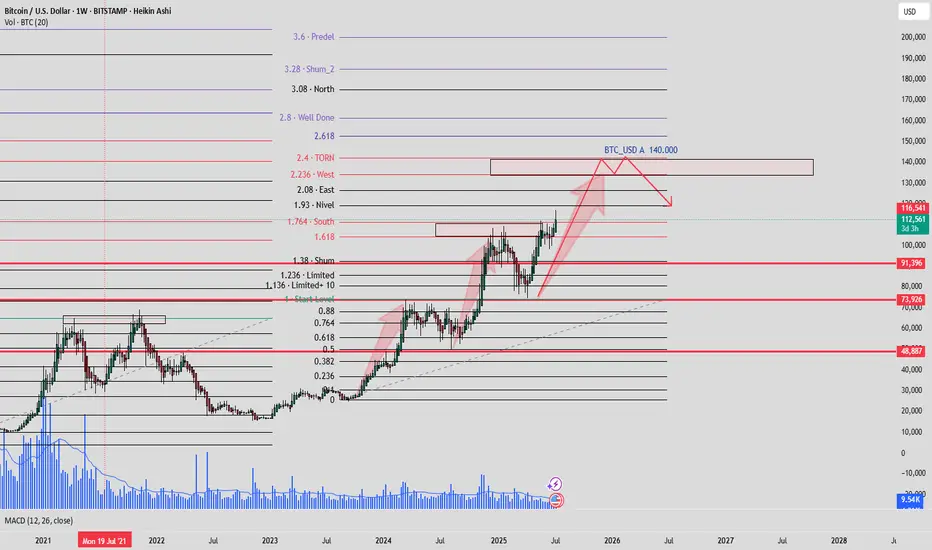
#BTC ALMAZOV PROJECTION#BTCUSD ALMAZOV PROJECTION WEEKLY
Price projection according to Almazov's theory, Bitcoin should at least touch $140,000, before pulling back or continuing to go long if its dimensionality decreases.
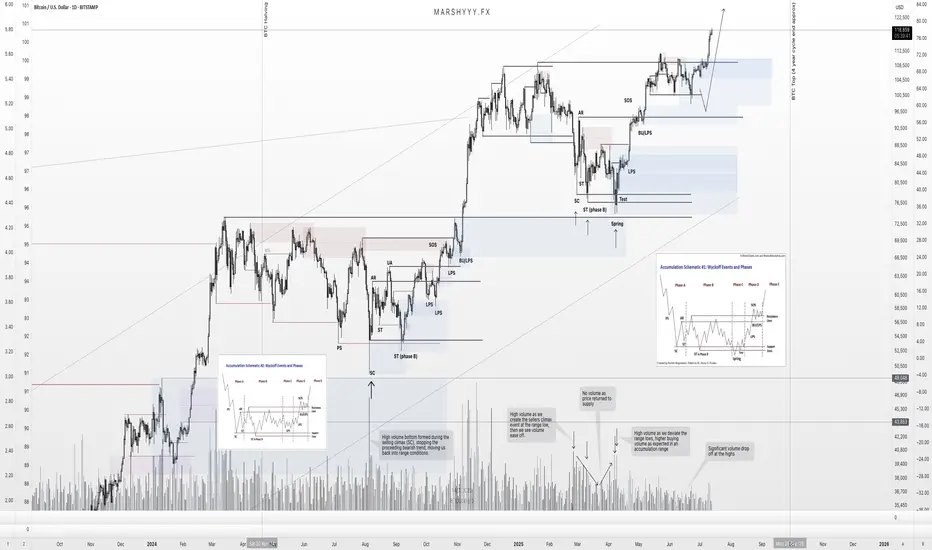
BTC – Textbook Pullback. New ATHs. What’s Next?Back in mid-June, I published a BTC update calling for a local correction into HTF demand while most were screaming bear market and waiting for deeper breakdowns.
Price action played out exactly as forecasted.
BTC swept the $100k swing low, front-ran my first demand zone by $400, and launched into a powerful reversal — just like it did back in April, where it also front-ran the key HTF demand before rallying.
That move took us straight into new all-time highs (ATHs) — now trading comfortably around $118k.
🧠 What Happened?
✅ Liquidity sweep of the prior low
✅ Front-run demand zone (perfect HTF structure)
✅ Strong bullish reaction and higher high
✅ Confluence from USDT.D rejection at 5.25%
✅ Alts showing signs of strength as BTC rallies
The entire setup aligned perfectly across BTC, USDT.D, TOTAL, and OTHERS.D — all of which I’ve been tracking in tandem.
🔮 What Now?
With BTC now in price discovery, I expect continuation higher — but not without the possibility of a short-term pullback.
📉 A potential retest of the $108k zone isn’t off the table. This level aligns with:
- Prior breakout structure
- Range high retest
- Local demand before continuation
But even if we go straight up — I remain HTF bullish into the final phase of this cycle, supported by:
- USDT.D structure still bearish
- BTC.D showing signs of distribution
- ETH.D and OTHERS.D gaining momentum
- Altseason rotation already starting to pick up
🧭 The Macro Outlook
The 4-year cycle projection still points to a Q3 2025 top — likely between August late and September based on historical cycle timing, but this could deviate.
That gives us a window of 2–3 months for this final leg to unfold — and it’s already in motion.
Stay focused. Stick to your plan. Ride the trend, don’t chase it.
Let me know what levels you're watching next, and whether you think we get that $108k retest — or we go vertical from here.
1D:
3D:
4D:
1W:
1M:
— Marshy 🔥
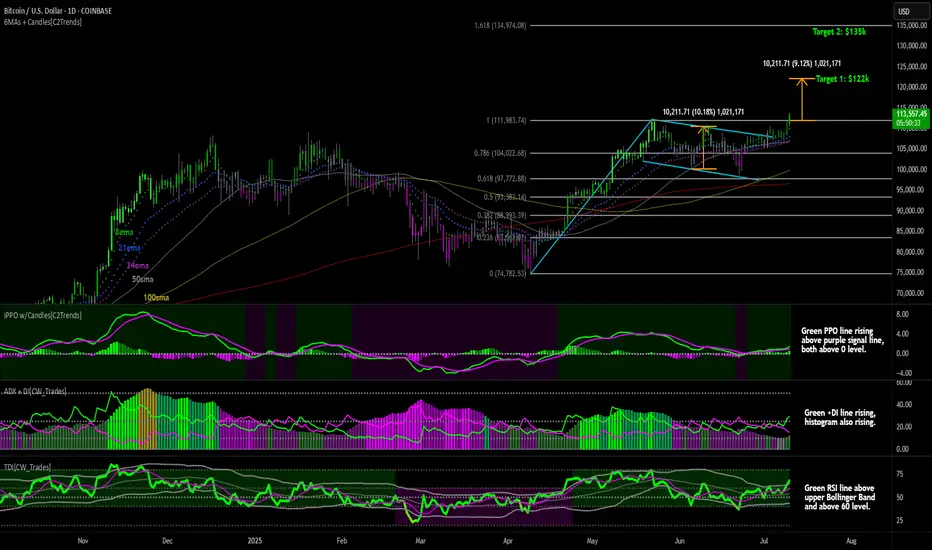
Bitcoin New All-Time HighNew all-time high for Bitcoin above $113k and is now in uncharted territory.
First price target I'm watching from here is $122k which is based on the range that we saw price make in the blue flag pattern that formed during the consolidation phase. I took the price difference between the high and low in the flag and projected it out from the previous resistance level at $112k which gives a target of $122k. Second price level I'm watching is $135k which is the 1.61 fibonacci extension level based on the April low to the recent resistance level at $112k made in May.
Lower price indicators are now all bullish:
The PPO indicator show the green PPO line rising above a rising purple signal line, with both lines having held above the 0 level during consolidation. This indicates intermediate to longterm bullish price momentum.
ADX indicator shows the green +DI line rising above a declining purple -DI line and the histogram bars are rising. This indicates increasing bull trend strength.
The TDI indicators shows the green RSI line above the upper Bollinger Band, and above the horizontal 60 level and is showing bullish trend strength.
New all-time highs generally attract more buyers looking to ride the strength.
Giddy Up.
July 7 Bitcoin Bybit chart analysisHello
This is Bitcoin Guide.
If you "follow"
You can receive real-time movement paths and comment notifications on major sections.
If my analysis was helpful,
Please click the booster button at the bottom.
Here is the Bitcoin 30-minute chart.
There is no separate Nasdaq indicator announcement today.
I think the Nasdaq lower gap section retracement will be the focus.
Recently, sideways movement or adjustments have been coming out before the trend,
So I proceeded safely in preparation for variables.
*When the blue finger moves
Bidirectional neutral
Short->long switching or 2nd section long waiting strategy
1. $109,380 short position entry section / cut-off price when orange resistance line is broken
2. $108,997.8 long position switching / cut-off price when purple support line is broken
3. $109,610.9 long position 1st target -> Top 2nd target -> Good 3rd target
It seems important whether the purple support line is broken from the current position. If the first section at the top touches 108,997.8 dollars and comes down,
it may become a vertical decline section.
If it comes down right away, it is a long-waiting strategy in the final second section,
and if it deviates from the bottom section today
(6+12 pattern)
because it is a full candle when the gap section is touched,
it may fall to 107,484 dollars indicated at the very bottom.
I have important work to do tomorrow,
so I will take a day off and come back on Wednesday.
Please use my analysis so far for reference and
I hope you operate safely with principle trading and stop loss prices.
Thank you.
Final BTC target still remain above 130kBTC still has some push to do to reach my final target, 130k - 145k region. If you look at my BTC chart from January, that region has been highlighted. Till then, I'm still bullish. Now DXY is trying to turn bullish too, which will mean bearish BTC but it is that is s lagging indicator. It won't happen immediately, maybe next 2 or 3 months. Be prepared, for now, we still go up. Enjoyyy
Follow me as my trades are market order so you'll see the trades on time anand enter on time
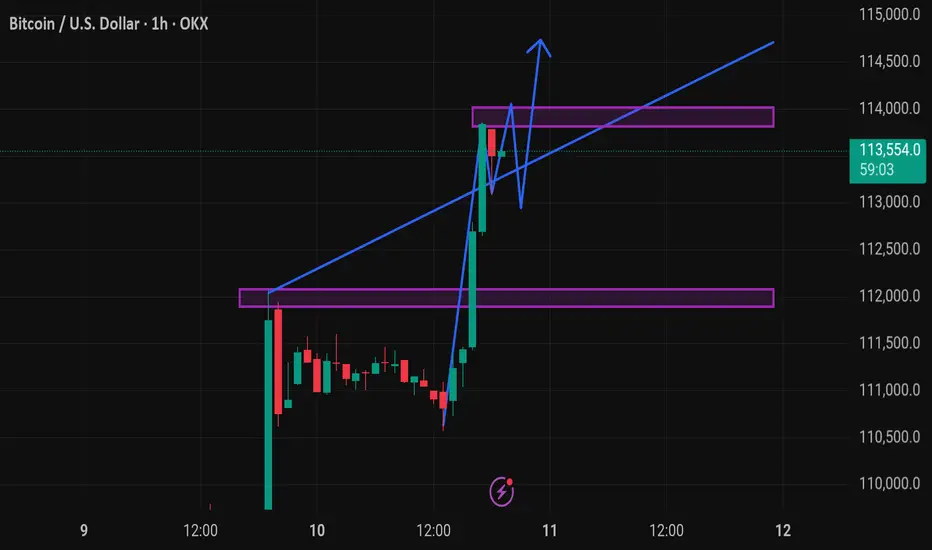
Btcusd techinical analysis.This chart represents the Bitcoin (BTC) / USD price action on a 1-hour timeframe, with technical analysis indicators suggesting a bullish outlook.
Key Elements in the Chart:
1. Current Price:
BTC is trading at $113,506.5, up +1.98% on the 1-hour chart.
2. Support and Resistance Zones:
Support Zone (purple box around ~$112,000): Recently tested and held, now acting as a potential base.
Resistance Zone (purple box around ~$113,800 to ~$114,000): Price is currently consolidating just below this zone.
3. Trendline:
A rising blue trendline is acting as dynamic support, showing upward momentum.
4. Projected Price Action (Blue Arrow Path):
The blue path suggests a potential bullish breakout from the resistance zone.
Implies consolidation, retest of support/trendline, and continuation upward—a common bullish flag or pennant pattern.
---
Interpretation:
The chart setup is bullish, expecting:
Retest of support near $113,200–$113,400
Break above the $114,000 resistance
Potential rally continuation beyond $114,000 (toward $115,000 or more)
Caution:
If BTC fails to hold the trendline or drops below the support zone (~$112,000), this bullish setup may be invalidated.
Would you like a trading strategy (e.g., entry/exit levels or risk management) based on this setup?
BITCOIN Epic Breakout! Buy!
Hello,Traders!
BITCOIN is trading in an
Uptrend and the coin made
An epic bullish breakout
Of an ATH level of 112k$
Which reinforces our bullish
Bias and we will be expecting
A further bullish move up
Buy!
Comment and subscribe to help us grow!
Check out other forecasts below too!
Disclosure: I am part of Trade Nation's Influencer program and receive a monthly fee for using their TradingView charts in my analysis.