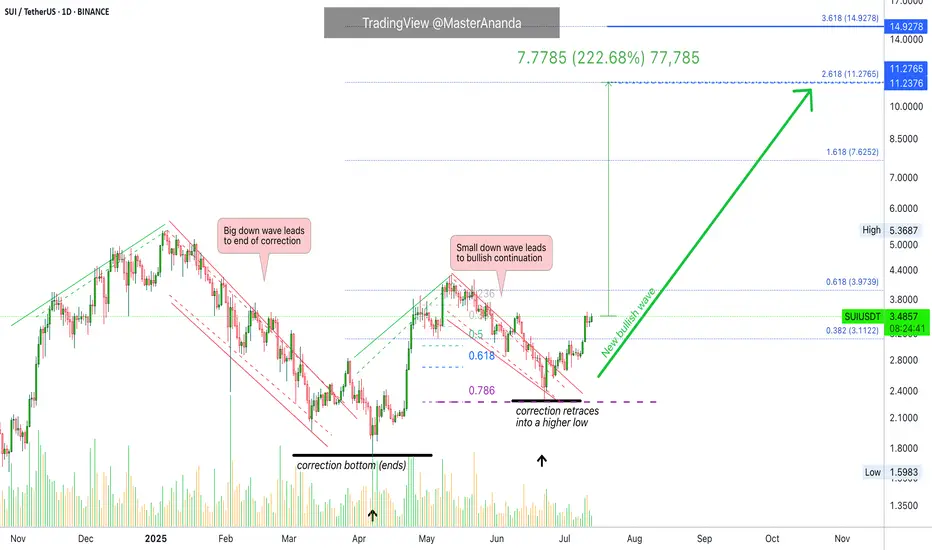
Sui Update · Clearly Moving Towards $7.62, $11.3 & $15The SUIUSDT chart looks great and just today we are witnessing a bullish continuation. Resistance was found 11-July but the market didn't produce any significant retrace. This is obviously because we are ultra-bullish and ultra-bullish can only mean sustained growth.
After the 11-July resistance, o
Related pairs
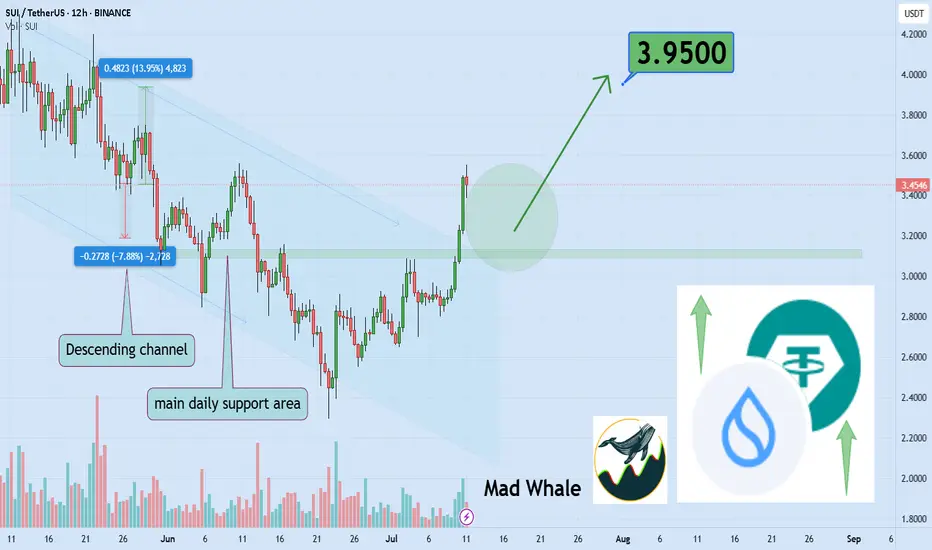
Is SUI ready to surge 13% toward $3.95 target?Hello✌
let’s dive into a full analysis of the upcoming price potential for SUI 📈.
BINANCE:SUIUSDT has broken out of its descending channel with notable volume, indicating a potential shift in momentum. Price action is currently holding near a key support area, which could act as a solid base fo
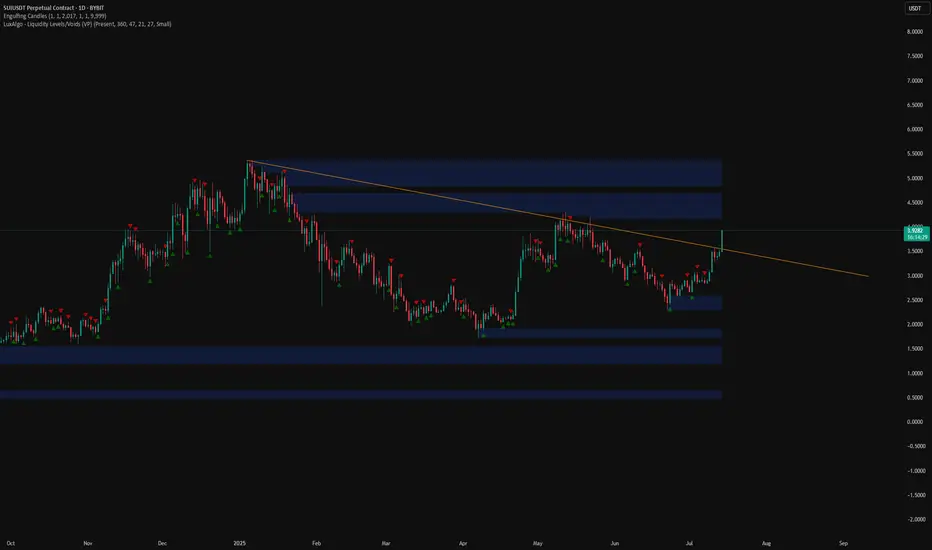
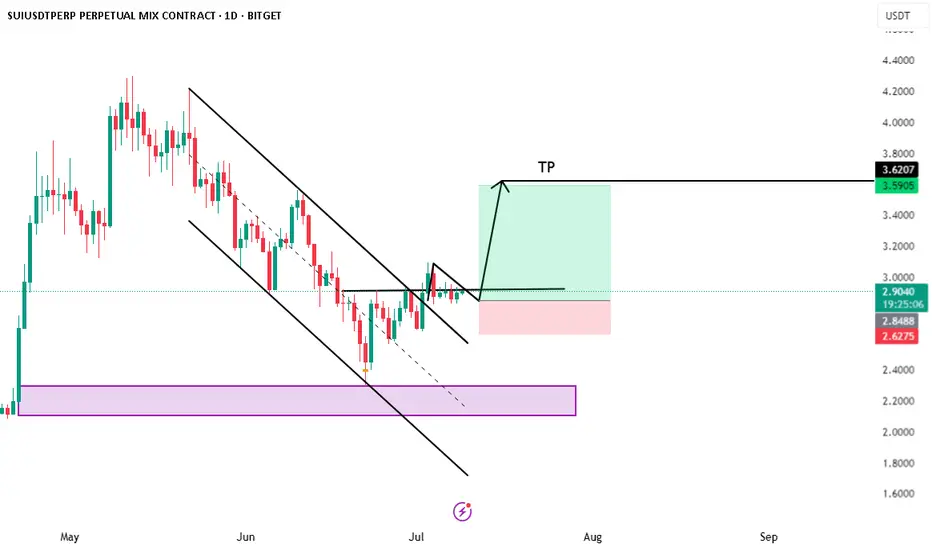
SUIUSDT Long IdeaDescending trendline of lower highs has been breached
Should expect rejection at $4 area and a slight pullback to 0.382 fib level around $3.35
Resistance at $4 area should be closely monitored and if breached, wait for retest and confirmation in order to set up long position.
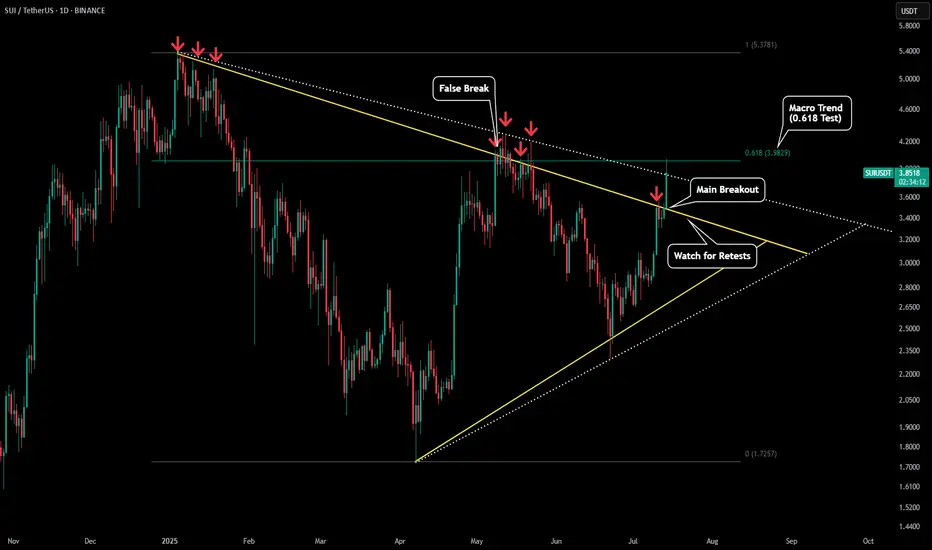
SUI - Daily Chart PerpectiveThis chart is in expansion to our previous post:
What we can see is SUI has clearly broken out of its symmetrical triangle (yellow trendlines). This is the first good sign for potential new highs for SUI.
However since the 4H chart could be spelling out a short term drop lets see where price cou
SUI SELL SETUP , Sold From $3.95SUI SELL SETUP
Currently $3.95
Sold From $3.95
(Trading plan If SUI go up to $4.10
will add more shorts)
Expecting target $3.85 OR DOWN
In the event of an early exit,
this analysis will be updated.
Its not a Financial advice

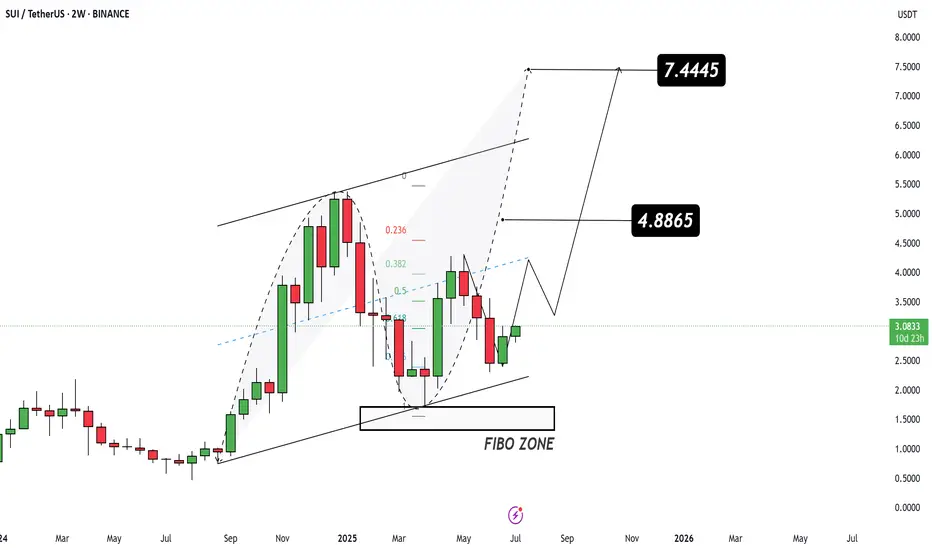
$SUI/USDT Technical Analysis
Major Bounce from FIBO ZONE 📈
SUI has just bounced off the golden Fibonacci retracement zone (0.618–0.786), confirming it as strong dynamic support. This move comes after a healthy correction from previous highs.
📍 Current Price: $3.0816
🎯 Target 1: $4.8865
🎯 Target 2: $7.4445
🛡 Invalidation L
SUI - SUI SUI in your ears!Hellooo so SUII moves are marked till the blue line - as stated but beyond it if it goes just in case, you know the path
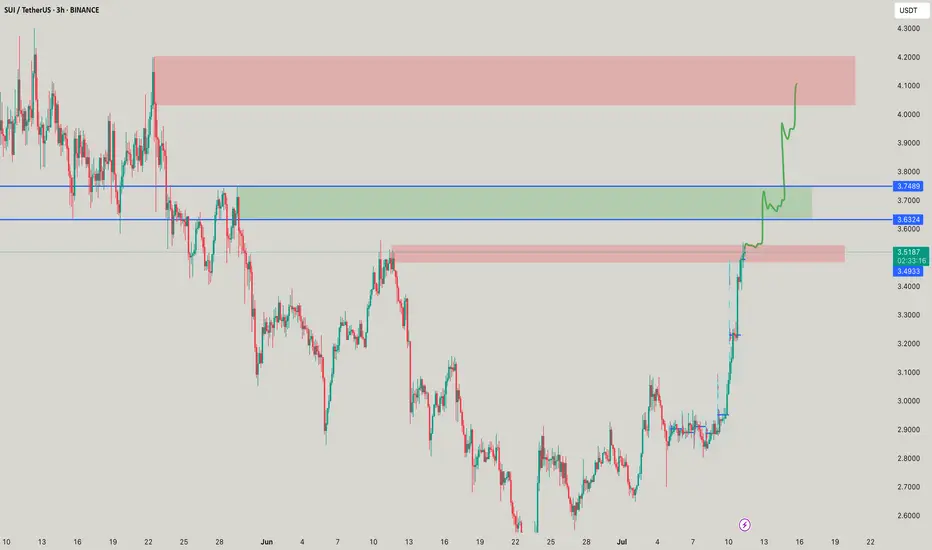
$SUI Swing Trade Setup – Breakout Confirmation & R/R Plan📌 Analysis Summary:
SUI has broken out of a strong falling channel structure that started in late May.
We’re now seeing a bullish breakout + retest, suggesting a potential trend reversal from bearish to bullish.
A small consolidation zone near the breakout confirms strength, supported by buyer pres
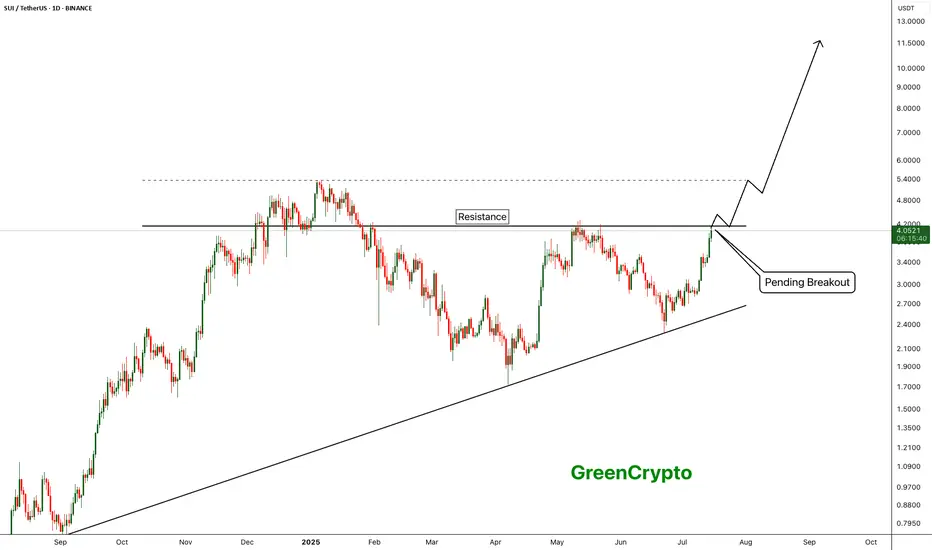
SUI - Breakout of the year- SUI is currently trading near the resistance line. Price was reject around this resistance line in the previous pump.
- Given the current bullish market, price is expected to breakout from this resistance easily
Entry Price: 4.04
StopLoss: 3.2
TP1: 4.5059
TP2: 5.3810
TP3: 6.5106
TP4: 7.8772
TP5
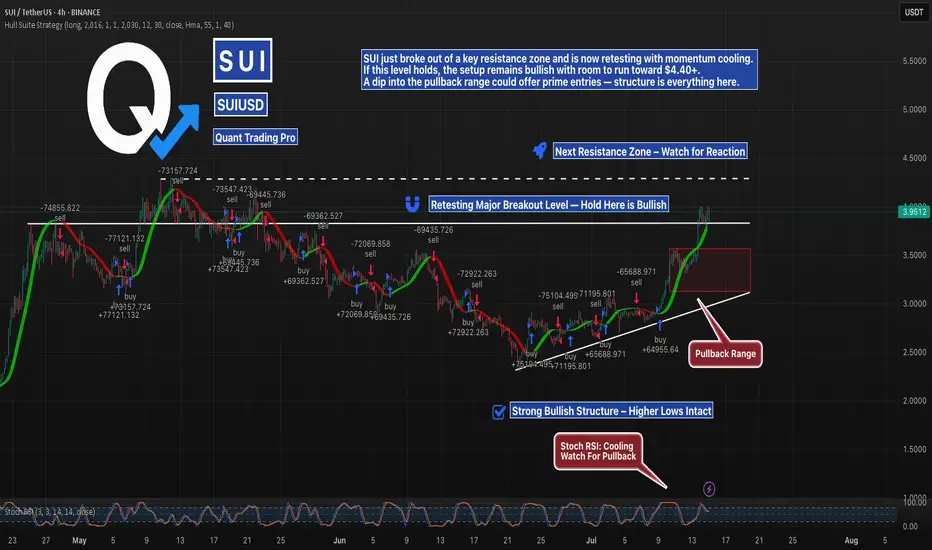
SUI Breakout Retest in Progress — Bulls Have the BallSUI has finally broken above major horizontal resistance and is now retesting that level, backed by a rising trendline of higher lows. With Stoch RSI cooling and the price sitting just above a prior range, this is the key decision zone.
If bulls defend the breakout, continuation toward $4.40+ is li
See all ideas
Summarizing what the indicators are suggesting.
Oscillators
Neutral
SellBuy
Strong sellStrong buy
Strong sellSellNeutralBuyStrong buy
Oscillators
Neutral
SellBuy
Strong sellStrong buy
Strong sellSellNeutralBuyStrong buy
Summary
Neutral
SellBuy
Strong sellStrong buy
Strong sellSellNeutralBuyStrong buy
Summary
Neutral
SellBuy
Strong sellStrong buy
Strong sellSellNeutralBuyStrong buy
Summary
Neutral
SellBuy
Strong sellStrong buy
Strong sellSellNeutralBuyStrong buy
Moving Averages
Neutral
SellBuy
Strong sellStrong buy
Strong sellSellNeutralBuyStrong buy
Moving Averages
Neutral
SellBuy
Strong sellStrong buy
Strong sellSellNeutralBuyStrong buy
Displays a symbol's price movements over previous years to identify recurring trends.
Frequently Asked Questions
The current price of SUI / UST (SUI) is 4.04400000 USDT — it has fallen −2.37% in the past 24 hours. Try placing this info into the context by checking out what coins are also gaining and losing at the moment and seeing SUI price chart.
SUI / UST price has risen by 38.14% over the last week, its month performance shows a 32.77% increase, and as for the last year, SUI / UST has increased by 379.79%. See more dynamics on SUI price chart.
Keep track of coins' changes with our Crypto Coins Heatmap.
Keep track of coins' changes with our Crypto Coins Heatmap.
SUI / UST (SUI) reached its highest price on Oct 20, 2024 — it amounted to 15.00000000 USDT. Find more insights on the SUI price chart.
See the list of crypto gainers and choose what best fits your strategy.
See the list of crypto gainers and choose what best fits your strategy.
SUI / UST (SUI) reached the lowest price of 0.36247000 USDT on Oct 19, 2023. View more SUI / UST dynamics on the price chart.
See the list of crypto losers to find unexpected opportunities.
See the list of crypto losers to find unexpected opportunities.
The safest choice when buying SUI is to go to a well-known crypto exchange. Some of the popular names are Binance, Coinbase, Kraken. But you'll have to find a reliable broker and create an account first. You can trade SUI right from TradingView charts — just choose a broker and connect to your account.
Crypto markets are famous for their volatility, so one should study all the available stats before adding crypto assets to their portfolio. Very often it's technical analysis that comes in handy. We prepared technical ratings for SUI / UST (SUI): today its technical analysis shows the buy signal, and according to the 1 week rating SUI shows the buy signal. And you'd better dig deeper and study 1 month rating too — it's strong buy. Find inspiration in SUI / UST trading ideas and keep track of what's moving crypto markets with our crypto news feed.
SUI / UST (SUI) is just as reliable as any other crypto asset — this corner of the world market is highly volatile. Today, for instance, SUI / UST is estimated as 3.31% volatile. The only thing it means is that you must prepare and examine all available information before making a decision. And if you're not sure about SUI / UST, you can find more inspiration in our curated watchlists.
You can discuss SUI / UST (SUI) with other users in our public chats, Minds or in the comments to Ideas.