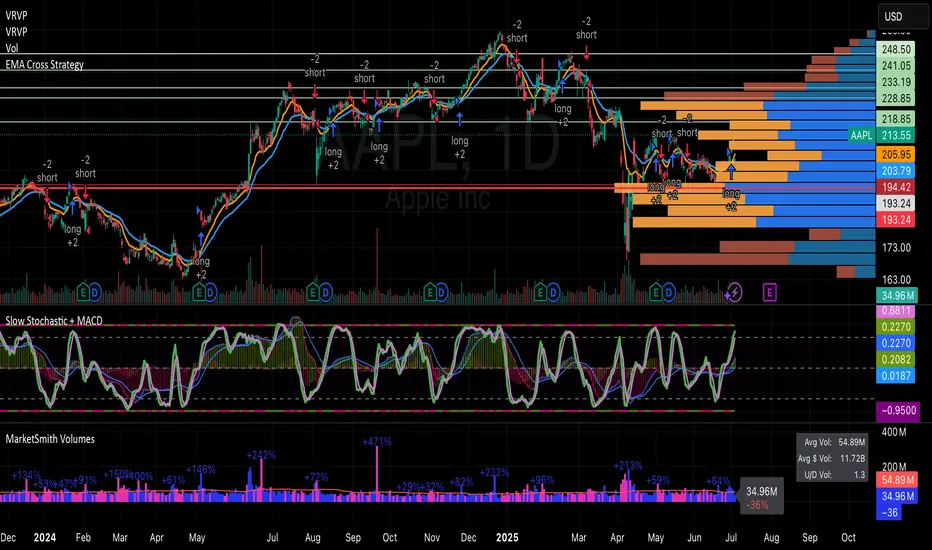
APPLE Massive Short! SELL!
My dear friends,
Please, find my technical outlook for APPLE below:
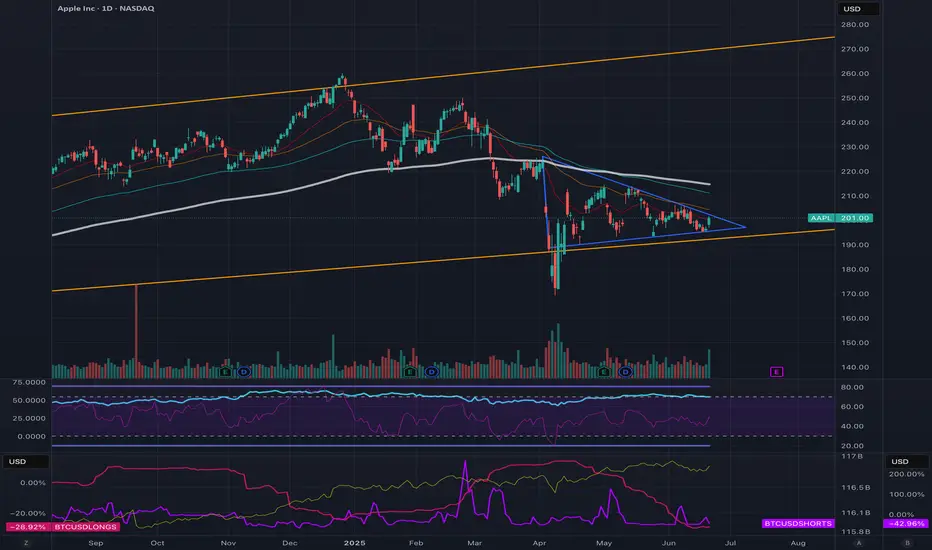
The instrument tests an important psychological level 213.58
Bias - Bearish
Technical Indicators: Supper Trend gives a precise Bearish signal, while Pivot Point HL predicts price changes and potential reversals in the market.
Target - 208.03
About Used Indicators:
Super-trend indicator is more useful in trending markets where there are clear uptrends and downtrends in price.
Disclosure: I am part of Trade Nation's Influencer program and receive a monthly fee for using their TradingView charts in my analysis.
———————————
WISH YOU ALL LUCK
AAPL trade ideas
Apple about to popTight BB squeeze — contractions like these are usually followed by heightened volatility.
$AAPL In ConsolidationNASDAQ:AAPL is consolidating here in a wedging pattern. I do not know which way this will resolve. But, since I rarely if ever short, I am looking on the long side of a trade. The thing I like about a consolidation pattern like this is, you know when you are wrong very quickly. My plan is to take a ¼ size long position if / when it moves above the 50 DMA (red) with a stop just below the most recent low (which would also correspond to dropping below the lower wedging trendline.
Then if it can break out over the upper downtrend line, I will look to build out my position. I thought this would be a good one to put on your watchlist. If you like the idea, please make it your own so that it fits within your trading plan.
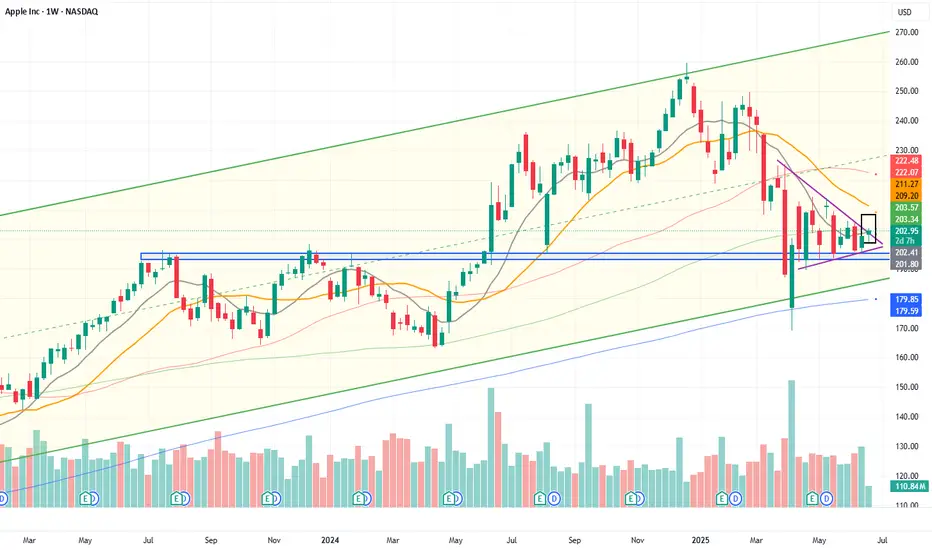
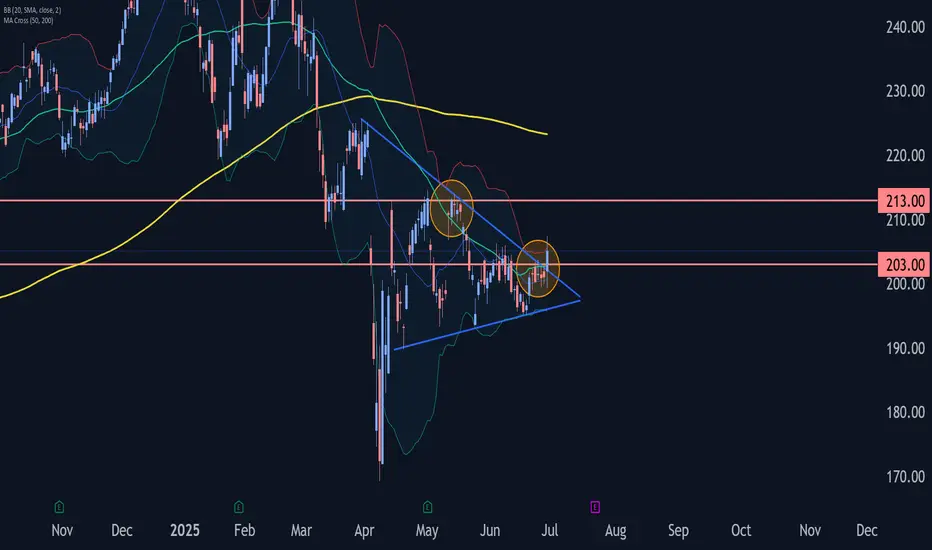
Breaking out!The price breaks through the purple resistance and is preparing to start an upward movement.
A compression triangle formation is taking shape, with the lows resting on the underlying purple trendline.
At $203.3, the weekly 100-period simple moving average (SMA100, green line) is located. A close above this level would be an important confirmation of the bullish reversal.
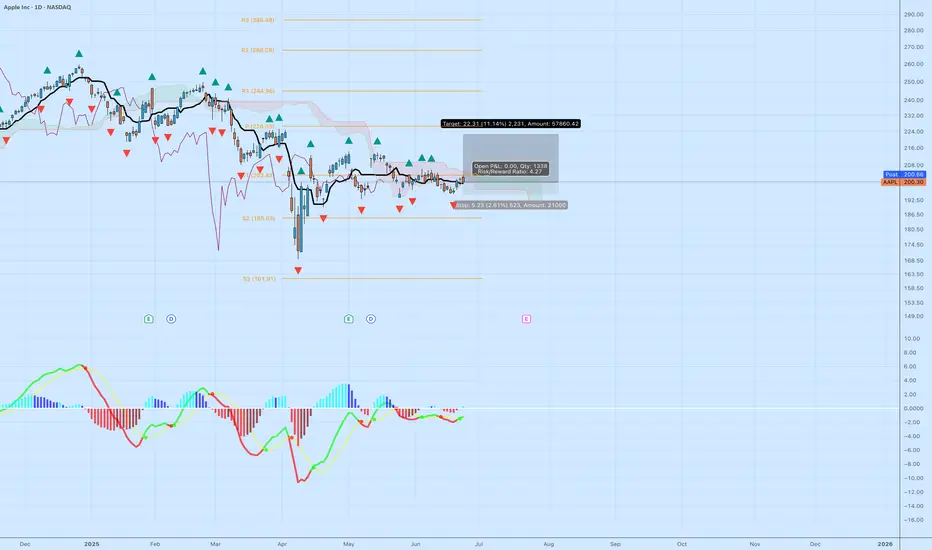
$AAPL Long Setup – Range Breakout Potential with Tight RiskApple ( NASDAQ:AAPL ) is finally showing signs of strength after a prolonged sideways range. Price is attempting to break above the Ichimoku Cloud on the daily chart while MACD is starting to curve upward—indicating a potential shift in momentum. After holding the $190–$200 zone as support for months, this move above $200 could trigger a short-term breakout toward the $220–$226 levels.
The current setup has a clean structure with a 4.27 risk/reward ratio:
Entry: $200.30
Stop: $195.07 (below recent range lows)
Target: $222.61 (prior high + pivot cluster)
If this move holds, it could mark the start of a trend reversal in Apple following months of chop. Solid setup for a 2–4 week swing trade or as part of a core position rebuild.
Let me know if you're playing this one or waiting for confirmation above $208.
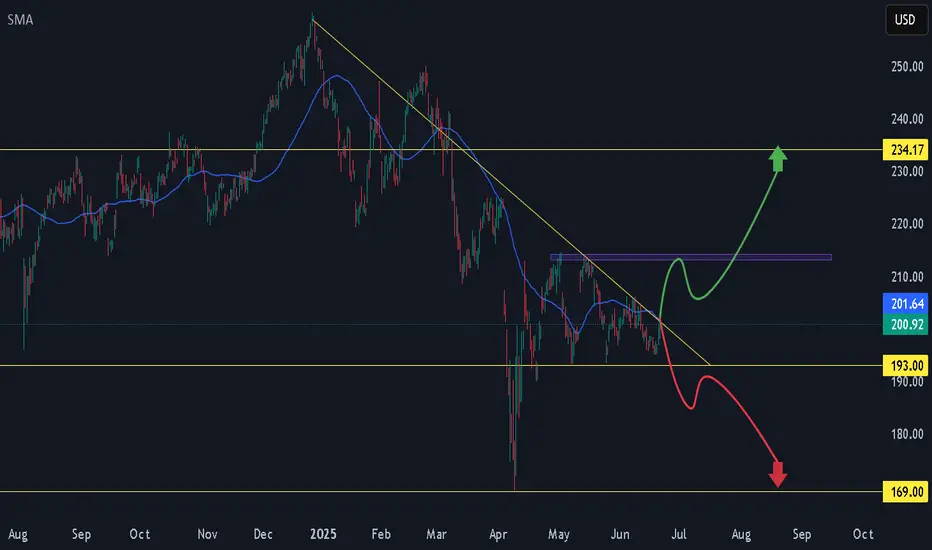
AAPLApple shares trade in a consolidation zone after solid Q2 results—revenue at $95.4B (+5%), record services growth, and strong margins despite tariff headwinds.
Technically , indicators lean bullish, but resistance near $202–204 poses a short-term barrier. Market reaction to WWDC AI updates and further supply‑chain diversification will be key. On dips toward $196, there’s room for selective buying; if $204–214 breaks decisively, upside toward $235 could unfold . However, the lack of clear AI revenue guidance warrants caution, aligning with Needham’s cautious stance.
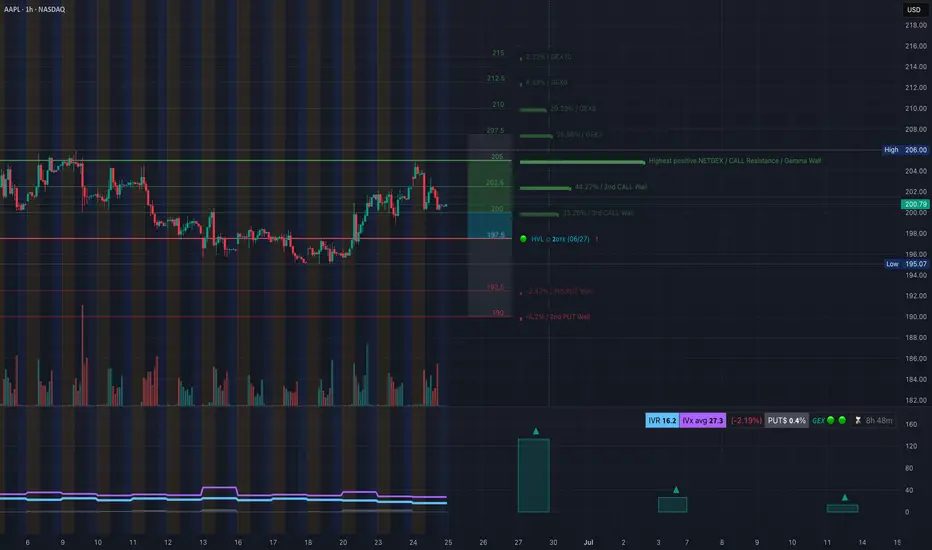
AAPL Bulls May Regain Momentum – Price Action Suggest a Bounce 🔍 GEX-Based Options Insight:
* GEX Cluster sits heavy at 204–206, marking a Gamma Wall / Resistance Zone.
* Highest NET GEX levels suggest 205–206 is a magnet if price builds strength.
* IVR: 16.2, IVX is low, indicating cheap premium for call buyers.
* Calls: 0.6% bias, showing a neutral-to-light bullish flow.
🟩 GEX Support: 197.5
🟥 PUT Walls: Below 192.5 and 190 (farther from current level)
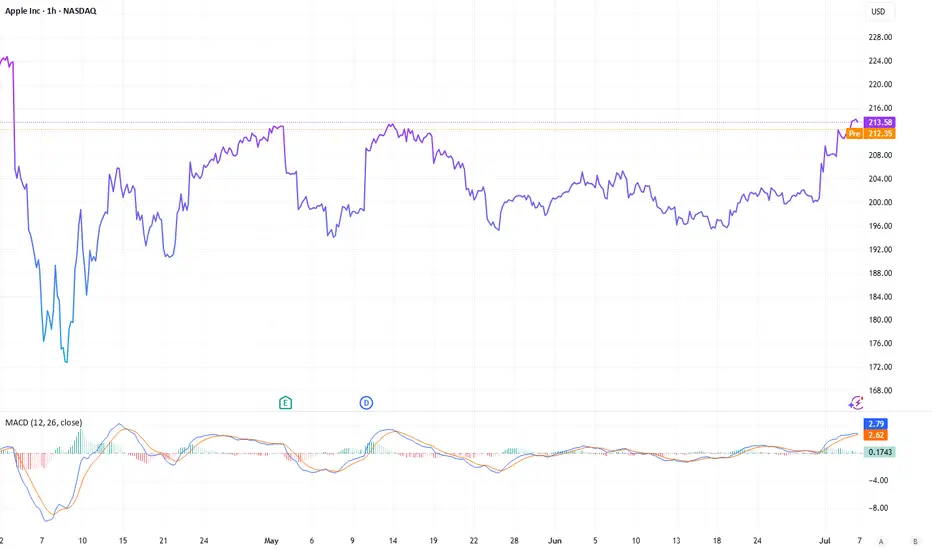
🧠 Technical View (1H Chart):
* AAPL is pulling back into a demand zone while still respecting the upward channel.
* Just formed a CHoCH, signaling a potential reversal back up.
* Price is sitting on channel support + demand, with a recent BOS confirming bullish structure intact.
* Volume during this pullback is lower than the prior bullish leg—healthy retrace.
🔁 Trading Idea (for calls):
Entry:
🟢 Around 198.5–199 (channel and OB support zone)
Target 1:
📈 201.50 – retest of supply / GEX resistance
Target 2:
📈 204.88–206 – Gamma Wall target
Stop Loss:
🔴 Below 196.50, breaks OB and structure
🎯 Ideal Option Play:
* July 5th or July 12th 202 Calls
* Low IV makes this a decent R/R for directional play
* Momentum confirmation on reclaim of 200.80 gives confidence
💬 If AAPL can defend the current structure and flip 200.80 intraday, we may see a gamma chase back to 204+.
This analysis is for educational purposes only and not financial advice. Always trade with a plan and proper risk management.
Time to buy? Too much negative press. Buy in Fear- Updated 23/6Apple has been dealing with significant negative press recently, leading to fear and critical perceptions among investors. This situation suggests a common investment principle: in times of fear, you should buy, and in times of greed, you should sell. Consequently, I have taken a considerable long position on Apple.
The flag pattern is almost complete, indicating that a price movement is imminent. I have set my stop loss at $196, with an anticipated profit from a positive breakout expected to exceed $223, representing potential gains of over 10%. There is also further upside potential to surpass $230.
Apple is a strong long-term hold, regardless of current market fluctuations. The company boasts a mature and extensive ecosystem, making it a brand I wouldn't bet against. If you already own Apple products, you likely understand how unlikely it is that you would switch to another brand.
Last Friday's green candle validated the flag pattern, indicating that a breakout is still needed. However, the flag pattern has now shifted to a more bearish formation, which could suggest seller exhaustion and strong support at these price levels. Achieving above 202 USD would be both a positive sign and an indication of strong buyer interest. The Iranian conflict may cause volatility, but my long position is still active, and the upcoming weeks could see a positive breakout >202. Although this flag pattern is typically bearish, I believe Apple is undervalued based on its future potential offerings and this could be a good entry price? As always not financial advice but let me know if you think Apple is going to <170 or >230.
My target sell price is now 271 USD.
Apple Stock in 10 years perspective: Stability or New Heights?The future of Apple stock remains a hot topic among investors and analysts. For today’s July, the company’s market capitalization has climbed to $3 trillion, up from $2.9 trillion (a year ago, on May 2024). But can this tech giant continue to deliver significant returns for shareholders over the next decade? Let’s take a quick look on it.
AI’s Take on the Future
Recently, ChatGPT highlighted Apple NASDAQ:AAPL as a top contender among stocks poised to generate substantial wealth by 2035, outranking peers like Microsoft NASDAQ:MSFT , Amazon NASDAQ:AMZN , and Nvidia NASDAQ:NVDA . The prediction has sparked curiosity, but what do real-world experts think?
Analyst Perspectives: Strengths and Challenges
Opinions on Apple’s outlook vary. On one hand, the company boasts a robust financial foundation, steady revenue from subscriptions, and substantial cash reserves. On the other hand, some analysts argue that its current share price is overstretched. Apple’s forward P/E ratio—based on projected earnings for the next 12 months—stands at 27, compared to the S&P 500’s near 22, suggesting investors are paying a premium for future growth.
Additionally, Apple faces mounting competition and regulatory pressures. The key question is whether it can maintain its edge in a fast-evolving tech industry.
Services and Devices
In recent years, Apple has leaned heavily into services like subscriptions and digital platforms, delivering high-margin and recurring revenue. Yet, its core business still hinges on device sales, particularly the well-known iPhone. Without groundbreaking new products, the company risks getting stuck in a cycle of incremental updates, potentially slowing its growth trajectory.
Financial Resilience
Despite these challenges, Apple’s financial metrics remain impressive. Its market cap has risen to $3 trillion, and it continues to generate significant free cash flow. The company also offers modest dividends, making it attractive for those people, who prefer and seek stable returns.
What to Expect from Apple by 2035?
Apple stands as one of the most dependable long-term investments, but we shouldn’t expect the explosive growth, just like it was at their early years. Of course iconic brand, loyal customer base, and adaptability— is a strong side and support its stability. But the high share price, competitive pressures, and reliance on certain hardware components may limit and slow down its upside.
Can Apple make you wealthy by 2035? It depends on your goals, risk tolerance and the size of your investment. For those seeking stability and modest gains, Apple is a solid pick. But if you’re chasing rapid wealth, you might need to look elsewhere for higher-risk opportunities.
Apple: Next Week’s Long Trade Opportunity with Upside PotentialCurrent Price: $213.55
Direction: LONG
Targets:
- T1 = $225
- T2 = $240
Stop Levels:
- S1 = $210
- S2 = $200
**Wisdom of Professional Traders:**
This analysis synthesizes insights from thousands of professional traders and market experts, leveraging collective intelligence to identify high-probability trade setups. The wisdom of crowds principle suggests that aggregated market perspectives from experienced professionals often outperform individual forecasts, reducing cognitive biases and highlighting consensus opportunities in Apple.
**Key Insights:**
Apple continues to lead the technology sector with sustained bullish momentum. Strong seasonal trends averaging 13.4% gains during July and August further underscore its upside potential. AI-driven product developments and its role in mega-cap leadership positions it for ongoing strength, though near-term overextension risks persist.
**Recent Performance:**
Apple gained 6% last week, spotlighting its dominance among mega-cap stocks as a leader of the broader tech rally. While the "Magnificent 7" stocks, including Nvidia and Tesla, showed mixed signals, Apple has preserved relative strength and upward momentum.
**Expert Analysis:**
Portfolio managers have expressed confidence in Apple as part of the "big three" tech stocks, favoring its innovation and operational strategies despite valuation concerns. The mixed sentiment, with mentions of potential put activity, suggests cautious optimism, but its breakout above $213 highlights stronger short-term opportunities.
**News Impact:**
Apple’s AI initiatives, such as outsourcing Siri's development, contribute positively to market sentiment. Additionally, anticipation of earnings season strength in late July adds weight to bullish strategies. As mega-cap stocks maintain leadership, Apple’s pivot into AI-driven innovation reinforces its critical role in technological advancement.
**Trading Recommendation:**
Based on robust performance trends, seasonal advantages, and a supportive macro backdrop, a LONG position on Apple offers strong upside potential with defined risk parameters.
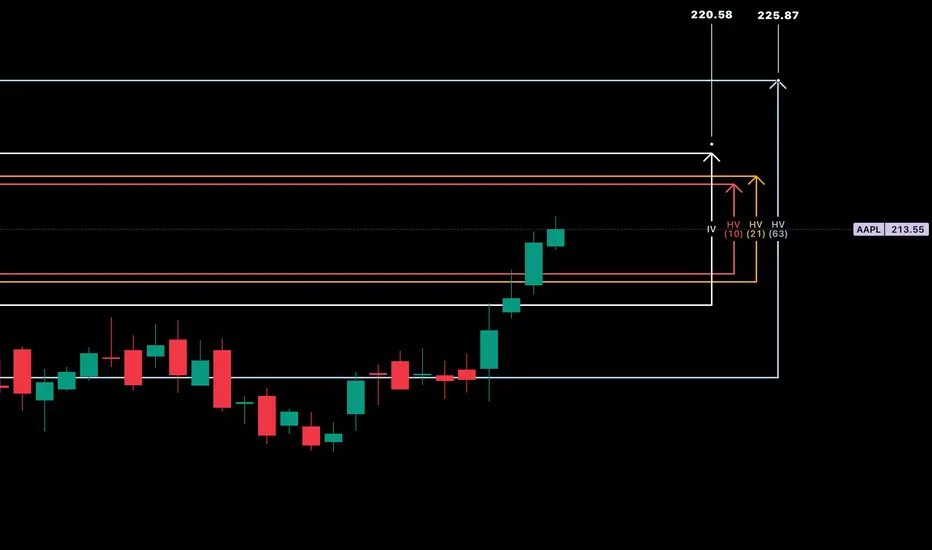
AAPL - Weekly HV/IV PerspectiveGood evening —
I wanted to do one more write up with that being on NASDAQ:AAPL as we enter the week with futures just opening.
HV10 (16.58%) is trending -11.56% below IV (28.14%) showing a weekly price gap differential of -$2.89 on the stated implied move to what trending markets are doing. This current IV value entering the week sits 69% within the sliding year spectrum.
Now, with Apple consolidating in range for almost eight weeks after selling off when it reached its 4T milestone in December of 2024, has now begun advancing back upwards in price. The strength here is obvious and the quality of company is well, Apple.
My price targets on the week is first the upper band of stated IV ($220.58) then moving on towards the upper implied range of HV63 ($225.87). I believe the markets are going to push apple higher while balancing the indices out selling off in other areas. This would start to accelerate HV10, as it is now 91.23% coiled to its yearly lows and needs to unwind. Hopefully with a few short-term trending days increasing we find our regression.
Please come back next week and see how our position and volatility progressed forward.
Apple's (AAPL) 2009 Long-Term Trendline BounceTechnicals:
After a daily a-b-c to long-term horizontal trendline support, when we zoom out, we can see Apple's 2009 Long-Term Trendline Bounce.
Monthly Chart:

$AAPL On The Run? NASDAQ:AAPL breaking out of the stage 1 and entering a stage 2 breakout back to prior support and resistance zones.
RSI is a little hot at 67.52 so it may trade sideways to allow a cooling off phase before grinding higher to reach its value. News is that it is investing in the USA.
Stop loss would be a trailing stop loss of $4.48.
AAPL LONG 05/07/2025Price has been moving inside a multi-year bullish tunnel, price has also broken a minor resistance level of 207$ with a nice bullish engulfing candle with some increase in volume on the last few daily candles.
Analysis HTF - Weekly
execution LTF - Weekly
Candle pattern - Bullish engulfing
Acceleration - Check
Volume - Check
Structure - Check
Moving average - X
Base rate - 70%(to hit stop loss)/30% to succeed
With the acceleration, volume pattern and strong multi year structure I suggest a base rate of 55%/45%(to succeed)
Good luck
Watch OutIf it breaks the 214 supply zone the next one to break is the 224 zone. I know most people would put stop loss around 193. However, that's where my smart money friend places his huge buy orders. He calls it the demand zone. Not financial advice.
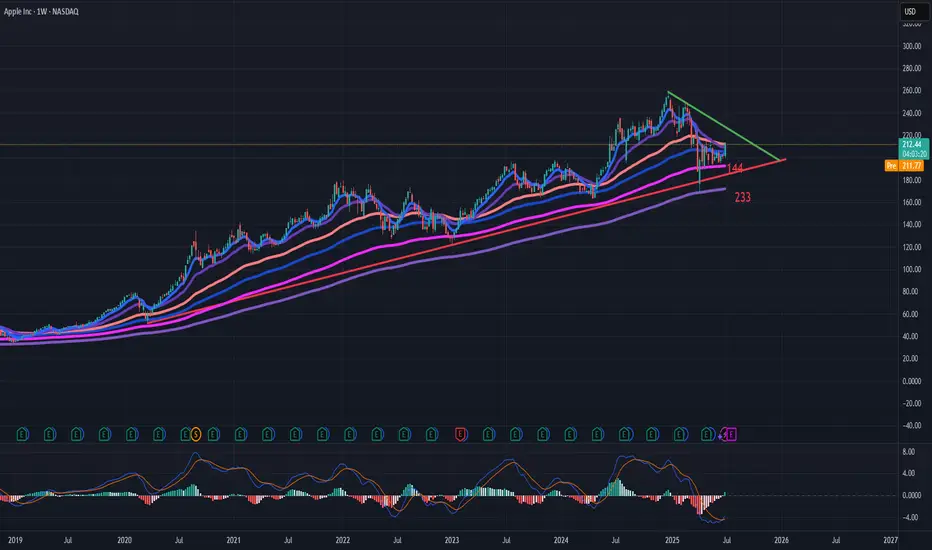
AAPL // I used Fibonacci numbers. 144 is our ema support point. Let's look for closings above the green line for the trend.
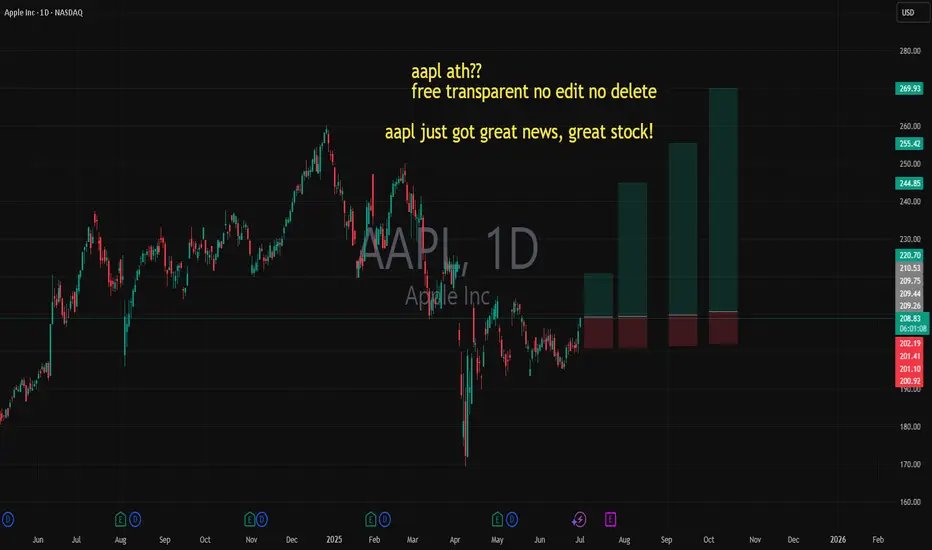
aapl just got great news, great stock! ATH coming?? YEA???aapl just got great news, great stock!
bullish. so very bullish
let us know!
free transparent no edit no delete
🐉We value full transparency. All wins and fails fully publicized, zero edit, zero delete, zero fakes.🐉
🐉Check out our socials for some nice insights.🐉
information created and published doesn't constitute investment advice!
NOT financial advice
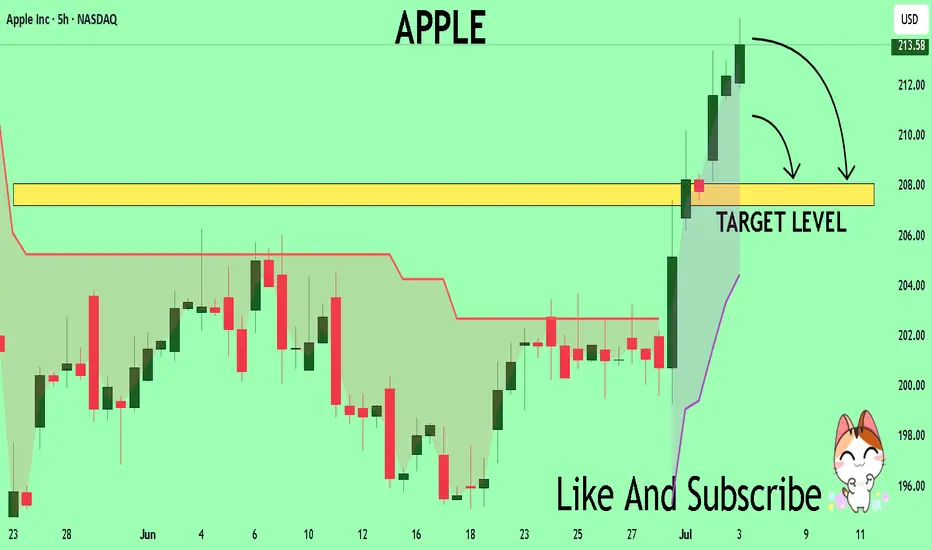
Apple Wave Analysis – 30 June 2025
- Apple broke resistance zone
- Likely to rise to resistance level 213.40
Apple recently broke the resistance zone between the resistance level 203.00 (which has been reversing the price from the start of June) and the resistance trendline of the daily Triangle from March.
The breakout of this resistance zone should add to the bullish pressure on Apple.
Apple can be expected to rise to the next resistance level 213.40, which reversed the previous waves (A), (C) and (2), as can be seen below.
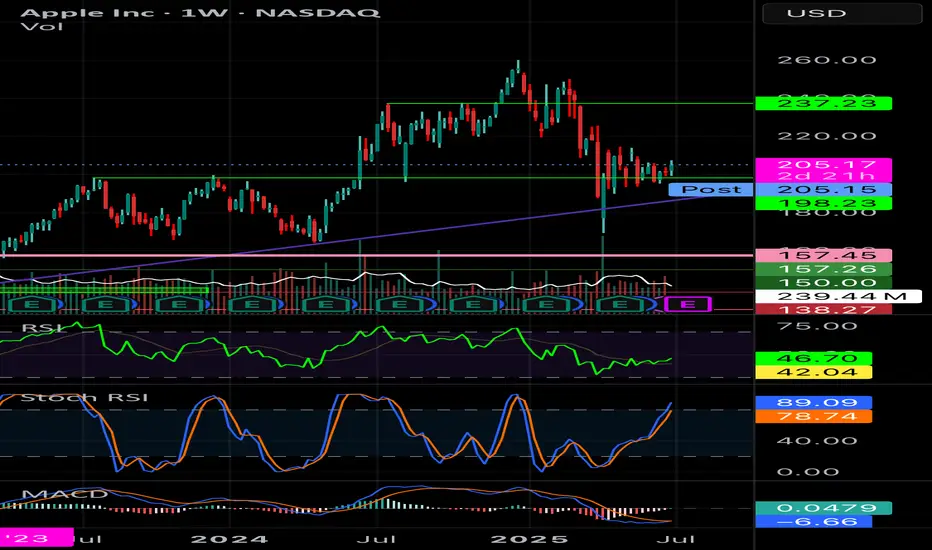
AAPL Weekly ChartOn the weekly chart, AAPL seems to find support on a previous resistance level after testing it several times. Macd has signaled a green as well. Seems optimistic.
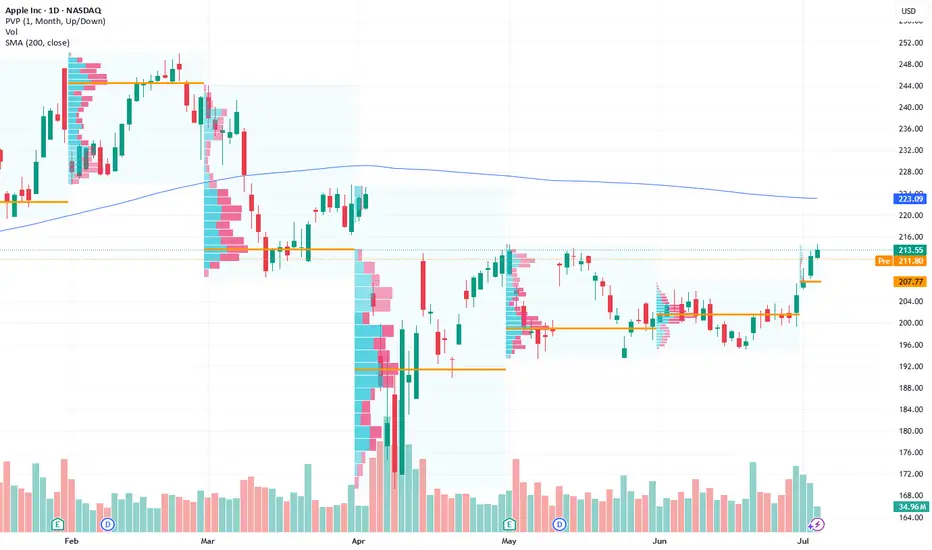
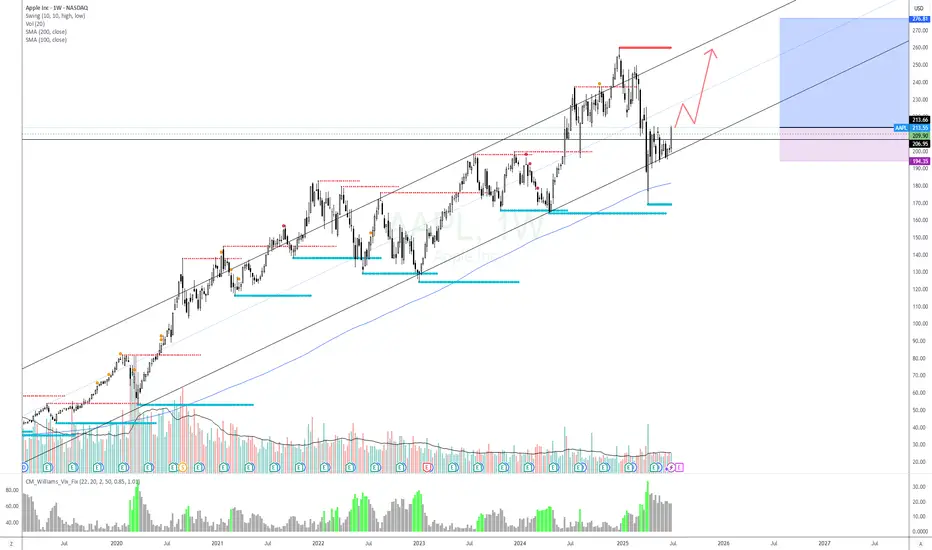
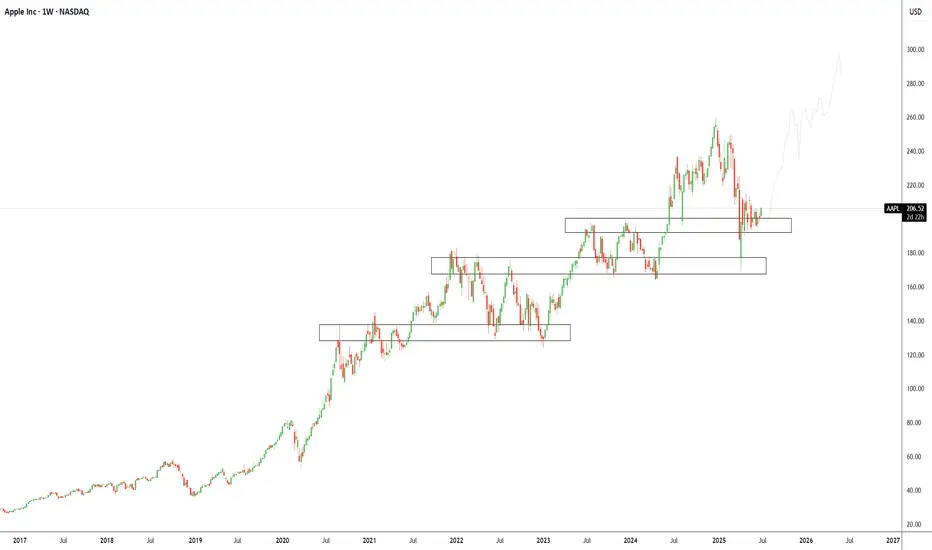
Apple Inc (APPL): Trend Continuation to $300+Overview Summary
We’ve added new long positions on Apple ( NASDAQ:AAPL ) recently after a textbook rejection from a well-established support/demand zone between $185–$200. This area has consistently acted as a launchpad for previous rallies and is now once again serving as a structural support on the weekly timeframe.
Apple’s ability to consistently innovate through product cycles, expand its services ecosystem, and integrate AI-driven features into its devices provides strong conviction for long-term upside. With Vision Pro, Apple Intelligence, and chip-level innovations underway, the company is positioning itself to benefit from both hardware and software expansion over the next decade.
Technically, the price has formed a multi-year stair-step structure with clear levels of accumulation. We believe NASDAQ:AAPL is beginning its next leg higher after consolidating above this zone. A clean move to retest all-time highs is likely, and a long-term target of $300 aligns with both trend structure and growth potential.
Green Zone Capital remains bullish on NASDAQ:AAPL with a long-term horizon and will continue to scale into strategic pullbacks within the broader uptrend, our current setup is:
Bias: Long
Type: Long-Term Accumulation
Entry Zone: $190–$205
Target: $300+
Invalidation: $165
Technical Analysis:
Apple is currently sitting at a critical demand zone that has historically acted as a base for previous multi-month rallies. Our TradingView chart highlights several key structural zones showing Apple’s tendency to build stair-step accumulation ranges followed by breakouts. The current zone between $185–$205 has been tested and held multiple times, confirming its significance.
We are seeing bullish rejection candles forming on the weekly timeframe, showing buyer interest is returning. This confluence of technical support and long-term structural demand confirms our long entry thesis.
Macro/Fundamental Thesis:
Apple remains one of the strongest tech companies globally with unmatched brand equity, pricing power, and integration across hardware, software, and services. The company continues to expand aggressively into AI with Apple Intelligence, spatial computing with Vision Pro, and strategic chip development.
With record cash reserves, a loyal consumer base, and continued innovation cycles across iPhone, Mac, and Services, Apple remains a strong defensive and offensive tech allocation in any long-term portfolio. Despite current macro volatility, Apple has consistently outperformed over market cycles.
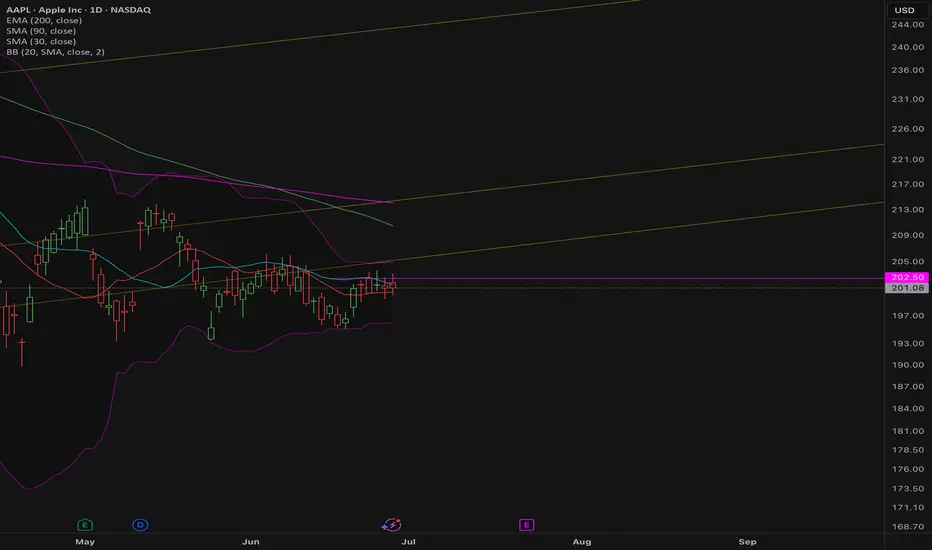
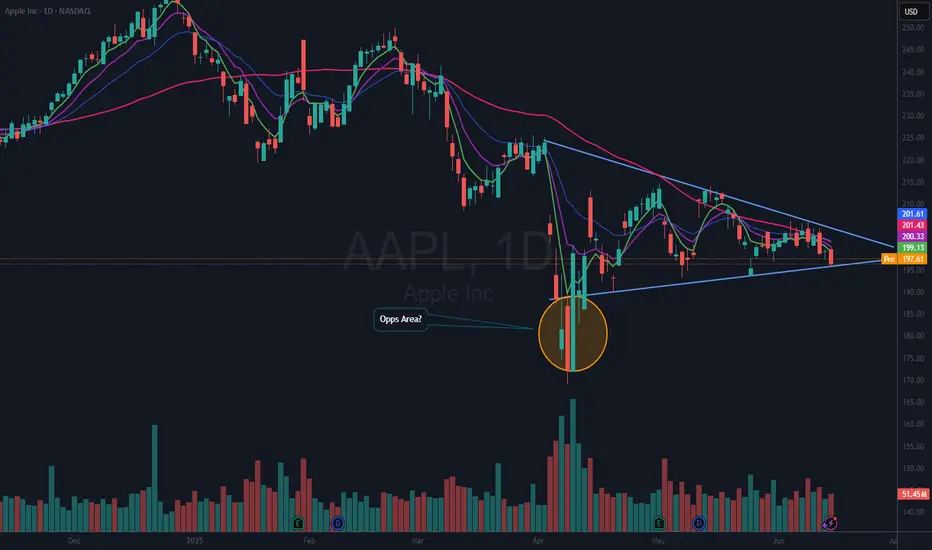
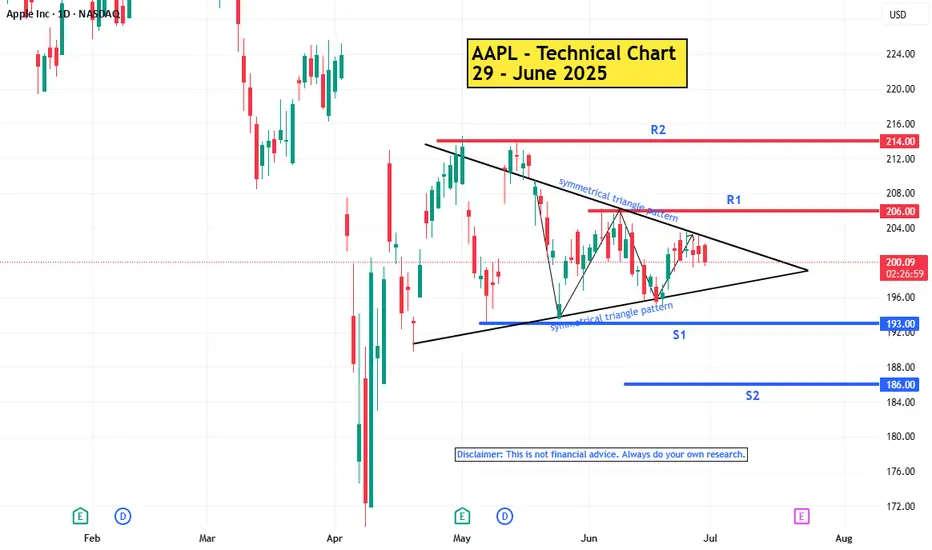
AAPL : Technical Analysis Report - 29 June 2025
Trend:
The primary trend (big picture) is downward. Bearish momentum is weak.
Short Term Trend : sideways / consolidation. Momentum in sideways trends is usually weak and indecisive. Sideways within a long term downtrend is often a continuation pattern.
Reasons:
Market Uncertainty: Waiting for news, earnings, or macro events.
Accumulation/Distribution: Smart money prepares for the next move (either continuation or reversal).
Pattern : Symmetrical Triangle Pattern
The pattern represents a temporary pause in the prevailing trend. The symmetrical triangle is considered a continuation pattern. This means that the price is likely to continue in the direction of the trend that preceded the triangle's formation. Neutral pattern until the breakout direction is confirmed.
Key levels :
R2 - 214
R1 - 206
S1 - 193
S2 - 186
Tips for Trading
Wait for a confirmed breakout (e.g., a daily candlestick close above/below the trendline) to avoid false signals
-----------------------
Note :
If you’re interested in receiving detailed technical analysis reports on your selected stocks, feel free to reach out to me. I can provide you with customized reports covering trends, key levels, momentum, patterns, and price projections to support your investment decisions.
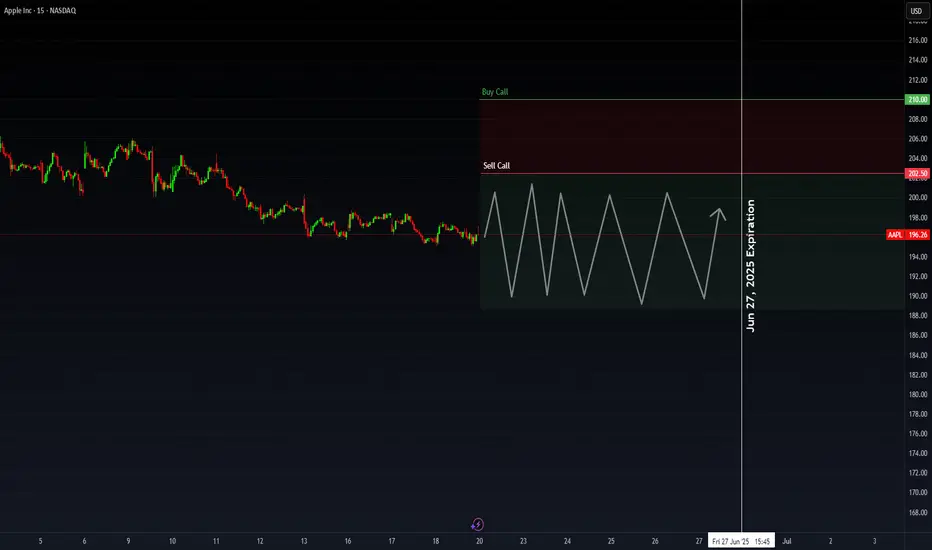
AAPL: Premium PlayApple beat expectations this quarter—revenue, profit, EPS—all slightly better than analysts hoped. But the stock dropped to $196.26, down from $212.83. Why? Investors are still worried about tariffs, margin pressure, and supply chain changes.
Tim Cook talked about strong product sales (iPhone, Mac, iPad) and all-time high Services revenue. But he also admitted tariffs and regulatory issues are weighing on Apple’s outlook.
My Covered Call Strategy
I’m selling the $202.5 call and buying the $210 call for June 27, 2025. Big money seems to be doing the same—there was a huge premium sale over $2 million, likely betting Apple stays range-bound short term.
- Why this works:
- Resistance near $202.50 gives me a clear ceiling
- Apple fundamentals are strong, but macro risk caps upside
Chart Notes
- Resistance: $202.50 and $210
- Support: Around $192.50
Bottom line:
I like this trade as a way to bring in income while defining my risk. If Apple grinds sideways or pushes a bit higher, the trade still pays. Clean structure, high odds.
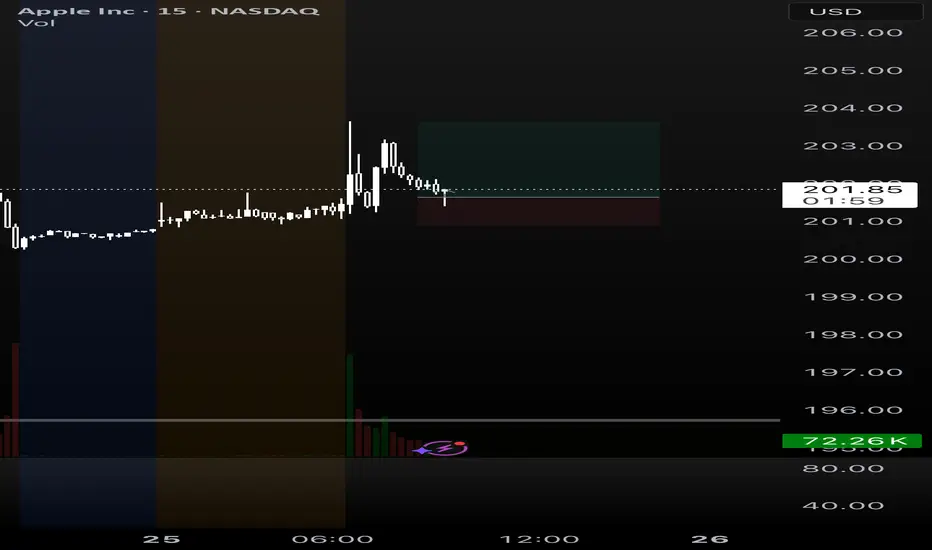
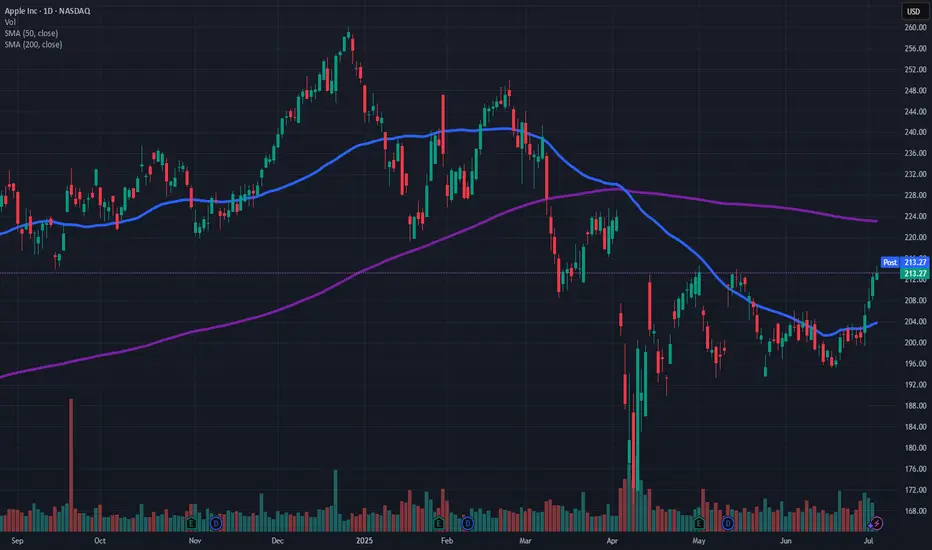
(Daytring) APPL quickly trade1. Premarket created a support line
2. Sma 200,50 is here
3. Price goes up in the moring just pull back to retest.
=> entry. Take profit whenever i feel good