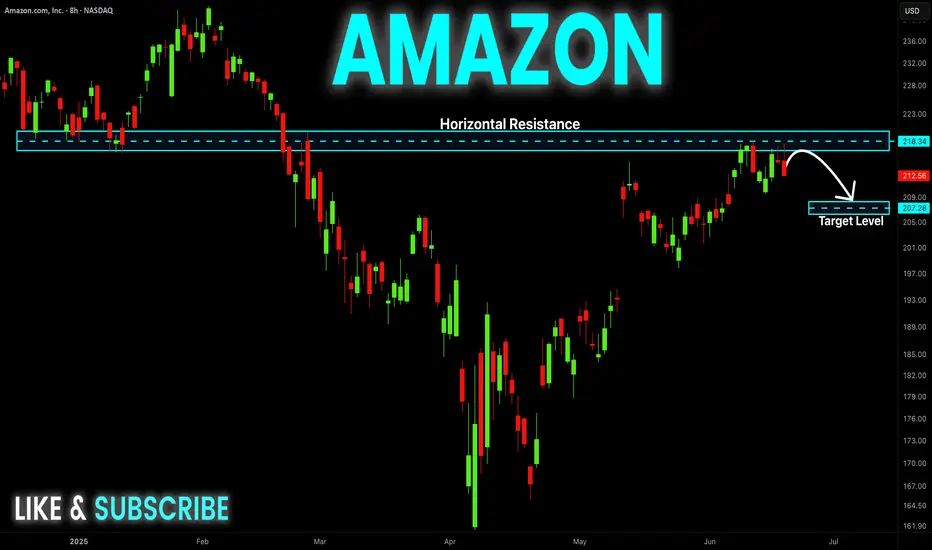
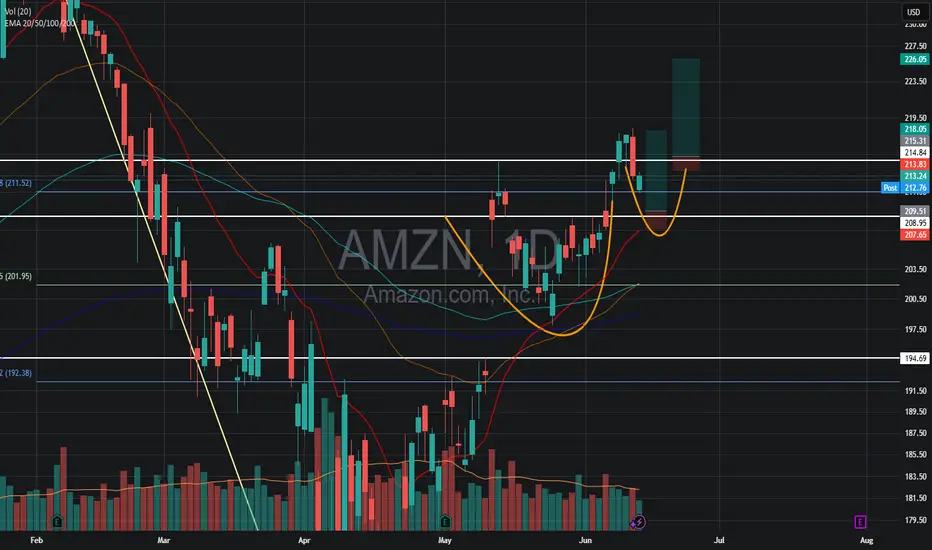
AMAZON Local Short! Sell!
Hello,Traders!
AMAZON made a retest
Of the horizontal resistance
Around 219$ and the stock
Is already making a local
Bearish pullback so a further
Bearish correction
Is to be expected
Sell!
Comment and subscribe to help us grow!
Check out other forecasts below too!
Disclosure: I am part
Key facts today
Next report date
—
Report period
—
EPS estimate
—
Revenue estimate
—
128.28 MXN
1.24 T MXN
13.30 T MXN
9.49 B
About Amazon.com
Sector
Industry
CEO
Andrew R. Jassy
Website
Headquarters
Seattle
Founded
1994
FIGI
BBG00JX0P3F1
Amazon.com, Inc. engages in the provision of online retail shopping services. It operates through the following business segments: North America, International, and Amazon Web Services (AWS). The North America segment includes retail sales of consumer products and subscriptions through North America-focused websites such as amazon.com and amazon.ca. The International segment offers retail sales of consumer products and subscriptions through internationally-focused websites. The Amazon Web Services segment involves in the global sales of compute, storage, database, and AWS service offerings for start-ups, enterprises, government agencies, and academic institutions. The company was founded by Jeffrey P. Bezos in July 1994 and is headquartered in Seattle, WA.
Related stocks
Amazon: Continuing to RiseWith Amazon’s recent climb, prices are edging closer to the top of wave (1) in magenta. However, there is still a bit of upside potential in the short term before wave (2) makes its corrective move. Our primary scenario does not anticipate a new low below $160.50. Instead, we expect wave (3) in mage

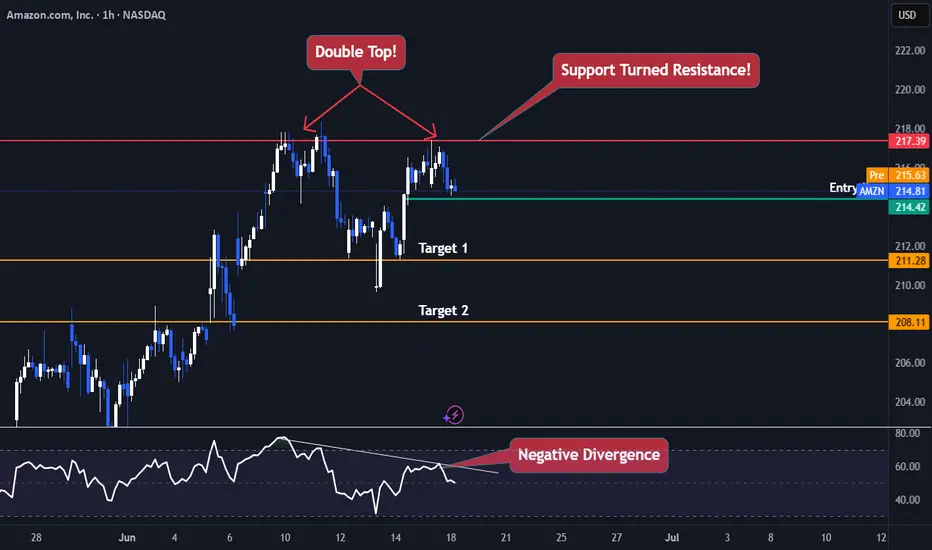
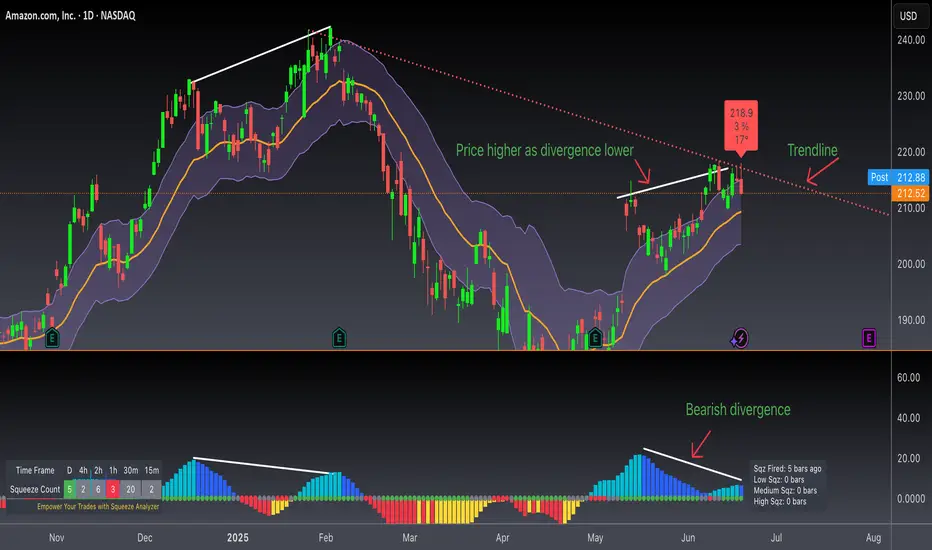
AMAZON TROUBLENASDAQ:AMZN Is currently trading Just 11% below its all time high and currently Facing exhaustion.
Amazon is currently trading 217$ range which was previous support now turned resistance (Daily Timeframe) , making a double top pattern and a negative divergence on the RSI.
The best Trades are th
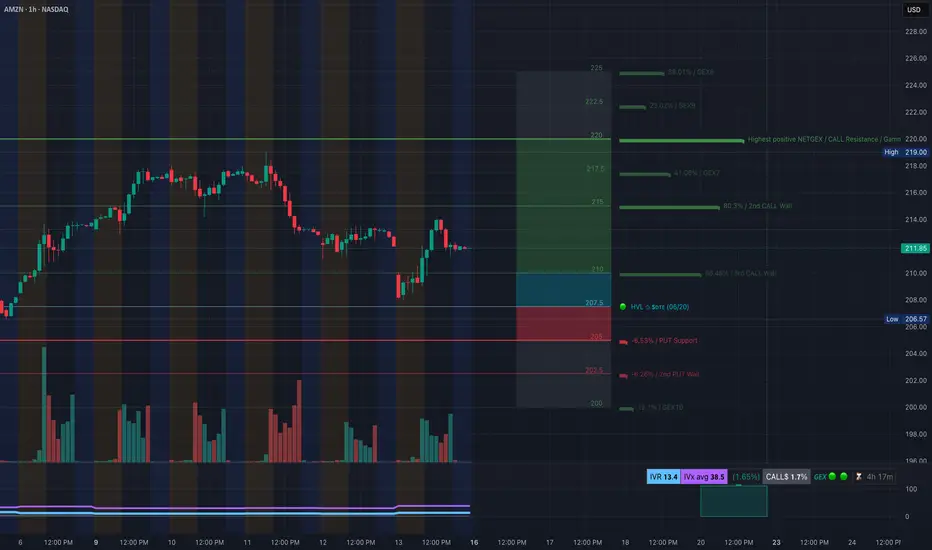
AMZN Quick Take: GEX & Chart Analysis- jun 161️⃣ Gamma Context (1‑Hour Chart)
* Call gamma wall clusters around $214–220, with the strongest resistance near $218–220—dealers may hedge/delta-neutralize here, creating selling pressure at that zone.
* Implied volatility is low (~13%) relative to average (~38%), making call spreads cheaper and app
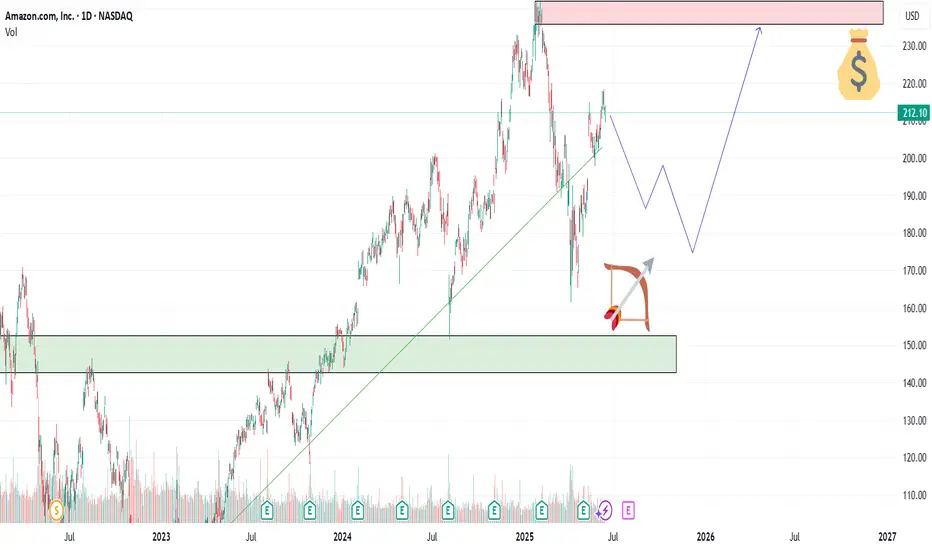
AMZN — Accumulation Zone or Just a Healthy Pullback?📦Amazon (AMZN) is offering an interesting opportunity after a healthy correction from its 2025 highs. With continued AWS expansion and aggressive investment in AI infrastructure, the fundamentals remain solid — but short-term volatility opens the door for strategic entries.
🎯 Entry Points
🔹 $194 –
AMZN on WatchLooking for a pull back to around $209.50 or a break out above $215.
Why:
20EMA and $209 resistance are lining up
On an uptrend
Possible Cup and Handle forming
$AMZN Rolling Over?Amazon is showing a bearish divergence and looks like it's ready to roll over. Of course this is contingent on other global factors, but the last time we saw a bearish divergence, there was a drop that followed.
Not financial advice, good luck to all :)
Amazon ($AMZN) – Bullish Breakout WatchPublished by: Wavervanir_International_LLC
🗓️ May 19, 2025 | 1D Chart
Amazon is showing strong momentum with a confirmed break above the $200.92 resistance zone (now flipped support). The price is currently consolidating around the 0.786 Fibonacci level ($208.21), and a clean daily close above this

Imbalance, FVG & Short Trend Flag Strategy / Estrategia basada..*************************
* ENGLISH VERSION *
*************************
This analysis blends institutional structure with price action to identify high-probability zones on AMZN.
🔍 Setup Structure:
Imbalance breaks PH/L of the trend: Confirmation of institutional strength breaking a Previous Hig

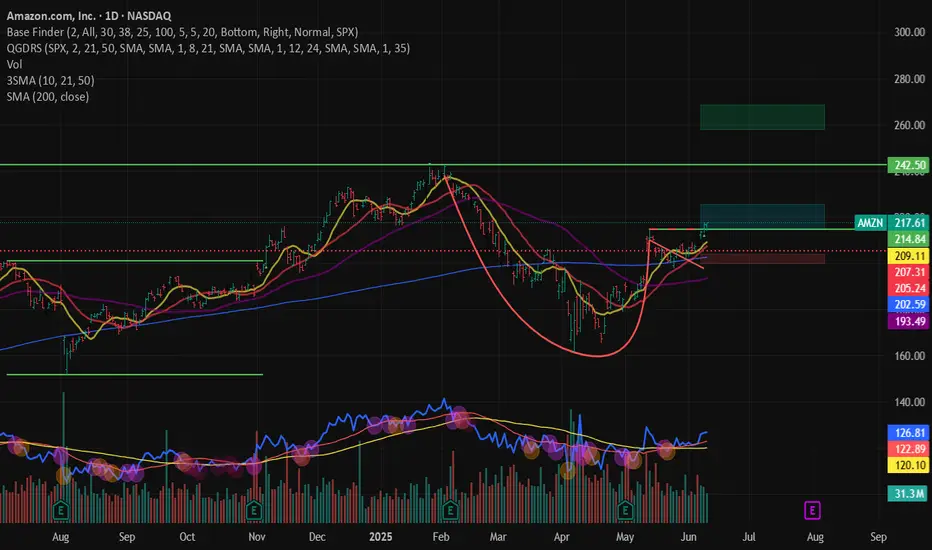
AMZN – Breaking Out From Handle in Cup & Handle BaseAmazon ( NASDAQ:AMZN ) is breaking out from the handle of a well-formed cup and handle base, offering a defined, low-risk entry with a strong technical structure.
📈 Entry Zone: 214.84 – 225.25
🛑 Stop Range: 203.88 – 197.23 (5–8% below entry, based on risk preference)
🎯 Target: 242.50
📌 Will conside
See all ideas
Summarizing what the indicators are suggesting.
Neutral
SellBuy
Strong sellStrong buy
Strong sellSellNeutralBuyStrong buy
Neutral
SellBuy
Strong sellStrong buy
Strong sellSellNeutralBuyStrong buy
Neutral
SellBuy
Strong sellStrong buy
Strong sellSellNeutralBuyStrong buy
An aggregate view of professional's ratings.
Neutral
SellBuy
Strong sellStrong buy
Strong sellSellNeutralBuyStrong buy
Neutral
SellBuy
Strong sellStrong buy
Strong sellSellNeutralBuyStrong buy
Neutral
SellBuy
Strong sellStrong buy
Strong sellSellNeutralBuyStrong buy
Displays a symbol's price movements over previous years to identify recurring trends.
Curated watchlists where AMZN is featured.


Frequently Asked Questions
The current price of AMZN is 4,024.08 MXN — it has decreased by −0.66% in the past 24 hours. Watch AMAZON COM INC stock price performance more closely on the chart.
Depending on the exchange, the stock ticker may vary. For instance, on BIVA exchange AMAZON COM INC stocks are traded under the ticker AMZN.
AMZN stock has fallen by −0.19% compared to the previous week, the month change is a 2.36% rise, over the last year AMAZON COM INC has showed a 19.48% increase.
We've gathered analysts' opinions on AMAZON COM INC future price: according to them, AMZN price has a max estimate of 5,522.02 MXN and a min estimate of 3,713.08 MXN. Watch AMZN chart and read a more detailed AMAZON COM INC stock forecast: see what analysts think of AMAZON COM INC and suggest that you do with its stocks.
AMZN stock is 1.69% volatile and has beta coefficient of 1.36. Track AMAZON COM INC stock price on the chart and check out the list of the most volatile stocks — is AMAZON COM INC there?
Today AMAZON COM INC has the market capitalization of 43.08 T, it has increased by 0.86% over the last week.
Yes, you can track AMAZON COM INC financials in yearly and quarterly reports right on TradingView.
AMAZON COM INC is going to release the next earnings report on Jul 31, 2025. Keep track of upcoming events with our Earnings Calendar.
AMZN earnings for the last quarter are 32.57 MXN per share, whereas the estimation was 27.99 MXN resulting in a 16.38% surprise. The estimated earnings for the next quarter are 25.10 MXN per share. See more details about AMAZON COM INC earnings.
AMAZON COM INC revenue for the last quarter amounts to 3.19 T MXN, despite the estimated figure of 3.18 T MXN. In the next quarter, revenue is expected to reach 3.09 T MXN.
AMZN net income for the last quarter is 350.88 B MXN, while the quarter before that showed 417.07 B MXN of net income which accounts for −15.87% change. Track more AMAZON COM INC financial stats to get the full picture.
No, AMZN doesn't pay any dividends to its shareholders. But don't worry, we've prepared a list of high-dividend stocks for you.
As of Jun 21, 2025, the company has 1.56 M employees. See our rating of the largest employees — is AMAZON COM INC on this list?
EBITDA measures a company's operating performance, its growth signifies an improvement in the efficiency of a company. AMAZON COM INC EBITDA is 2.62 T MXN, and current EBITDA margin is 19.15%. See more stats in AMAZON COM INC financial statements.
Like other stocks, AMZN shares are traded on stock exchanges, e.g. Nasdaq, Nyse, Euronext, and the easiest way to buy them is through an online stock broker. To do this, you need to open an account and follow a broker's procedures, then start trading. You can trade AMAZON COM INC stock right from TradingView charts — choose your broker and connect to your account.
Investing in stocks requires a comprehensive research: you should carefully study all the available data, e.g. company's financials, related news, and its technical analysis. So AMAZON COM INC technincal analysis shows the neutral today, and its 1 week rating is buy. Since market conditions are prone to changes, it's worth looking a bit further into the future — according to the 1 month rating AMAZON COM INC stock shows the buy signal. See more of AMAZON COM INC technicals for a more comprehensive analysis.
If you're still not sure, try looking for inspiration in our curated watchlists.
If you're still not sure, try looking for inspiration in our curated watchlists.