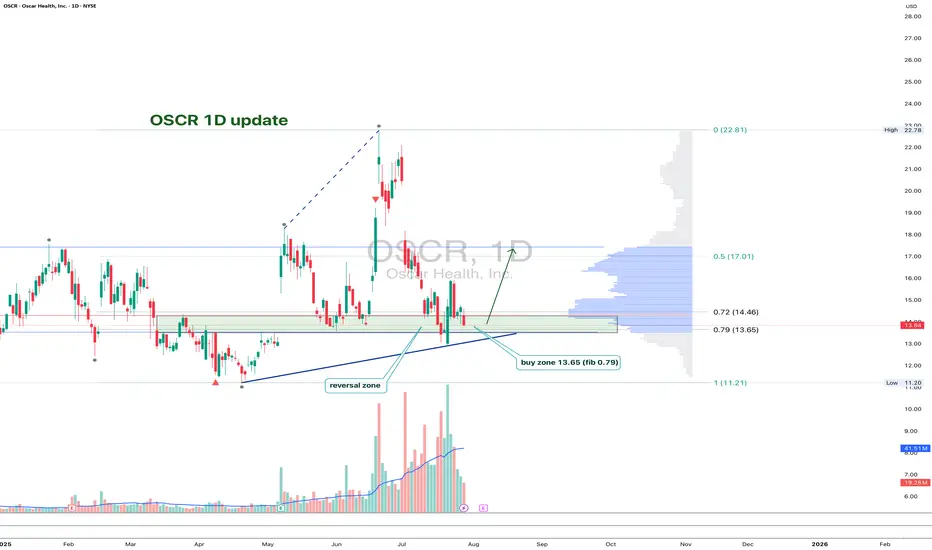
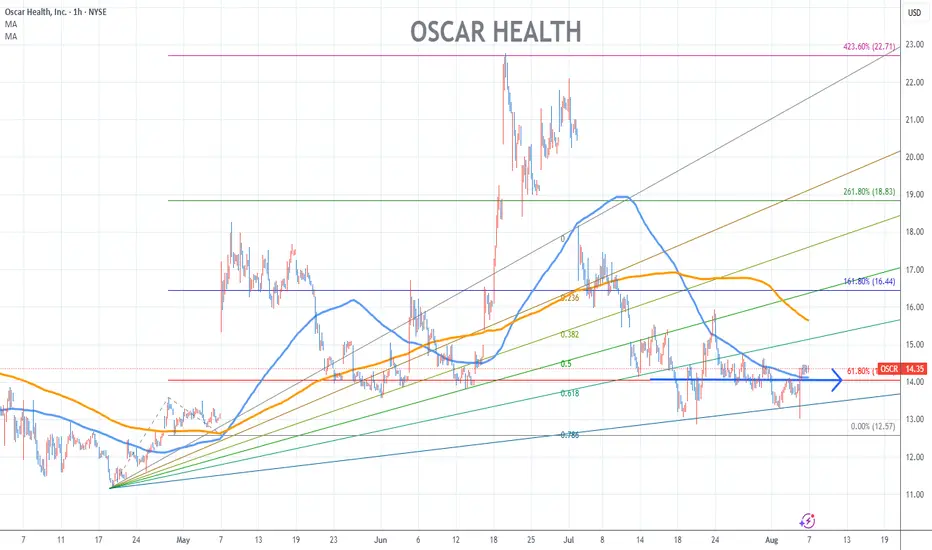
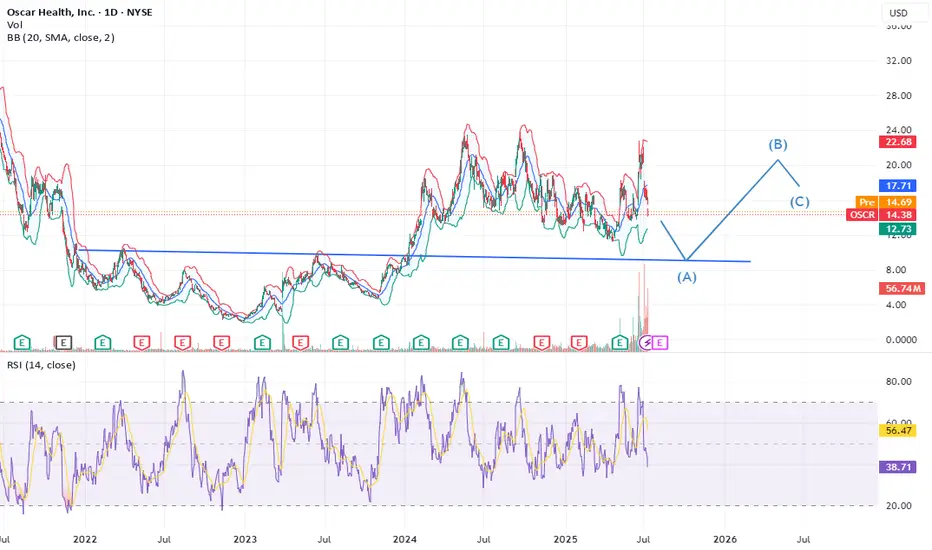
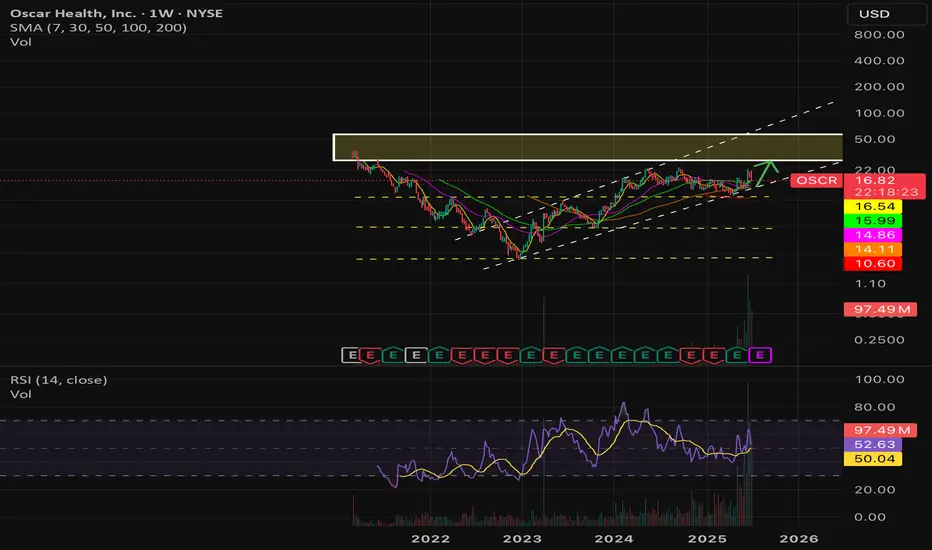
OSCR: back to support and now it’s decision timeAfter the recent impulse move, OSCR has pulled back to a key support zone around 13.65. That area aligns with the 0.79 Fib retracement, a horizontal level from spring, and a rising trendline that has already triggered reversals in the past. The structure is still intact, and buyers are testing the level again. If support holds and we get a bullish confirmation, the next target is 17.01, followed by a potential breakout toward the high at 22.81.
Volume remains elevated, the overall structure is healthy, and the correction is controlled. A break below 13.00 would invalidate the setup - until then, it’s a clean, high-reward zone with tight risk.
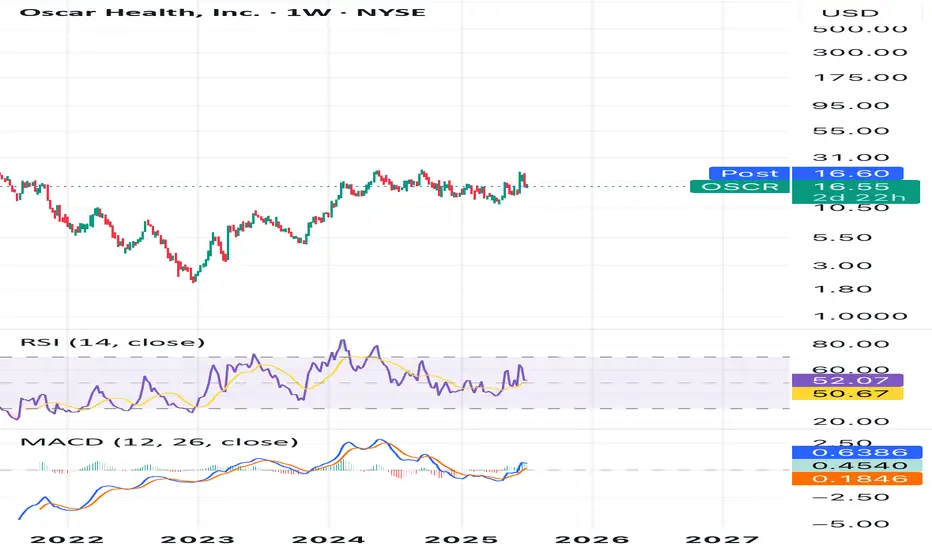
Fundamentally, Oscar Health has revised its 2025 guidance: revenue is expected in the $12–12.2B range, with operating losses projected between $200M and $300M. Despite softening topline growth, earnings per share are improving, and investor sentiment has been shifting. Technical strength is also reflected in the recent rise in RS Rating to 93, confirming that the stock is showing relative leadership even as the market cools.
This is one of those setups where both technicals and narrative are aligning - now we just need confirmation from the chart.
OSCR trade ideas
OSCR LONGI know some love and some hate the stock, but from a fundamental standpoint, it's got a lot of potential. Cup and handle. Gaps to fill above. Resistance at 22-24 as of recent. Good Revenue, lots of cash on hand, classic profitable business model, low PE ratio and more all indicate a 30-50 dollar future for Oscar, though the current period will be rocky with the ACA and political climate. Sector is rocky right now and Earnings will also be key as it may drop the stock, but I like shares long personally. Nfa
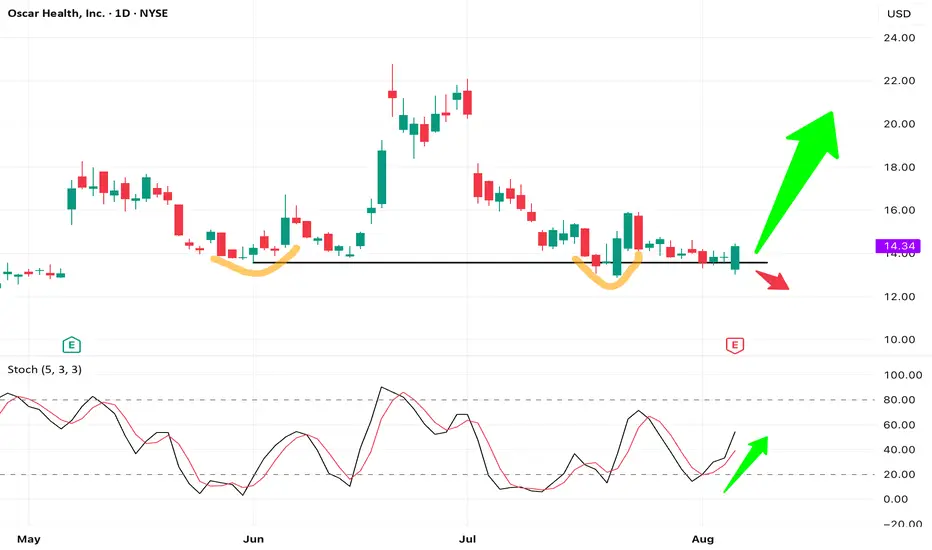
OSCR forming a Double Bottom – Bullish Reversal PotentialNYSE: OSCR - Oscar Health shows a potential double bottom, with a force bottom likely clearing stop-losses. Price has reclaimed key support, and stochastic is turning up, suggesting early bullish momentum.
Despite earnings missing estimates, the stock closed strong above support — a positive reaction to bad news. Risk and reward looks favorable at current levels.
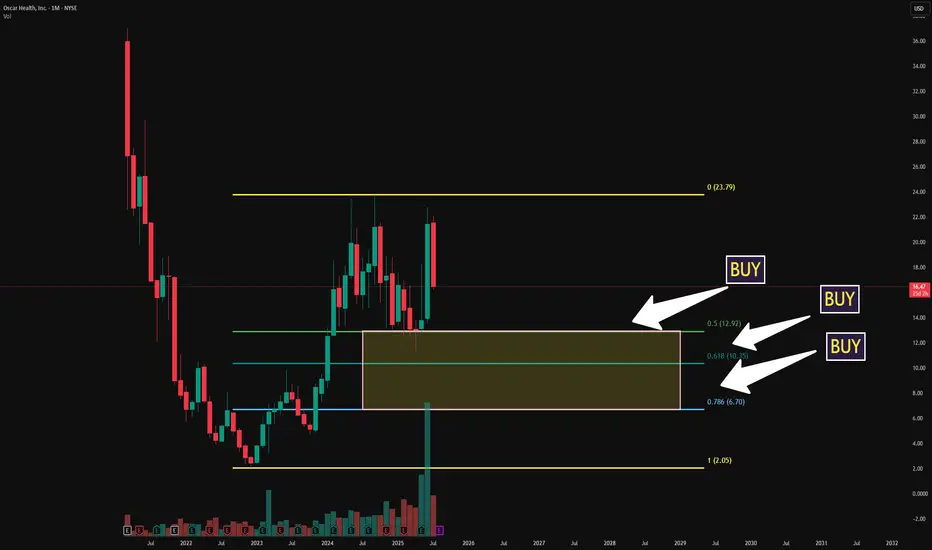
Oscar Health Stock Chart Fibonacci Analysis 080625Trading Idea
1) Find a FIBO slingshot
2) Check FIBO 61.80% level
3) Entry Point > 14/61.80%
Chart time frame:B
A) 15 min(1W-3M)
B) 1 hr(3M-6M)
C) 4 hr(6M-1year)
D) 1 day(1-3years)
Stock progress:A
A) Keep rising over 61.80% resistance
B) 61.80% resistance
C) 61.80% support
D) Hit the bottom
E) Hit the top
Stocks rise as they rise from support and fall from resistance. Our goal is to find a low support point and enter. It can be referred to as buying at the pullback point. The pullback point can be found with a Fibonacci extension of 61.80%. This is a step to find entry level. 1) Find a triangle (Fibonacci Speed Fan Line) that connects the high (resistance) and low (support) points of the stock in progress, where it is continuously expressed as a Slingshot, 2) and create a Fibonacci extension level for the first rising wave from the start point of slingshot pattern.
When the current price goes over 61.80% level , that can be a good entry point, especially if the SMA 100 and 200 curves are gathered together at 61.80%, it is a very good entry point.
As a great help, tradingview provides these Fibonacci speed fan lines and extension levels with ease. So if you use the Fibonacci fan line, the extension level, and the SMA 100/200 curve well, you can find an entry point for the stock market. At least you have to enter at this low point to avoid trading failure, and if you are skilled at entering this low point, with fibonacci6180 technique, your reading skill to chart will be greatly improved.
If you want to do day trading, please set the time frame to 5 minutes or 15 minutes, and you will see many of the low point of rising stocks.
If want to prefer long term range trading, you can set the time frame to 1 hr or 1 day.
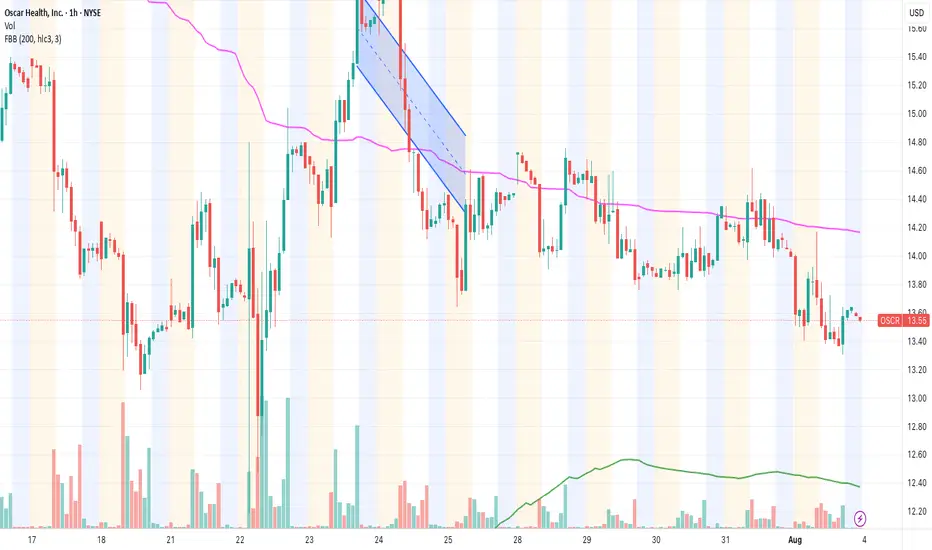
OSCR (Oscar Health Inc.) – BEARISH EARNINGS ALERTStrategy: Eagle Trap 🦅 | Bearish Confirmation 🔻
🟡 Current Price: $13.58
🔻 Trend: Bearish | Rejection at FBB 200 + Unfilled GAP
🗓️ Earnings: This Week
🔍 Quick Breakdown (35-criteria system):
✅ 32/35 bearish criteria confirmed
📉 Weak RSI, bearish MACD, trading below MA50 and MA200
📉 Rising volume on red candles
⚠️ Unfilled gap at $16.15
📉 Institutional outflows confirmed
📉 Projected EPS expected to disappoint again
❌ No positive catalysts detected
📉 Expected drop zone: $11.20 – $10.00
📉 Extended bearish target (if earnings miss): $8.00
🎯 Suggested Position:
PUT – Strike $13 or $12.5, expiration August 16
💰 Ideal entry: contracts below $0.80
📊 Risk/Reward: Very favorable
📌 Eagle Trap activated.
The chart shows technical exhaustion, lack of bullish momentum, and no upcoming positive catalysts. If earnings miss expectations, a sharp drop is likely.
📊 Are you ready to catch this fall?
OSCR will pumpOSCR was heavily shorted this past week despite growing fundamentals. The market seems split on the stock. I see heavy growth of baseline revenue, and operating cash flow turning positive. If the company makes 15 billion in revenue in 2023 with a 6% margin that will be 900 million in earnings. This would equate to a 30 billion dollar market cap with a similar multiple. If ICHRA can expand the way the CEO predicts, an untapped 100 billion dollar market awaits. Since Oscar has utilized Ai as they built the platform, their Margins should be higher than traditional insurance companies, they will be more efficient.
TA wise: I see a massive volume swell, resetting stochastic, and a cooling BBWP.
I will see covered calls around 16=18$ again and offload some LEAPs if we get another huge pump.
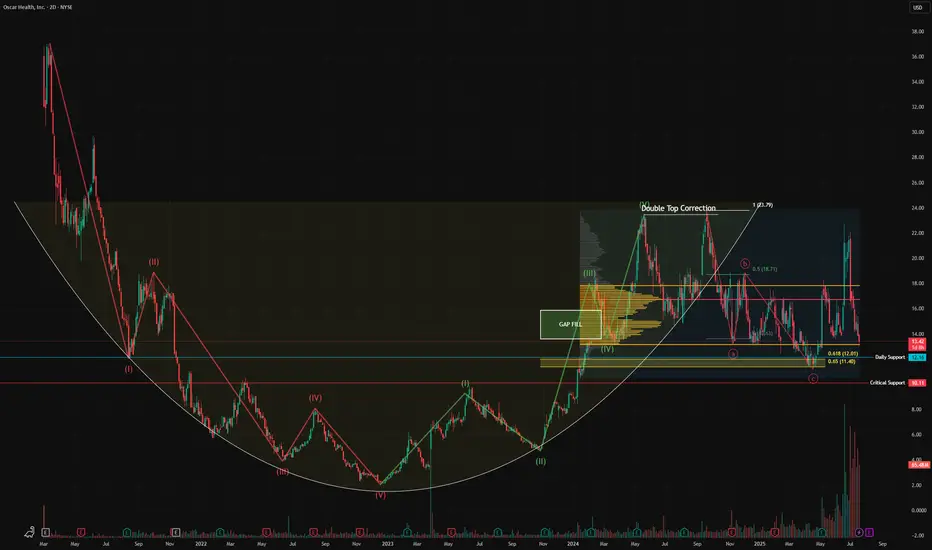
Oscar - Still bullish?Healthcare is under immense pressure, time to review the charts of the best names to own in possibly the mosted hated sector. Today I will look at Oscar Health. It's clear the trend remains down, but does this present an opportunity? Let's look at reasons to start a dca approach at key support levels:
- 43% drop from recent highs
- support coming in from the VAL
- support levels below include the golden pocket and daily support
- cup and handle formation
This could well present an opportunity for anyone who is particularly bullish on the fundamentals of this business. However, I must stress, if the critical support level is lost around $10 i'd be looking to cut my losses. Personally I will only be looking to add if we can find a base or have a reaction to the upside. Watch this closely, this stock has potential.
Not financial advice.
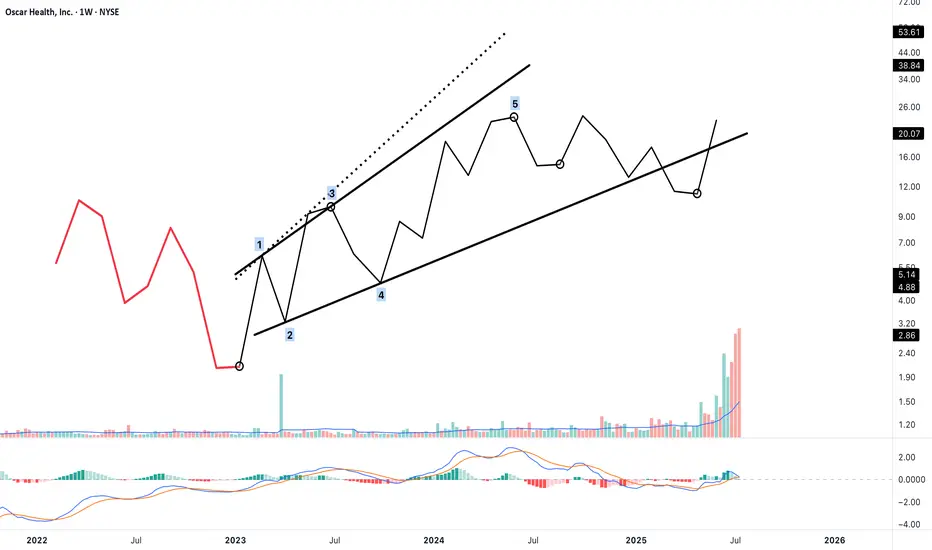
Possible Terminal Impulse as Wave 1 or A — Structure Completion?This chart presents a potential 5-wave terminal impulse structure — most likely a 5-extension terminal, where waves 1, 3, and 5 display impulsive character.
This move may represent the beginning of a new sequence — either as:
"Wave 1 of a larger motive structure"
"or Wave A of a corrective formation"
🔹 The wave is segmented using 12-bar intervals on a weekly chart.
🔹 Wave 3 and Wave 5 both meet the price extension and structural criteria of Neely’s Rule 4.
🔹 The final wave (5) reaches just above 141.4% of Wave 3, consistent with a 5-extension terminal.
🔹 Channel boundaries and post-terminal retracement suggest a completed structure.
According to NeoWave guidelines, the structure meets both:
Impulsive appearance, and
Overlap conditions required for a terminal.
The current focus shifts to analysing the post-terminal movement to determine whether it is part of a:
"2nd wave correction (if terminal was Wave 1)"
"or B wave retracement (if terminal was Wave A)"
🔍 Further bar-by-bar and structural analysis will be applied to this segment next, likely starting from m10 and beyond.
Oscar will go down to 10$ in next 3-4 months timeRecent Stock Pressure
Weak Q2 guidance from Centene weighed on sentiment, dragging OSCR down ~14%
.
Wells Fargo downgraded it to underweight, citing rising medical costs and pricing pressures in 2025
.
📊 Key Drivers for OSCR
1. 🩺 Healthcare Reform & the ACA / Medicare Advantage
Trump’s tariffs are targeted at pharma, not insurers. But if drug prices rise, costs trickle down to insurers like Oscar.
Conversely, Trump victories are seen as favorable for Medicare Advantage, potentially benefitting OSCR under a pro-Medicare Advantage regime
2. 💡 Growth & Momentum
Oscar recently posted strong Q1 results — 42% revenue growth and 45% share rally
The stock has explored the “meme stock”-like territory with ~52% weekly jump in June
🔍 What Trump Tariffs Mean for OSCR
No direct impact, as tariffs aim at imported drugs, not insurance firms.
Indirectly:
Higher drug costs → could pressure OSCR’s medical loss ratios
Meanwhile, political moves favoring Medicare Advantage and ACA stabilization could help OSCR
🌟 Outlook
Factor Impact on OSCR
⚠️ Downside risks Rising healthcare costs; regulatory uncertainty
✅ Upside catalysts Medicare Advantage tailwinds; continued execution & expansion
📉 Tech-driven momentum AI investments, ICHRA adoption, and growing RS rating (>90)
🔄 Volatility Meme-like spikes add risk—but also opportunity
🧭 Final Take
Trump tariffs on pharma won’t directly hit OSCR, but rising drug costs could hurt insurers if passed along to consumers.
Policy outlook (Medicare Advantage, ACA support) matters—bullish under Trump, bearish under heavier regulation.
OSCR is fundamentally a growth-tech-insurance stock, not a pharma or tariff play.
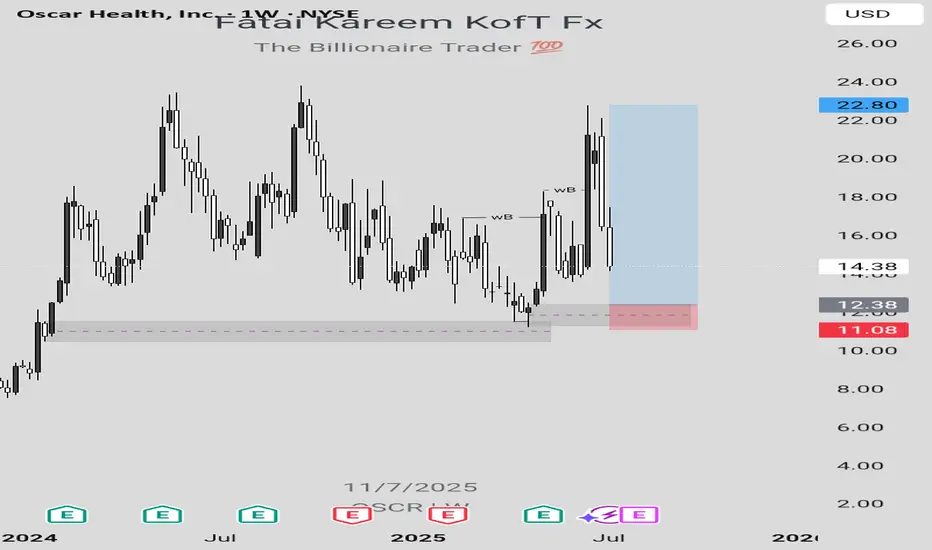
OSCR LONG IDEALooking at the weekly chart of OSCR stock, there's a long opportunity which can be taken advantage of to make some money provided that market follows the projection.
In order to take advantage of this long opportunity, a buy order limit can be placed at $12.38 while the exit can be at $11.09 and the final target can be at $22.80.
Confluences for this long idea are as follows:
1. Weekly break of structure
2. Valid Inducement (structural liquidity)
3. Orderflow
4. Sweep
5. Valid demand zone in the discount level
6. Imbalance
7. Pattern confirmation formed after mitigation of a demand zone indicating that there's a bullish change of trend.
Disclaimer: This is not a financial advice. The outcome maybe different from the projection. Don't take the signal if you're not willing to accept the risk.
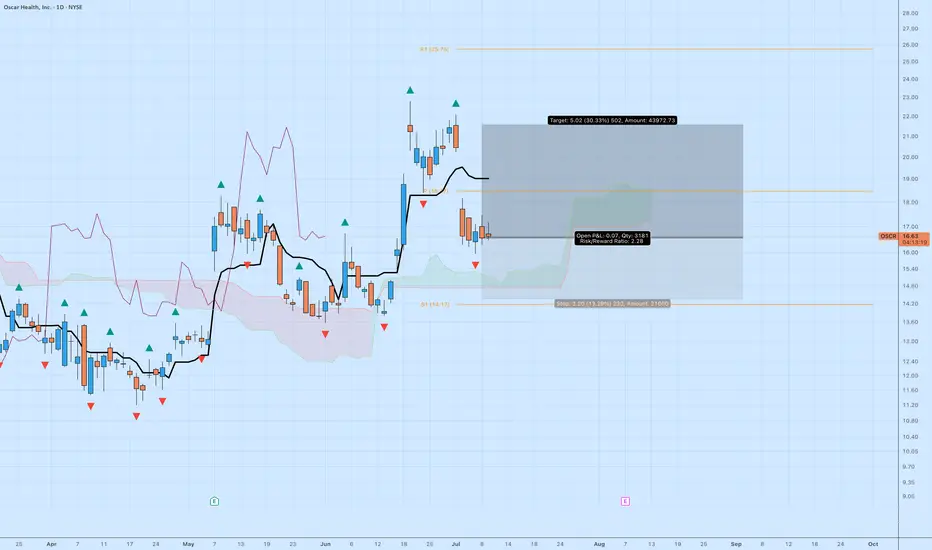
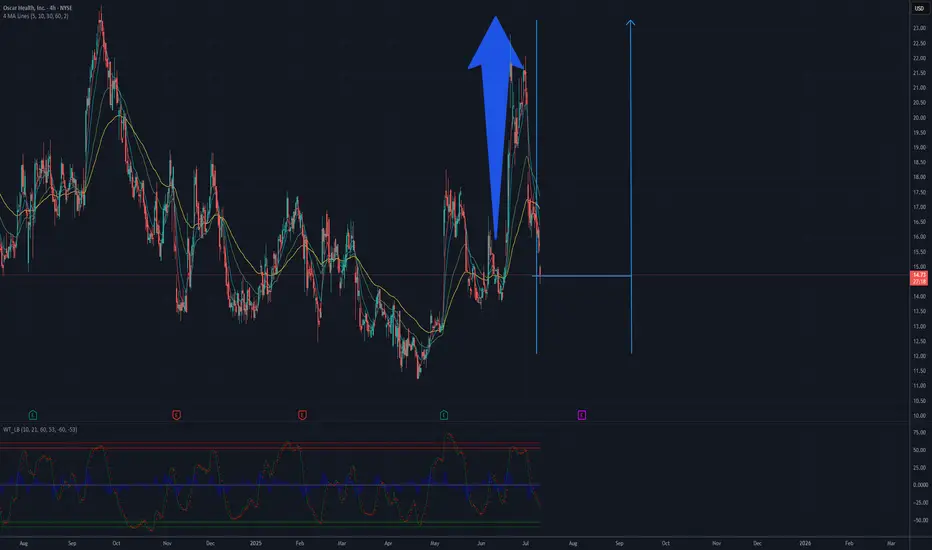
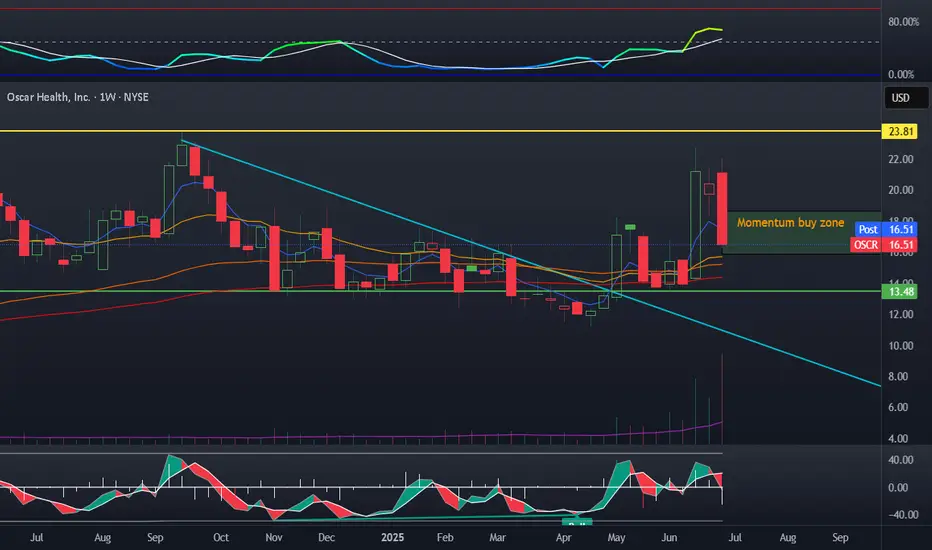
OSCR: Pullback Setup with 30% UpsideOscar Health NYSE:OSCR has pulled back into a logical area of support after a strong breakout in June. While the aggressive move may be over, this trade still offers solid upside with controlled risk.
🔍 Technical Breakdown
Price is basing above the cloud with a clean series of higher lows.
Ichimoku: Trend remains bullish, and price is holding the Kijun-sen.
MACD not shown, but momentum has stabilized after the initial thrust.
🎯 Trade Setup
Entry: ~$16.60
Target: $21.62 (+30.33%)
Stop: $14.40 (–13.29%)
Risk/Reward: 2.28 — attractive given current market conditions
This is a measured continuation setup — not aiming for the moon, just a reasonable trend extension.
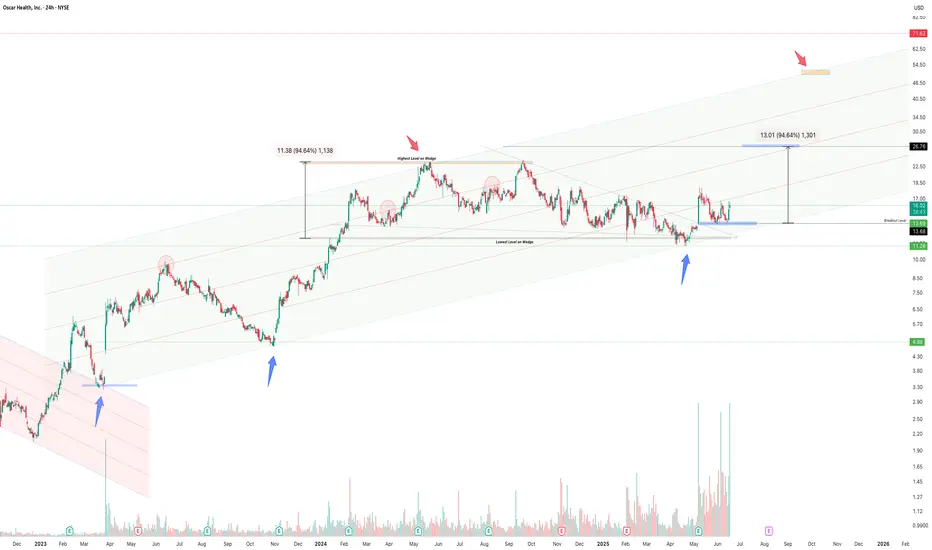
Oscar Health Bullish Continuation Oscar Health has broken out of a long descending wedge and is now resuming its broader bullish channel trend. With volume surging and smart money signals appearing near key supports, the chart targets a 94% measured move to $26.76, with the possibility of continuation toward $50.00 if trend strength persists.
A strong bullish structure remains valid as long as price stays above $13.68.
Potential Upside for OSCR.US – Targeting $23Oscar Health (OSCR.US) is currently trading near the technical support zone of $14–$15, a level that has historically acted as a base for rebounds. In May and June 2025, the stock saw sharp upward movements, breaking through the $20 mark, which confirms strong bullish potential. The current pullback may offer a buying opportunity before another upward leg. Once the resistance at $18–$20 is cleared, a move toward $23 — the September 2024 high — appears achievable. This scenario is supported by the technical setup and past price reactions at these levels.
Potential TP: 23 usd
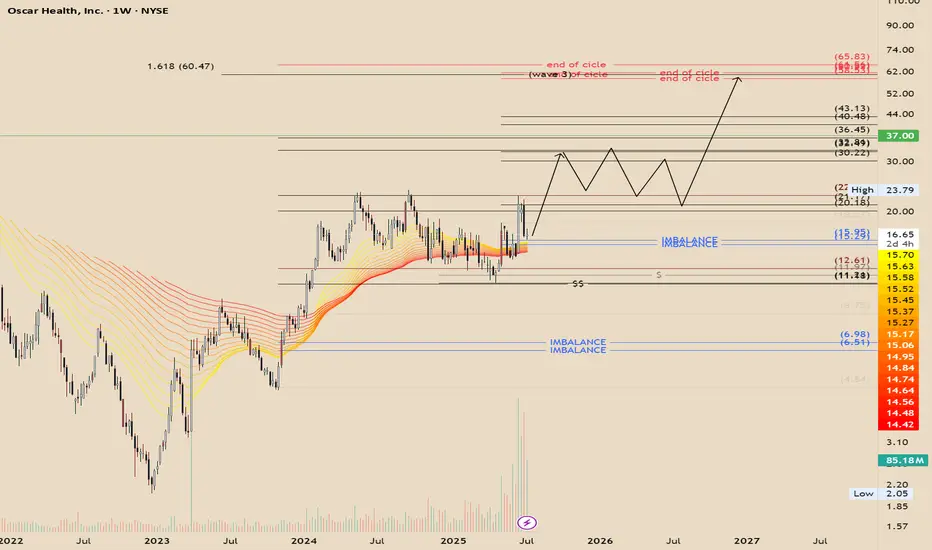
OSCR - Cyclical Expansion and Algorithmic ConfluenceOscar Health moves in cycles. It's possible to observe algorithmic confluence with the 3rd extension at 1.618 (~$60). The price reacted to the algorithmic expansion channel as expected and retraced to the equilibrium of the weekly bullish breaker. Therefore, the price behavior I anticipate is an aggressive expansion toward the next algorithmic level around $30, potential consolidation thereafter, and a final expansion toward the end-of-cycle target in the $60s.
This analysis is purely speculative and for educational purposes only.
OSCR: A bored phase accumulation before next up viewOSCR: A bored phase accumulation before next up view.
Consolidating in a tight range to absorb remaining supply before resuming the uptrend.
.
US STOCKS- WALL STREET DREAM- LET'S THE MARKET SPEAK!
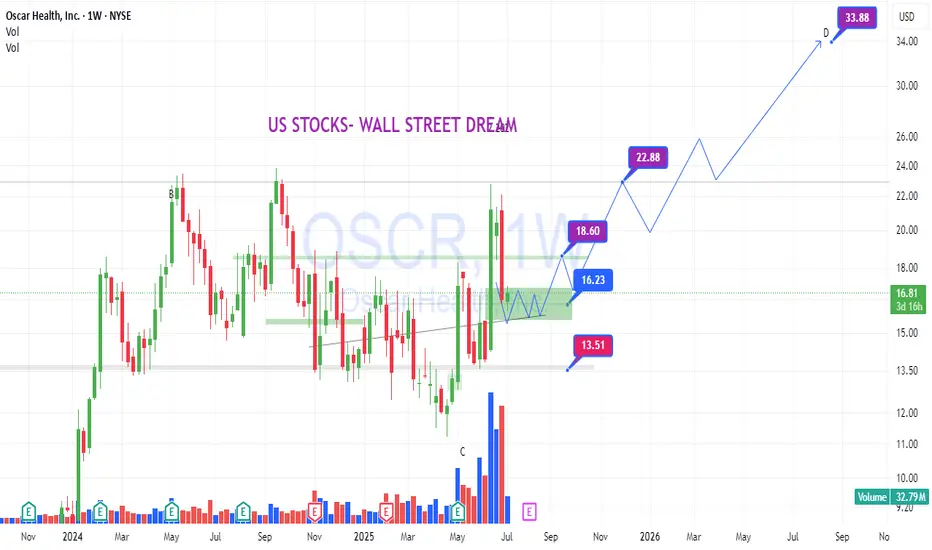
$OSCR ONCE IN A LIFETIME Fibonacci Pyramid Long Term PlanNYSE:OSCR ONCE IN A LIFETIME Fibonacci Pyramid Long Term Plan
Buys: 12.92 10.35 6.70 Target 30🎯
When I posted these pull backs people thought I was crazy now be ready
I plan to LAYER OPTIONS and SHARES
Drop a LIKE if ur DOWN!
OSCR a buy OSCR I have added to the position after the correction. Ive had a few rounds of covered calls collected. We note a nice FUD based correction on the stock, this will allow stochastic to fall alongside volatility. This will also allow the moving averages time to catch up.
My plan:
Sold 16$ CSP, bought shares around 16$, sold covered calls when price was higher, today I also bought 20$ September calls.
$OSCR long PT: $30-60 range- Undervalued Healthtech company growing revenue double digits.
- PEG < 1
[OSCR] OSCR InvestmentInvestment on this healthcare stock for the long term.
I am expecting a huge upside move for the next months/years as it's the future of healtcare services. I want to hold it for a long time so let's see what it can offer us.
Great Trade !
7/1/25 - $oscr - Dip buying AH at mid 17s7/1/25 :: VROCKSTAR :: NYSE:OSCR
Dip buying AH at mid 17s
- stock running for good reason
- NYSE:HIMS of insurance type
- NYSE:CNC is pee'ing in the narrative, but NYSE:OSCR guide unaffected
- I'd expect to pick up a MSD gain here
- I have limits into the 16's tn where i'd rather own more
V
