$PYPL | WEEKLY WATCHLIST 1/10$PYPL 1D
Been continuously warning of the uncertainty of this one. Looks like it wants the projected leg down in the coming few weeks.
Watching the $160-170 area for support, otherwise mid $130s possible before recovery begins.
PYPL trade ideas
Historically, it’s time to buy Any time PayPal’s PE reaches these levels, it rips to the upside. It seems high in the mid 40s, but it’s expensive for a reason.


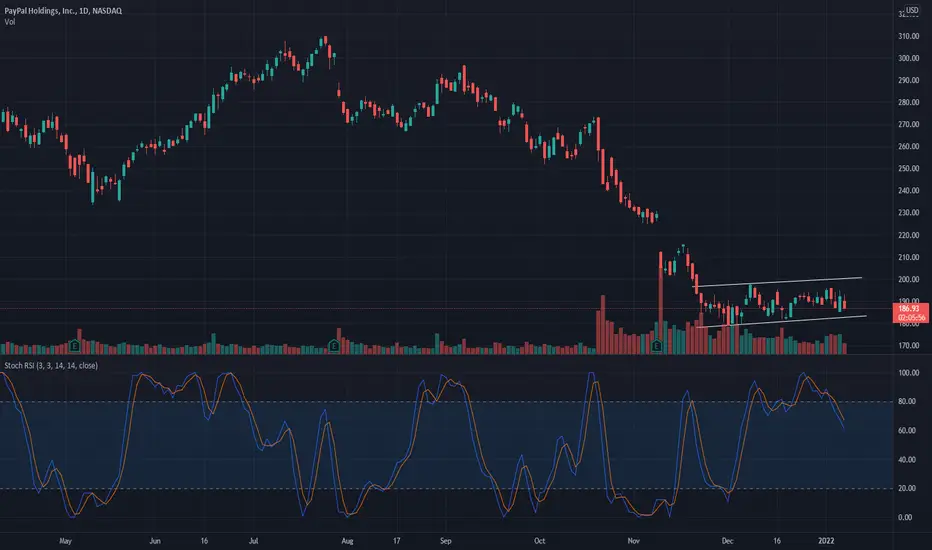
$PYPL forming a basePayPal is forming a base and will soon retest the $198 level, with good volume this will break above.
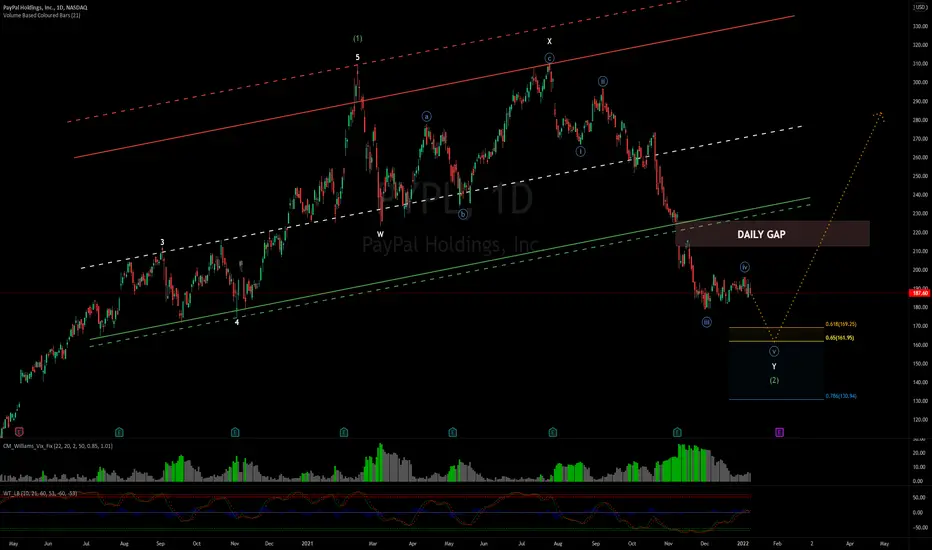
PAYPAL DOWNISDE TARGET WAVE 4 ENDED LOOK FOR 162/154 PYPL seems to finally ending its abcde 4th wave triangle I been waiting to see unfold .We should see new lows and I hope it is on heavy vol to end its declining wave structure most fib relationships are in the 162 to 154 area do not catch this falling knife yet .

$PYPL failure today...All tech is down hard today, but $PYPL actually relatively weak vs the $QQQ as a whole. Unless this recovers hard, looking like I will need to get out and move on. $BA working as planned, don't need to fight the trend if we can recover to at least $192...

$PYPL set upday trading set up and psychology behind the madness trading with @spankdaddybaby support resistance RSI bs and theory


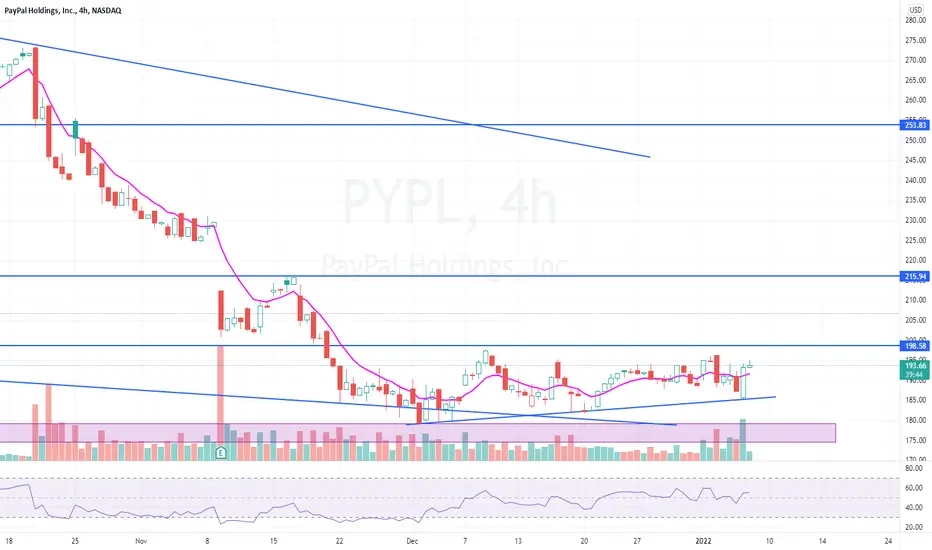
$PYPL 2hr TFset up looks legit AF but not liking the pattern left behind as i feel it needs to come back down and close out purple line 183.13. indicator shows resistance at closing. Noticing some bearish divergence on RSI as well. Good luck to all

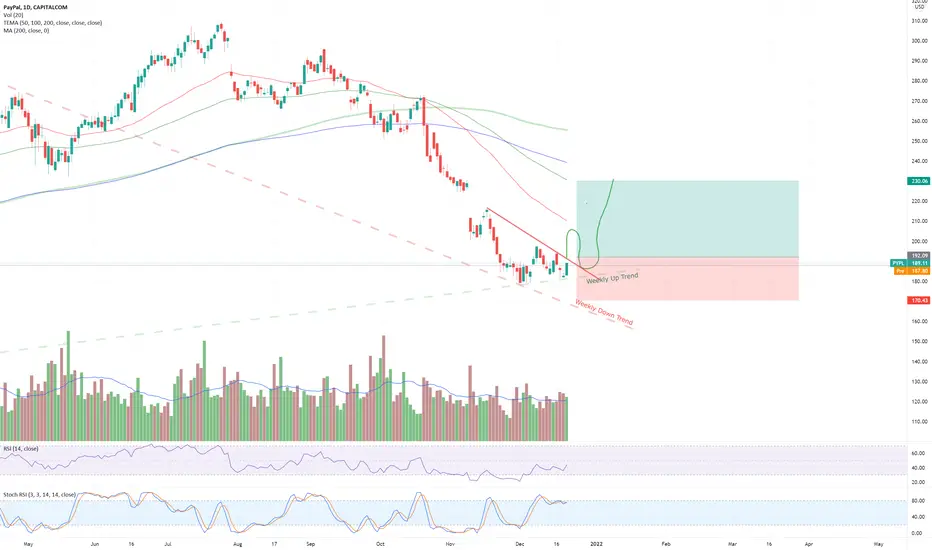
#PayPal bouncing on weekly supportPYPL Is looking forward to a strong recovery. We had a nice bounce of the weekly support. A potential gap-fill to the upside is in the play.
PayPal is a strong company with good fundamentals. I believe the current price is not fare and we should visit $200+ channel soon.
I am planning to add to my long position as soon as we break the local downtrend and add more on retest of the same downtrend.
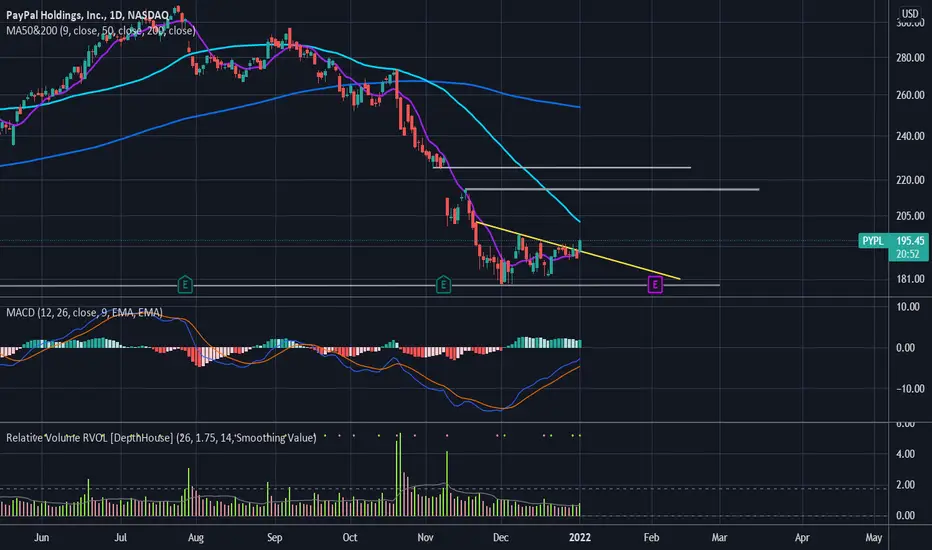
Breaking out with volume ~$225 PTOnce this breaks through the 50sma on the daily, this will probably fill gap at $225.
$PYPL 2022 UpdateGreat start to the year for $PYPL, wanted to get over $190 quick and hold. So far so good, now we need to continue this and test over $200 this week. If we hold over $195 I will be happy as well. Target is a gap fill of the $215-$224 by end of the month.

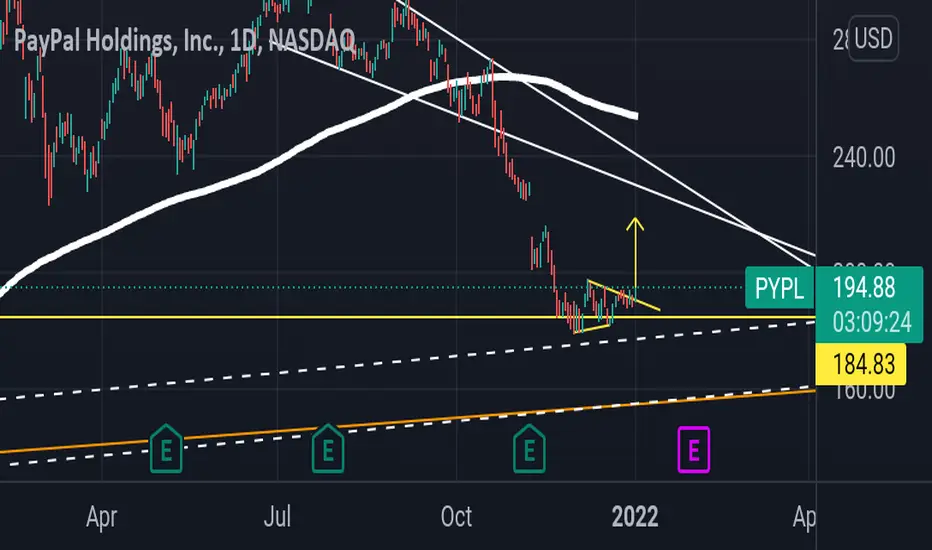
PayPal expectations for 2022PYPL (PayPal) is at the bottom of monthly correction and from here I expect it to bounce to at least 0.382 fib, or even to 0.5 fib.
However I expect it to go sideways till at least February 10 to complete a small monthly candle.
We can expect turnaround in February-March, but we will see how support holds the price.
The best entry will be at trendline breakout, which hasn't formed yet.
This analysis is more like a discussion/possible prediction, there's no entry at the moment, but there's definitely a possibility in the future.

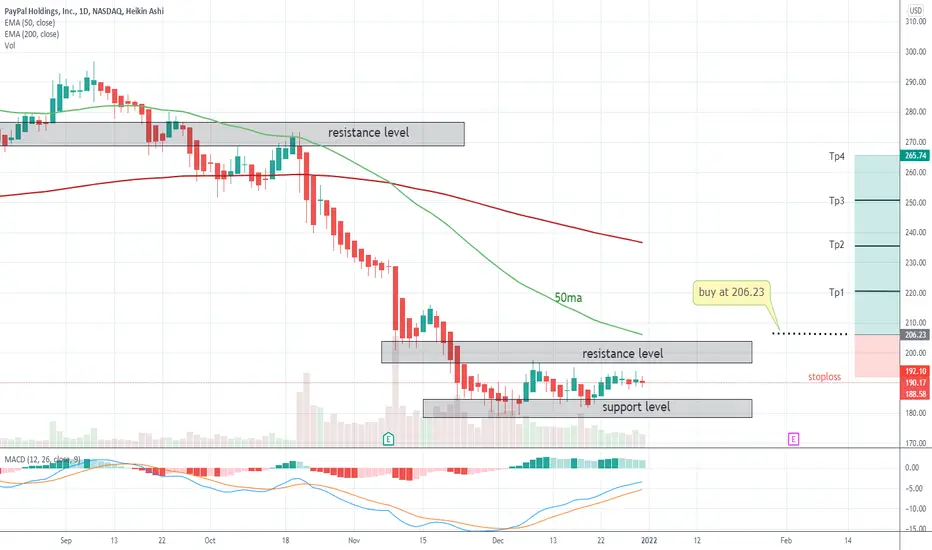
pypl buypypl buy .. buy above the resistance level and 50ma at 206.23 .. target point next resistance level at 265.74 ...

PAYPAL STOCK BUY (NEWJERUSALEMFOREX)We consider buying this paypal stock because of a strong support below. We know what we are doing and we do what the market is doing. This is more than an institutional analysis. Invest wisely. Thank you for following me on tradingview.
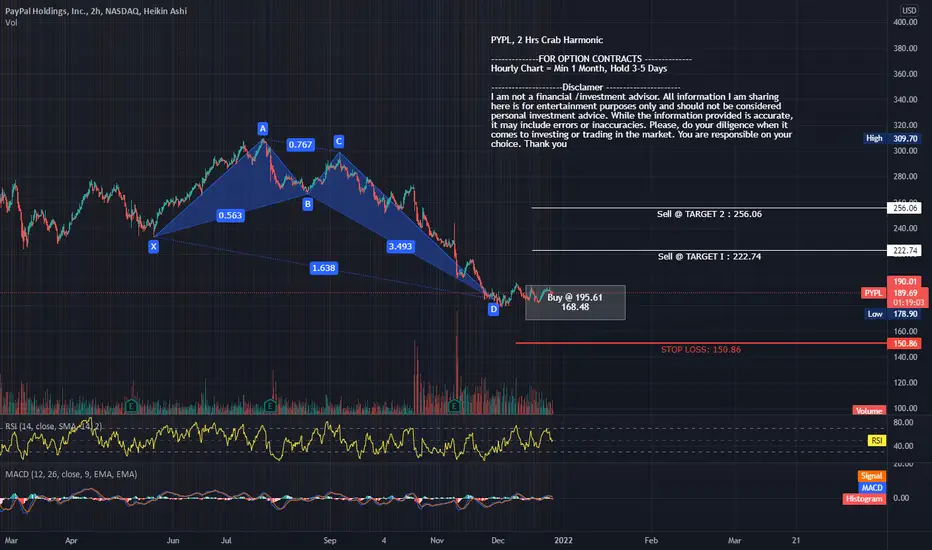
PYPL, 2 Hrs NASDAQ:PYPL . PYPL, 2 Hrs Crab Harmonic
--------------FOR OPTION CONTRACTS --------------
Hourly Chart = Min 1 Month, Hold 3-5 Days
---------------------Disclamer ----------------------
I am not a financial /investment advisor. All information I am sharing here is for entertainment purposes only and should not be considered personal investment advice. While the information provided is accurate, it may include errors or inaccuracies. Please, do your diligence when it comes to investing or trading in the market. You are responsible on your choice. Thank you
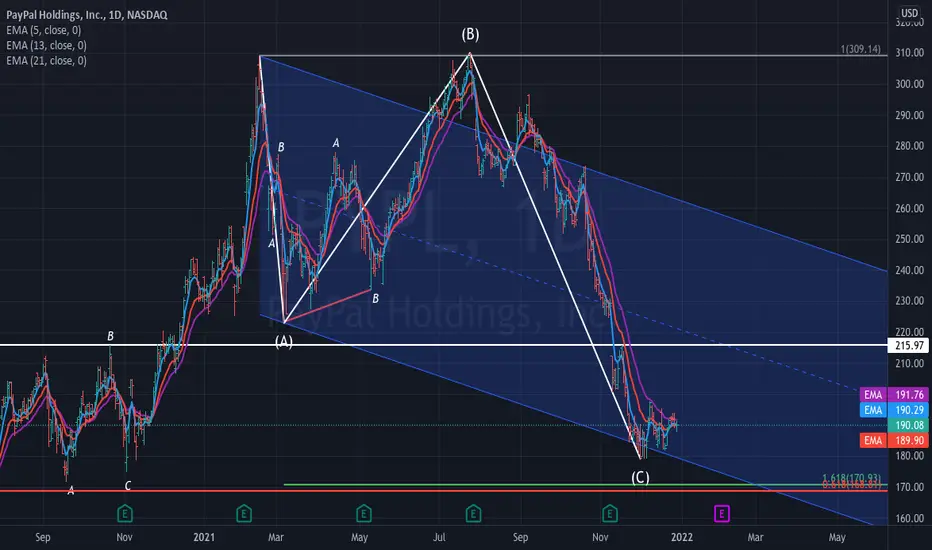
Nearing Support or Completion on $PYPLHere we have a flat correction finding support or nearing completion in $PYPL. Waiting for a trigger before entry. A safe entry level will be taking out $215.97 impulsively.
$PYPL update...We are still good, nice retest of the $189's and recovered to close over $190. Didn't like the sell off at $194, but we'll have to take it and move on to the end of the week and see if we can break it next attempt.

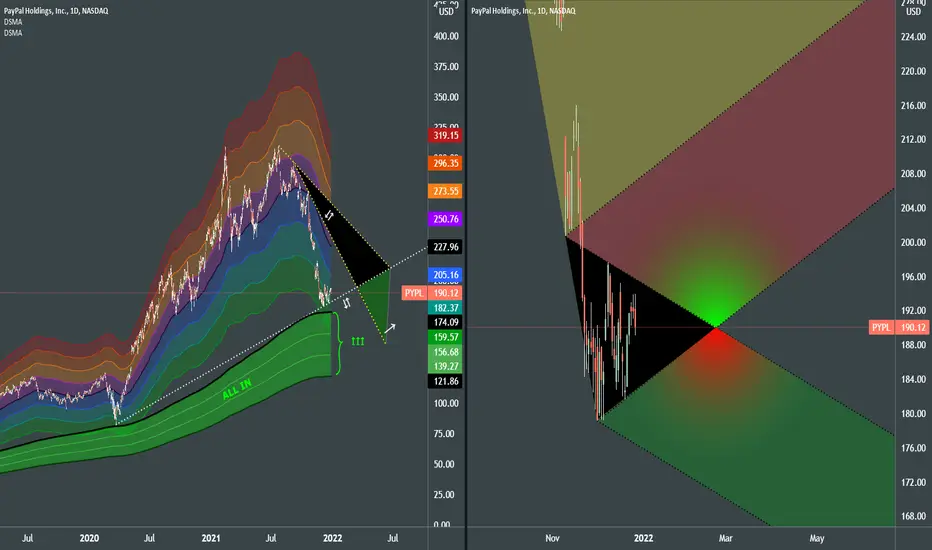
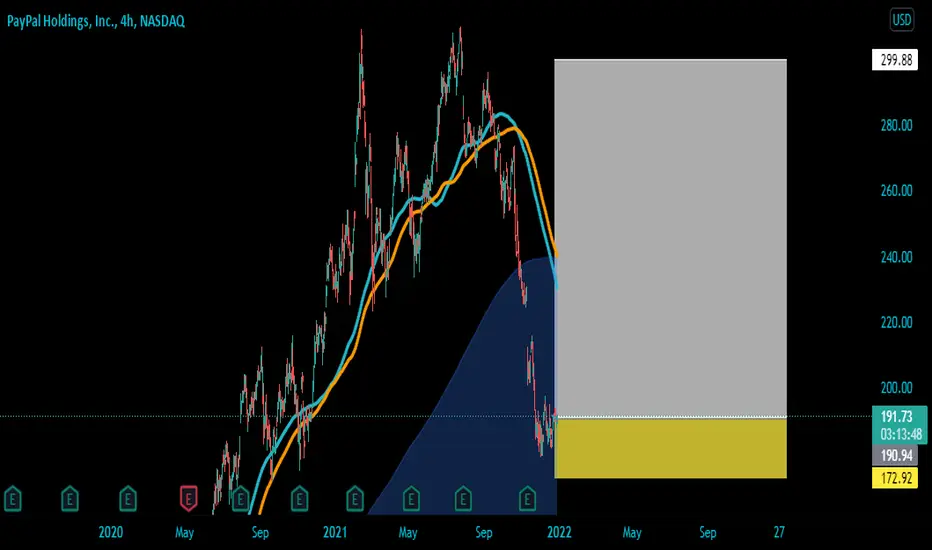
Paypal OpportunityAfter serious decline it's about time to expect some sort of pullback. I mean a drop from 310 to current prices must trigger new wave of inverstors entering the market, as low levels are attractive for those who missed out.
It's already inside demand range colored from blue to green. Overall I qualify this as buy. However we know that markets are unpredictable, hence I deduce that there is a slight chance of falling further even a little bit.
That's why there is a "safety pillow" light green Demand MA's that will reverse the market at higher chance than current DSMA.
Now it's been quite a while that price is testing white dotted support line, the longer time it takes for price WITHOUT CROSSING below the line, the higher the chances get for market reversal without another drop.
A breakout of triangular shape is the signal of thinking about long entry.