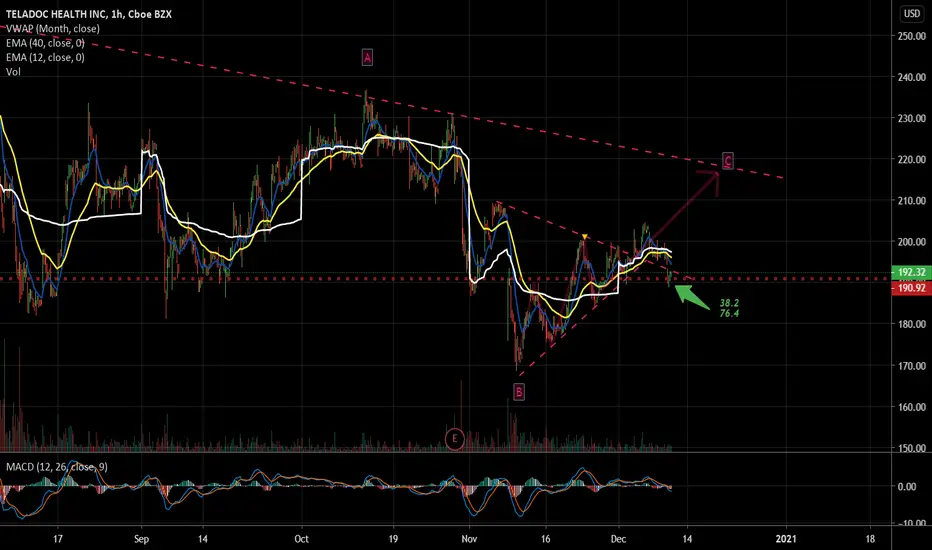
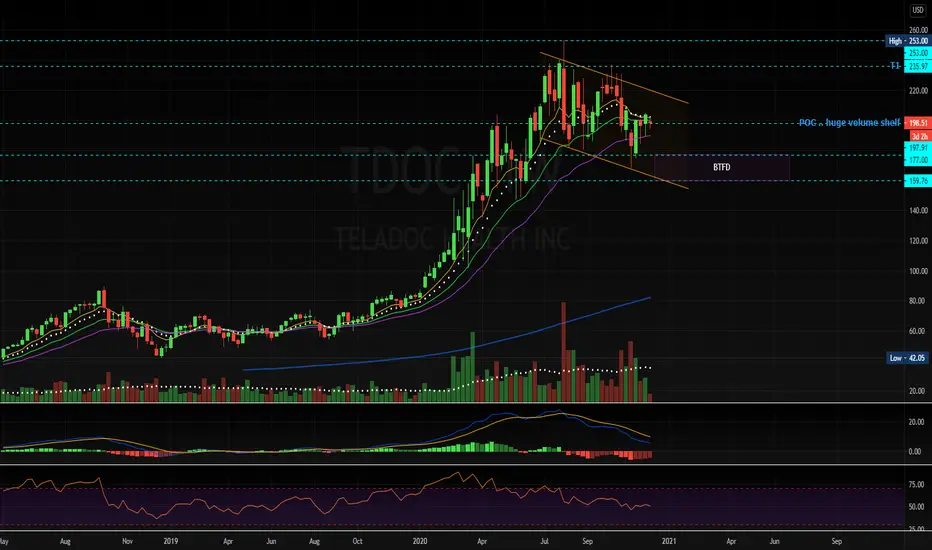
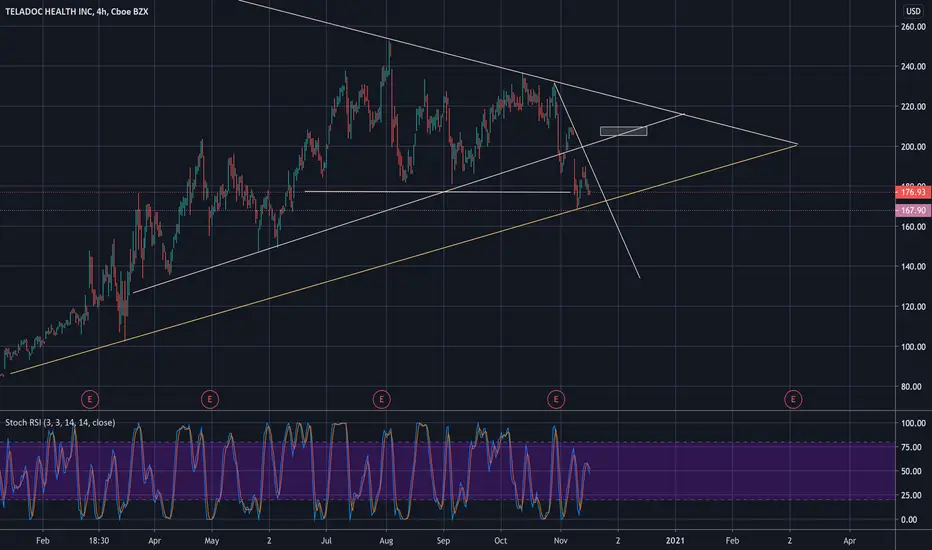
Setting up to break through important resistanceTDOC is consolidating below an important level of 200. There remains little buying beyond this level, however, buyers seem to be stepping up. Both anchored VWAPs from ATH and bottom of the break down and may serve as support and resistance levels. If it break 200 at good volume and closes above the anchored VWAP from the ATH, it has a potential to retrace back to mid 200's.
TDOC trade ideas
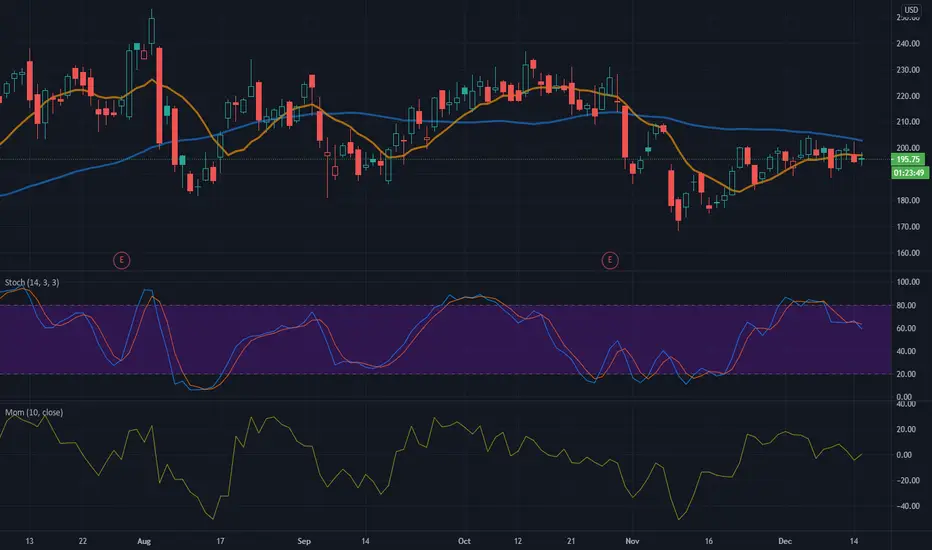
TDOC, enters Downtrend as Momentum drops below 0 level on Dec 14This indicator may be signaling that TDOC's price has further to drop, since it fell below its price logged 14 days ago. Traders may consider selling the stock, shorting the stock, or exploring put options. Tickeron's A.I.dvisor backtested 81 similar cases where TDOC's Momentum Indicator fell below the 0 level, and 68 of them led to a successful outcome. Odds of Success: 84%. Current price $195.72 crossed the resistance line at $194.71 and is trading between $201.36 resistance and $194.71 resistance lines. Throughout the month of 11/11/20 - 12/14/20, the price experienced a +7% Uptrend, while the week of 12/07/20 - 12/14/20 shows a -1% Downtrend.
Bearish Trend Analysis
The Stochastic Indicator may be shifting from an upward trend to a downward trend. Tickeron A.I. detected that in 55 of 74 cases where TDOC's Stochastic Oscillator exited the overbought zone, the price fell further within the following month. The odds of a continued downward trend are 74%.
The Momentum Indicator moved below the 0 level on December 14, 2020. You may want to consider selling the stock, shorting the stock, or exploring put options on TDOC as a result. In 68 of 81 cases where the Momentum Indicator fell below 0, the stock fell further within the subsequent month. The odds of a continued downward trend are 84%.
TDOC moved below its 50-day Moving Average on October 30, 2020 date and that indicates a change from an upward trend to a downward trend.
The 10-day Moving Average for TDOC crossed bearishly below the 50-day moving average on November 03, 2020. This indicates that the trend has shifted lower and could be considered a sell signal. Tickeron A.I. detected that in 13 of 15 past instances when the 10-day crossed below the 50-day, the stock continued to move higher over the following month. The odds of a continued downward trend are 87%.
Following a 3-day decline, the stock is projected to fall further. Considering past instances where Apple declined for three days, the price rose further in 50 of 62 cases within the following month. The odds of a continued downward trend are 74%.
The Aroon Indicator for TDOC entered a downward trend on November 18, 2020. This could indicate a strong downward move is ahead for the stock. Traders may want to consider selling the stock or buying put options.
$TDOC - 2021This stock struggles with the $200 level, to say the least.
I still like grabbing the dips to increase my position for a 2021 take off.
It has 138% YTD growth and ARK has it in three of its ETFs.
That's good enough for me. Technology enabled, in the top 10 of 3 out of 5 of ARK's ETFs. I will continue to build my long term position.
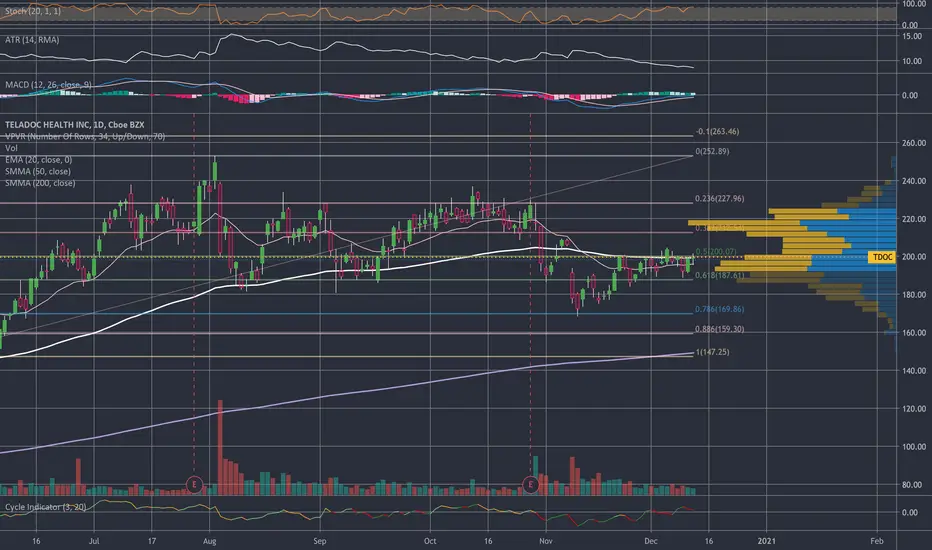
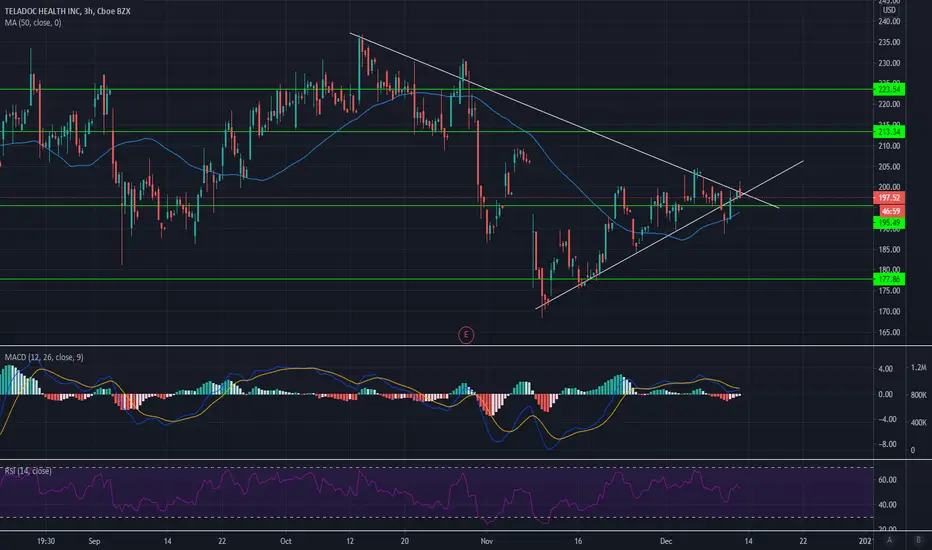
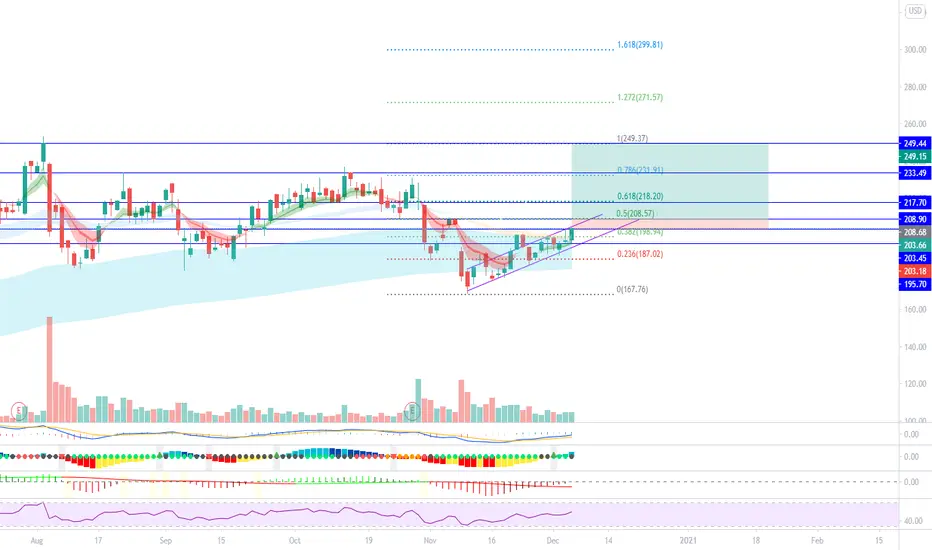
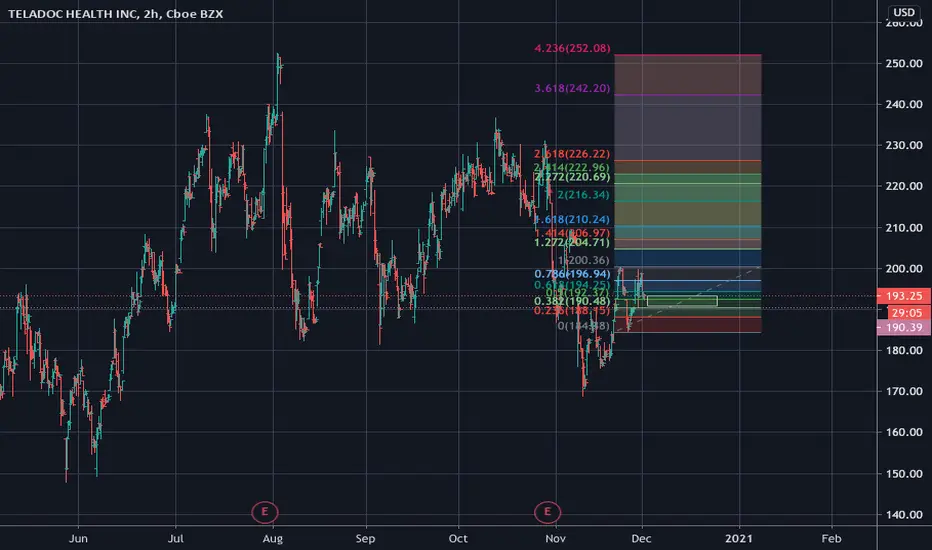
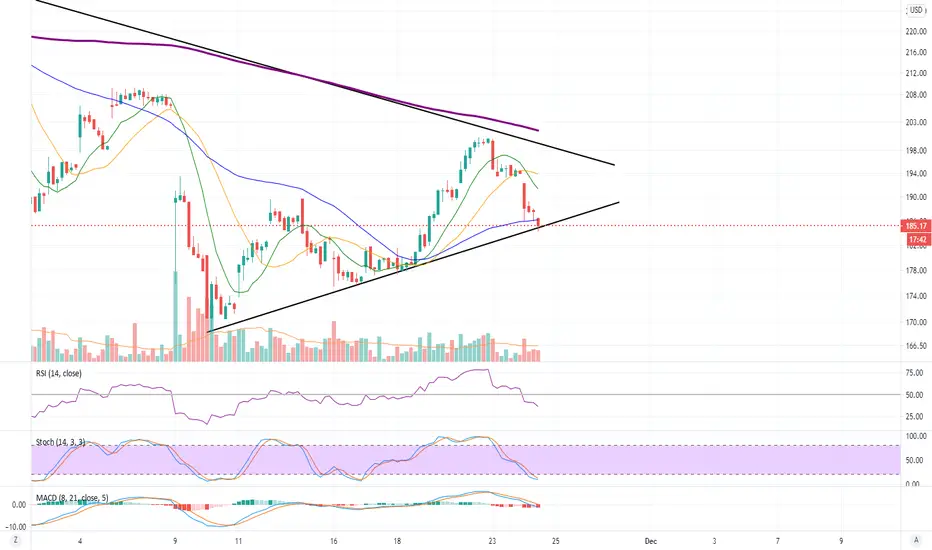
TDOC, reacting to FIB levelsThe price seems found good support to the current levels,
Have to wait for a bullish signal before joining
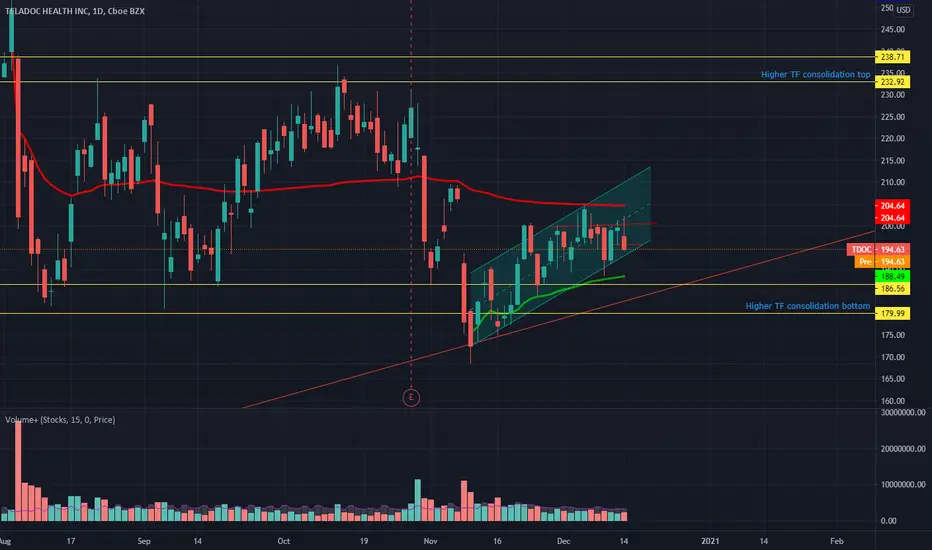
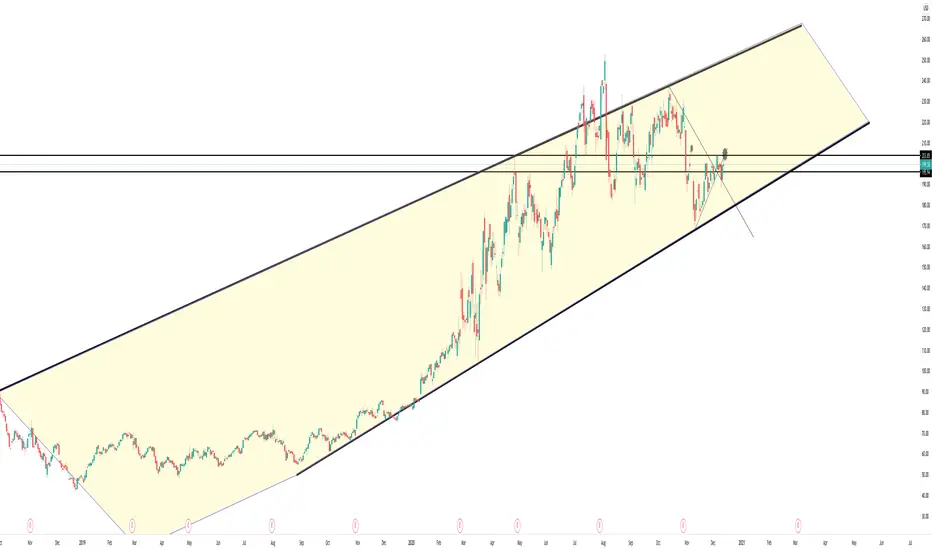
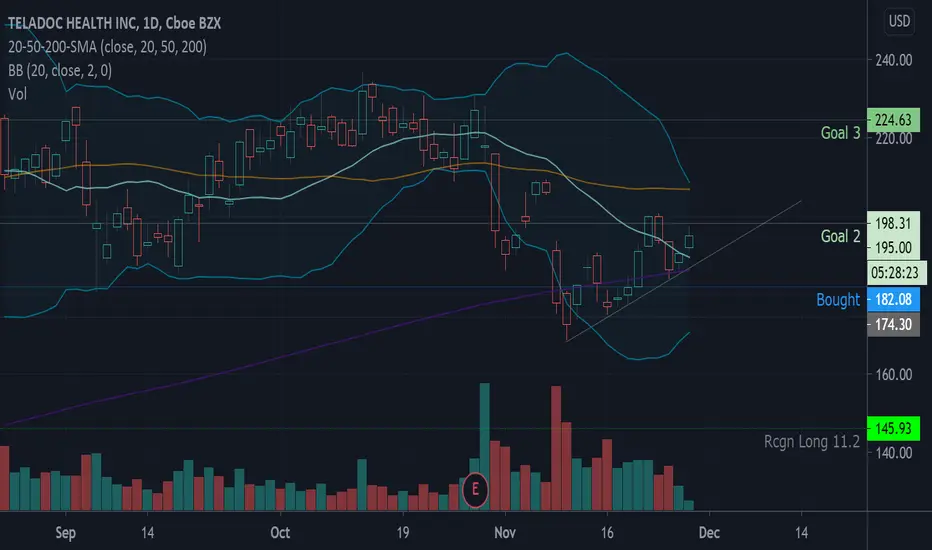
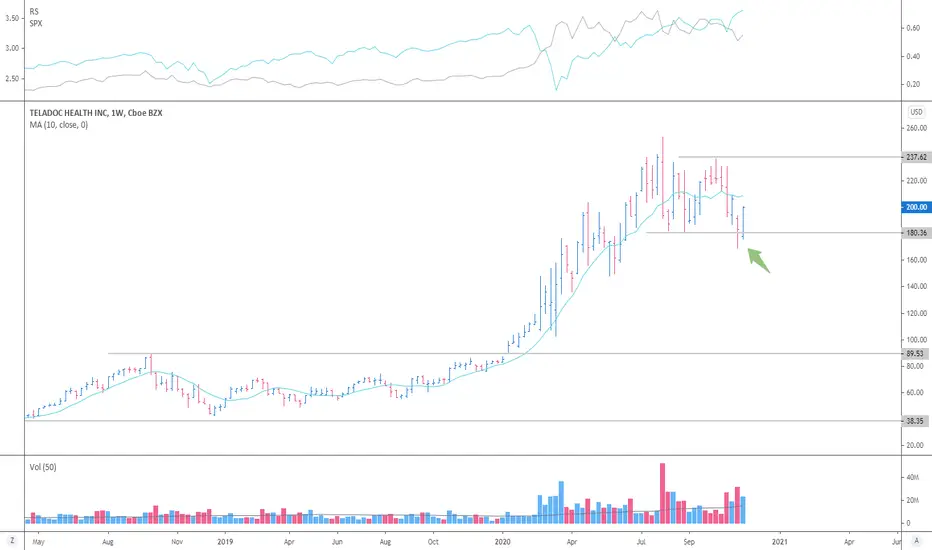
Respecting the long trend support - BULLISHARKK continues to add and so do we on every dip below $200. Expecting a breakout any time in the next several weeks. Bullish divergence. LONG
TDOC Long to ATH+Trigger: $208.60
Stop Loss: $203.50
PT: $218, $232, $249, $271, $300
1/15/2021: 220/250C
4/16/2021: 250/270C
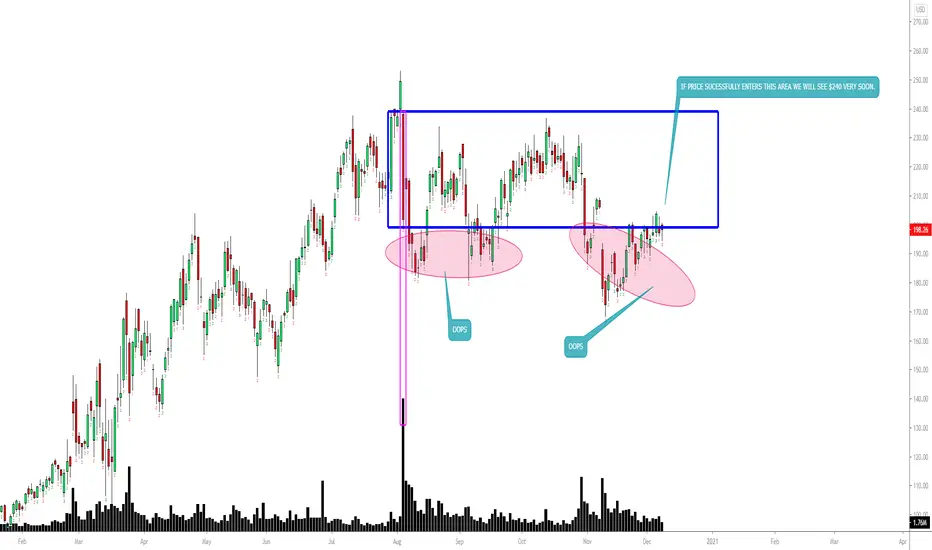
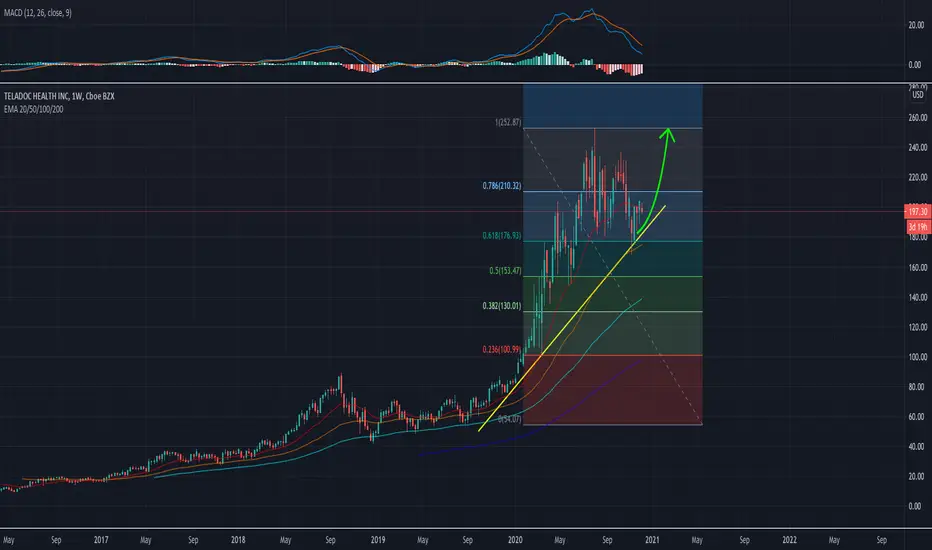
TDOC Long SetupSticking with the COVID beneficiary theme like my earlier posts.
Needs to get over $200 for a first target area of $220. If it can get through $220 - $225, this stock has $275 potential in the coming months.
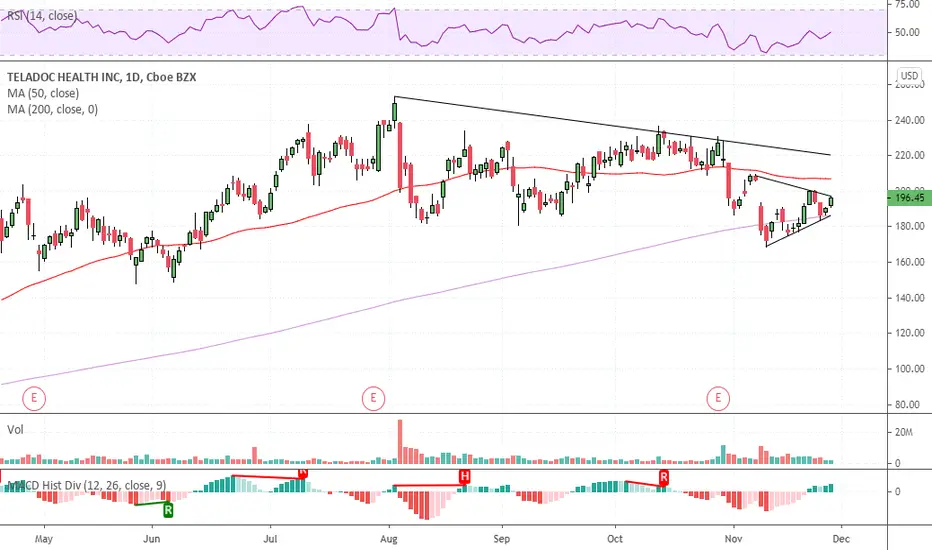
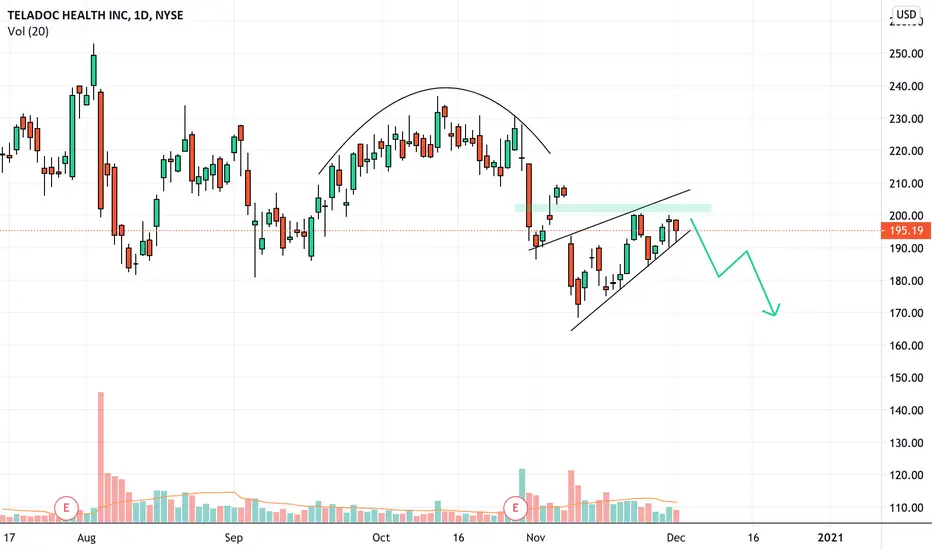
$TDOC Bearish Trade Set Up Inverted cup & handle + rising wedge on the daily. If this analysis was helpful please LIKE and FOLLOW for more!
TDOC Looking to BounceLooking forward to TDOC to closing above the trendline and hopefully move upward
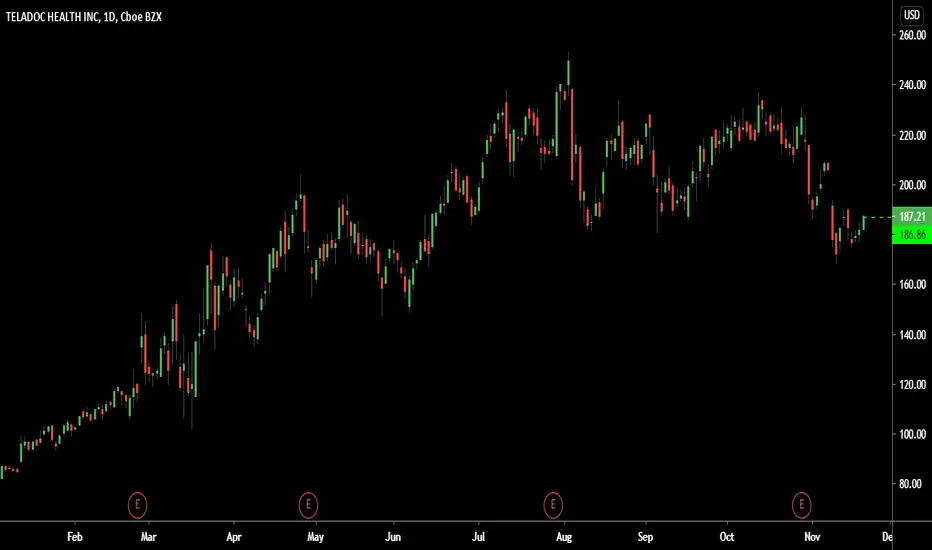
TDOC, enters Uptrend as Momentum ascends above 0 level on Nov 23This indicator may be signaling that TDOC's price has momentum to move higher, since its current price exceeds the price logged 14 days ago. Traders may consider buying the stock or exploring call options. Tickeron's A.I.dvisor backtested 82 similar cases where TDOC's Momentum Indicator exceeded 0, and 66 of them led to a successful outcome. Odds of Success: 80%. Current price $187.21 crossed the support line at $187.73 and is trading between $187.73 support and $181.15 support lines. Throughout the month of 10/22/20 - 11/23/20, the price experienced a -10% Downtrend, while the week of 11/16/20 - 11/23/20 shows a +10% Uptrend.
Bullish Trend Analysis
The Momentum Indicator moved above the 0 level on November 23, 2020. You may want to consider a long position or call options on TDOC as a result. Tickeron A.I. detected that in 66 of 82 past instances where the momentum indicator moved above 0, the stock continued to climb. The odds of a continued upward trend are 80%.
The Moving Average Convergence Divergence (MACD) for TDOC just turned positive on November 20, 2020. Looking at past instances where TDOC's MACD turned positive, the stock continued to rise, Tickeron A.I. shows that in 40 of 52 cases over the following month. The odds of a continued upward trend are 77%.
Following a +9.97% 3-day Advance, the price is estimated to grow further. Considering data from situations where TDOC advanced for three days, in 301 of 359 cases, the price rose further within the following month. The odds of a continued upward trend are 84%.
TDOC may jump back above the lower band and head toward the middle band. Traders may consider buying the stock or exploring call options.

$TDOC Teladoc Health Bullish trade setup. 💉💉💉
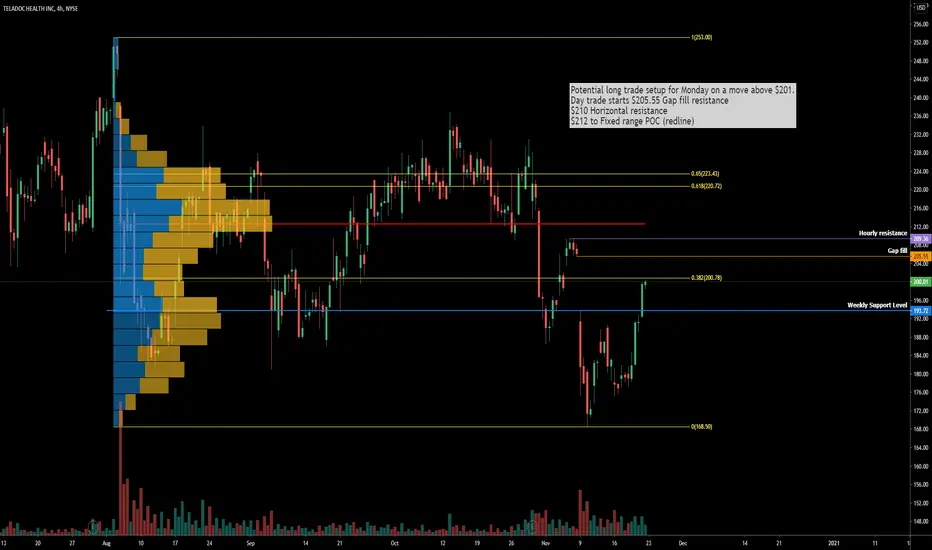
Potential long trade setup for Monday on a move above $201.
Day trade starts $205.55 Gap fill resistance
$210 Horizontal resistance
$212 to Fixed range POC (redline)
TDOCNot my typical style, but looks like we have a undercut & rally situation; pullbacks buyable due to a favorable R/R
Buy Signal: 187.07 #stocksIngenuity Trading Model
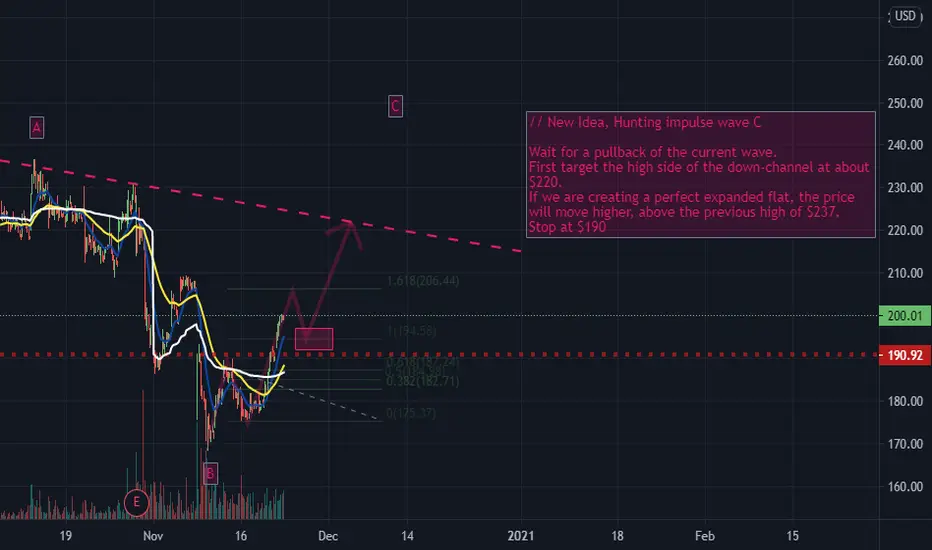
Geometric Markov Model : In probability theory, a Markov model is a stochastic model used to predict randomly changing systems. Markov Models are used in all aspects of life from Google search to daily weather forecast. The randomly changing systems we focus on are the equity, futures, and forex markets. The geometric element of the model is the fractal wave structure you can find on any chart you look at across any market and across all time dimensions.
Our model focuses on the current wave formation (current state)- geometric price formation along with its volume and volatility over a given time period and using that information to predict the future state- future price movement.
TDOC small bounceTDOC has been under heavy selling pressure. They will have a small bounce and it is after all a cover stock.
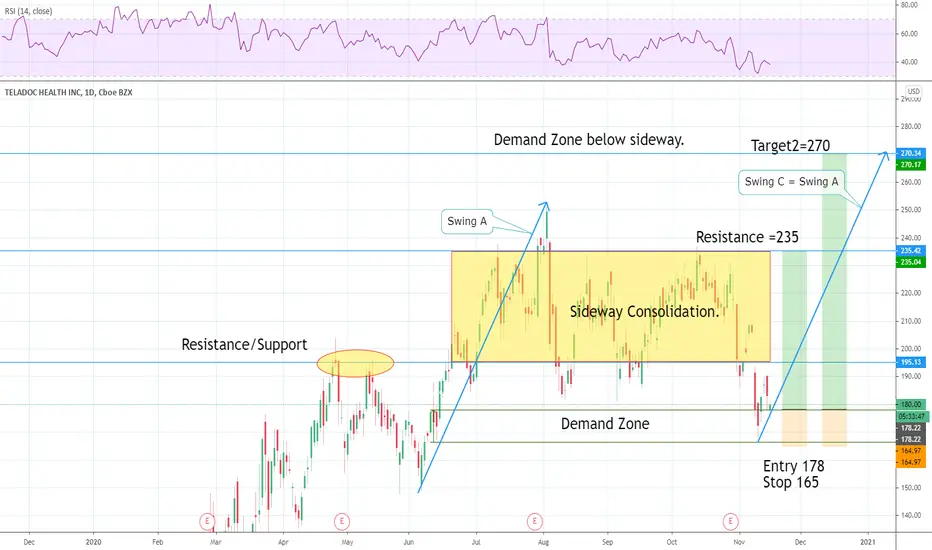
TDOC LongDemand Zone below sideway.
Entry 178
Stop 165
Target1: 235
Target2: 270; ABC Pattern.
I am not a PRO trader. I need few months to practice trading strategies.
If you like this idea, please use SIM/Demo account to try it, until my trading plans get high winning rate.