TGT trade ideas
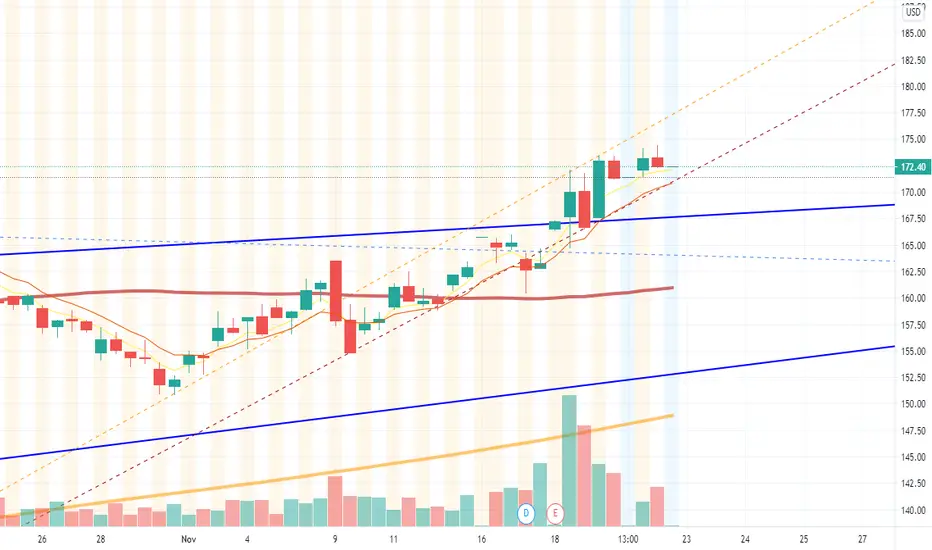
TGT Target Play for Pullback to 180 testTGT
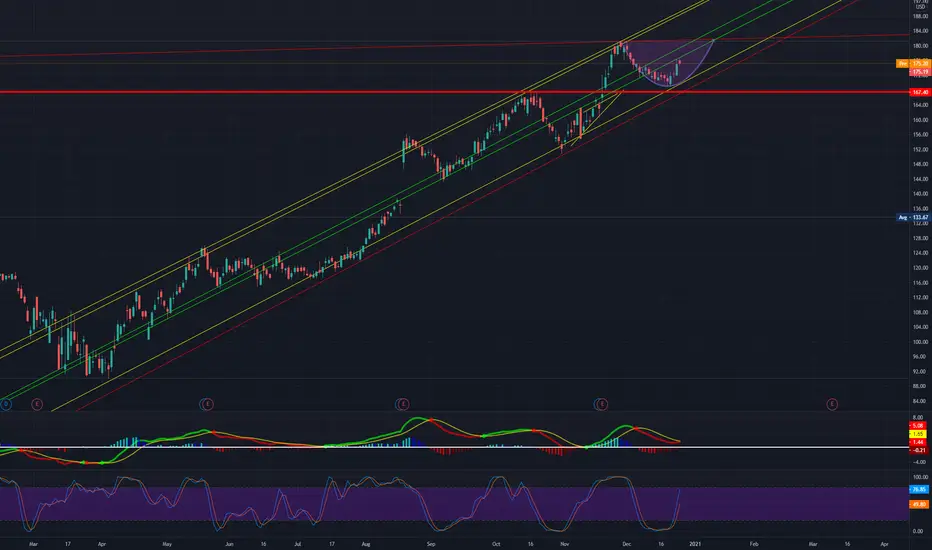
Target pretty much top of channel that extends back further than shown here
Might be decent opportunity to seek a pullback test 180 previous high...
Had quite the move recently
Options Call open interest all around 185s Jan & Feb
Though its not really a heavily traded options name
Also it's not a super liquid name in general so is prone to decent gappy moves +/-
Earnings in March
Looking to play the 180 Puts in some sort of spread most likely...Maybe the 185s depending on how it open today, hopefully it doesn't gap down before I get the chance to open the position
I'm assuming stimulus check hope is priced in after GA elections and that could be one of the drivers of this recent surge higher

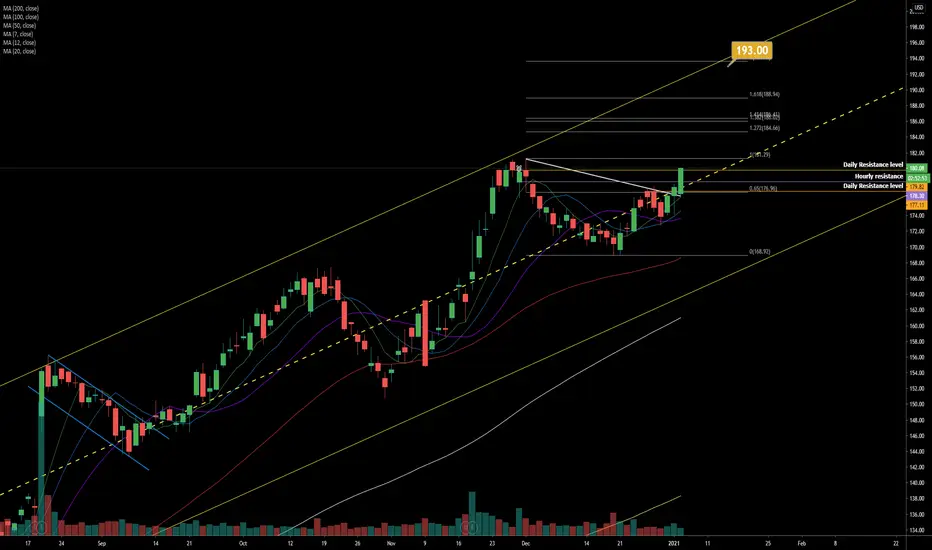
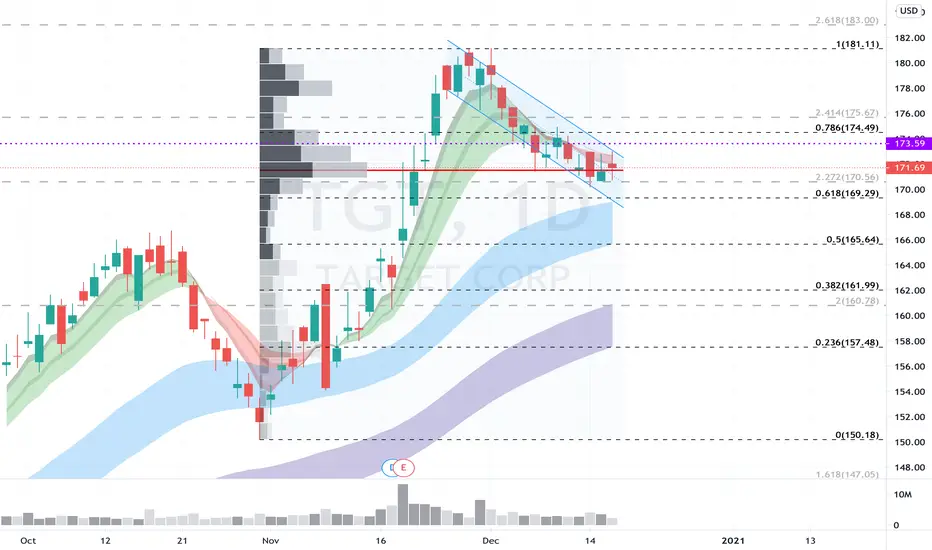
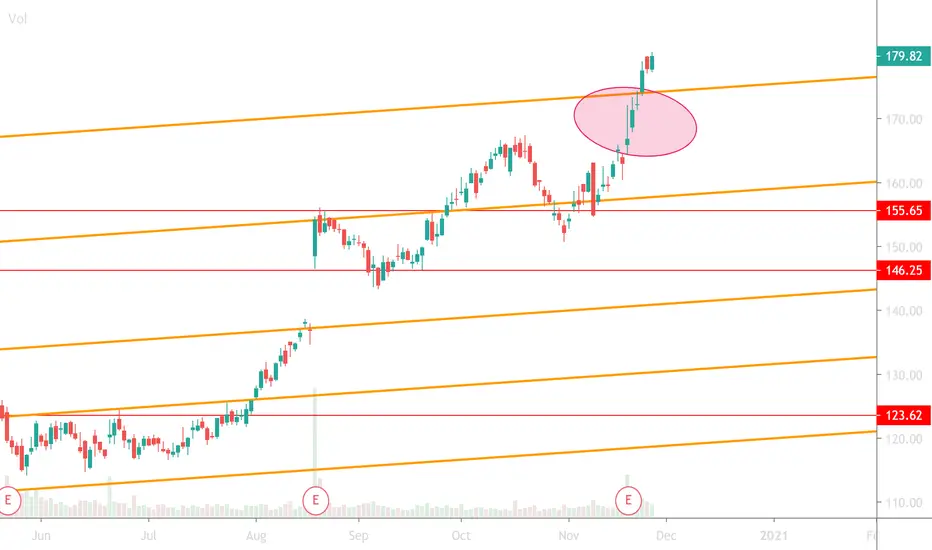
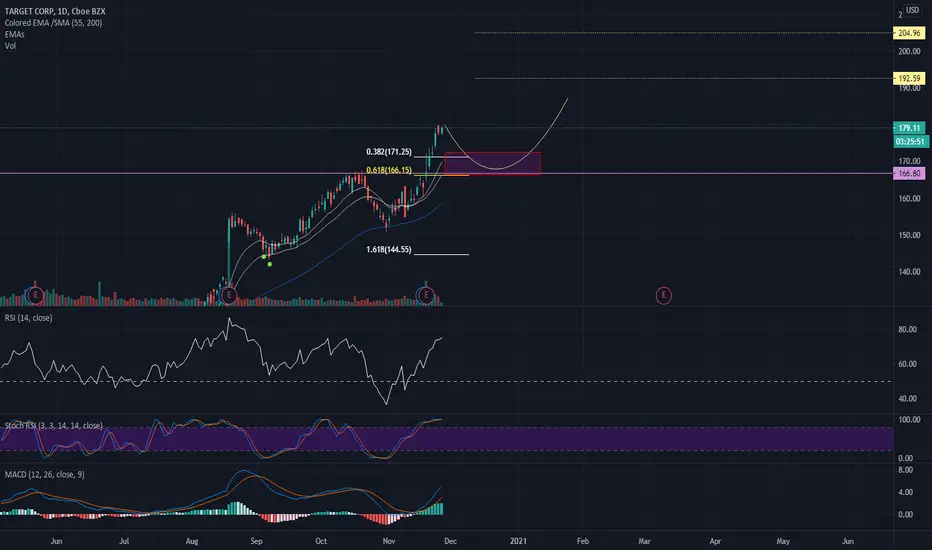
TGT Targets $193 Target
Broke through resistance and back above long term channel (mid)
Looking for major breakout.
Fibonacci expansion and channel target at approx. $193
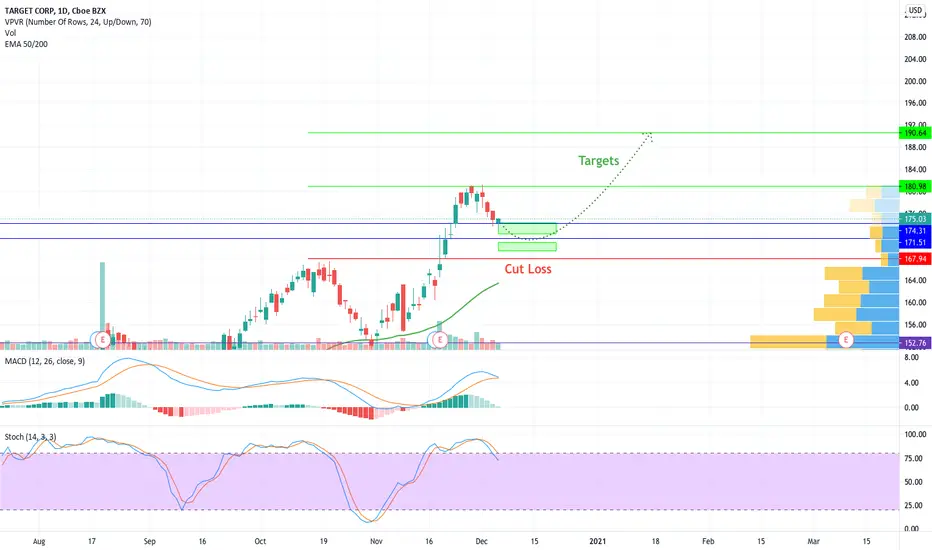
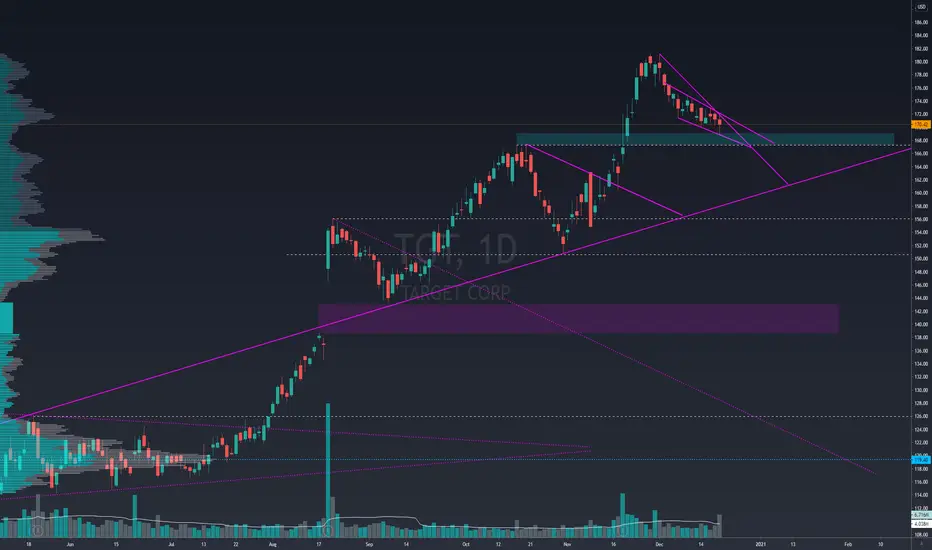
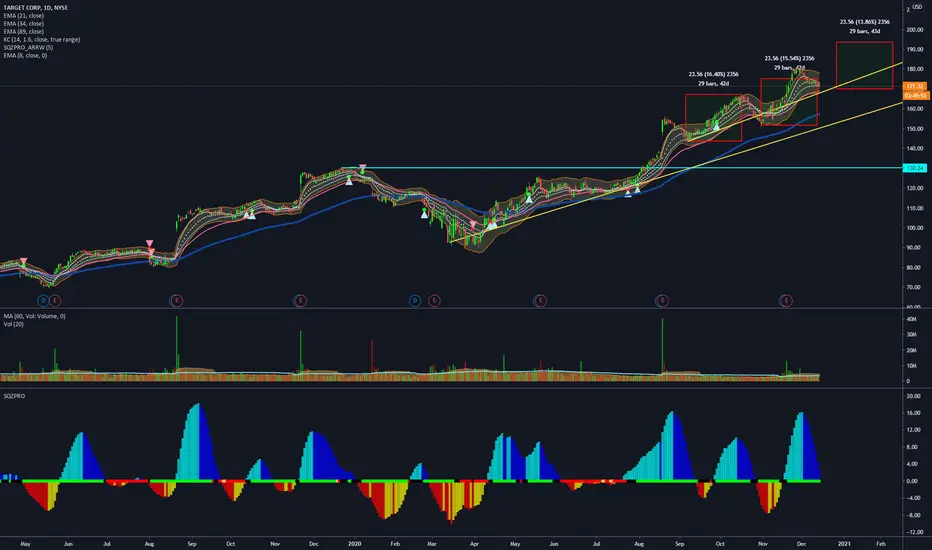
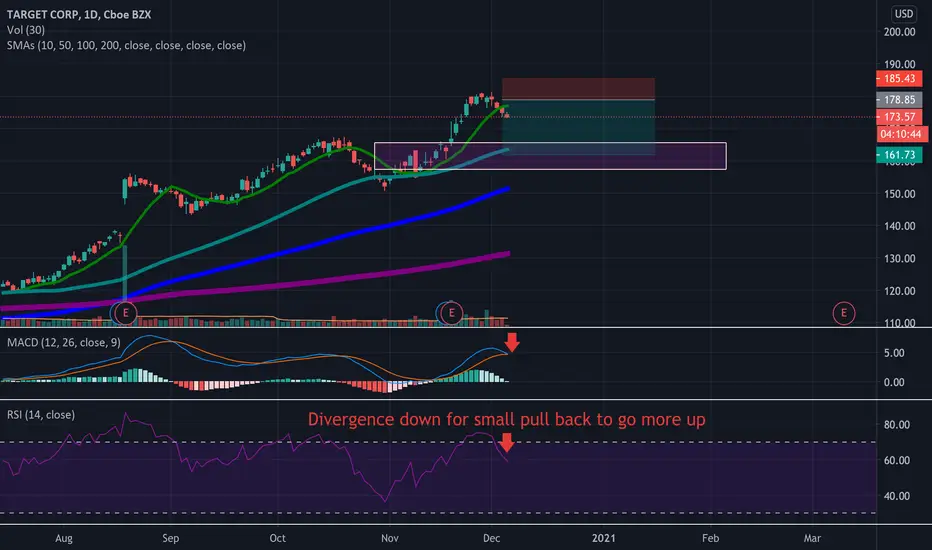
TGT12/28/20 - 1d TF
Bullish with potential Target 1 hit.
1. Price actions seems to form a bullish channel
2. EMAs seems to hold and price action is currently just above 8ema.
3. Price action at bottom channel with more room to go up.
4. MACD looks good. Lines kissing, hopefully it will cross in 1-2 days while histogram shows downtrend is reversing.
5. Stochastics at overbought area.
Discalimer:
My post in this channel should not be used as a replacement for investment advice from a qualified professional. All my post is for my own chart analysis prractice, informational and entrainment purposes only as I am not a registered investment advisor and do not offer investment advice. You, the reader, bear responsibility for your own investment and trade decisions and should seek the advice of a qualified securities professional before making any investment or trade.

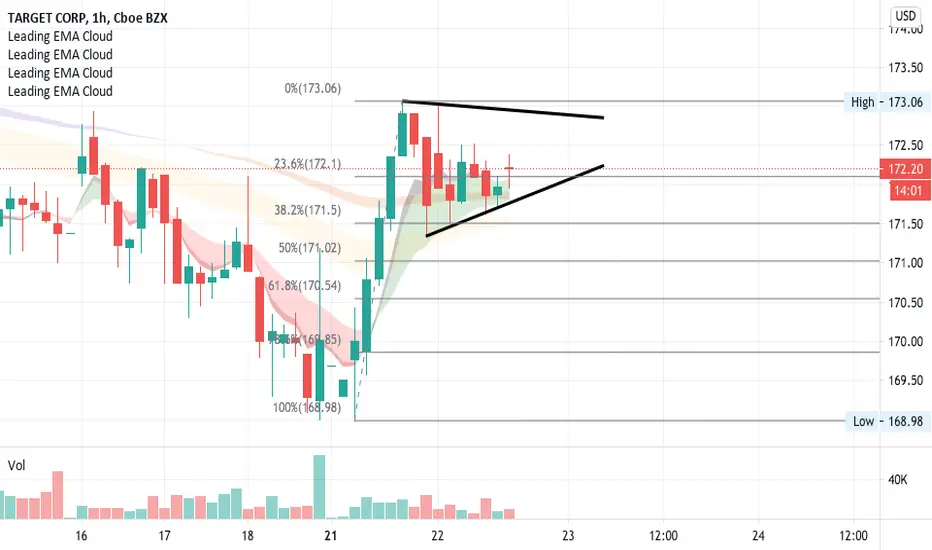
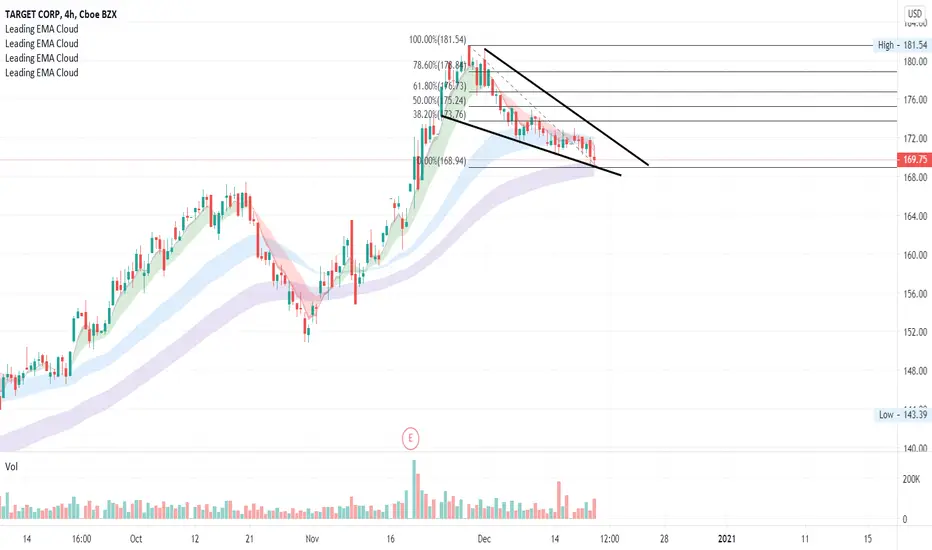
falling wedge, finding bottoma breakout from the falling wedge and i'm bullish for retrace back to 100%


BUY TARGET (TGT)@$168 a shareThe ticket name TGT is a very lovely stock to trade and it’s very easy.It moves in a clean up and down movement.I would place a buy entry at $168 right by the last low as shown on the picture I posted and continue to swing
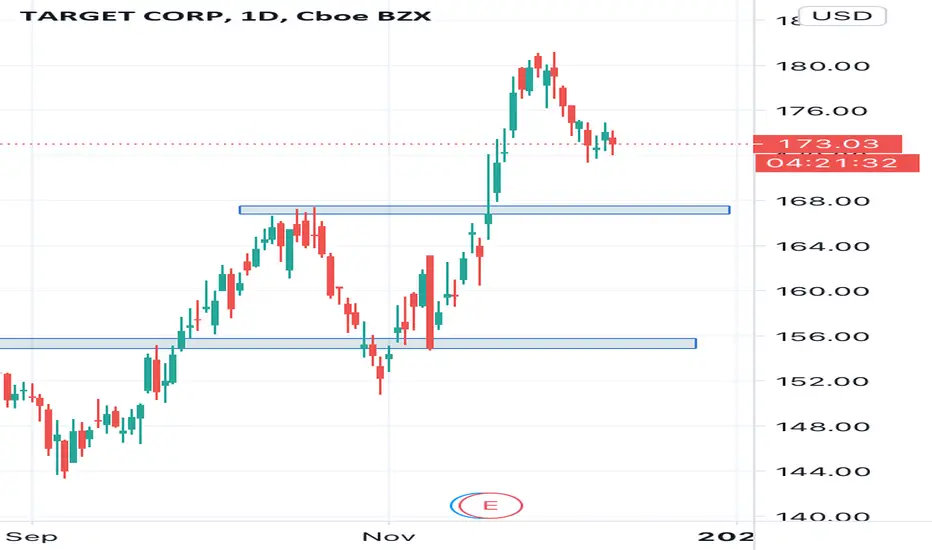
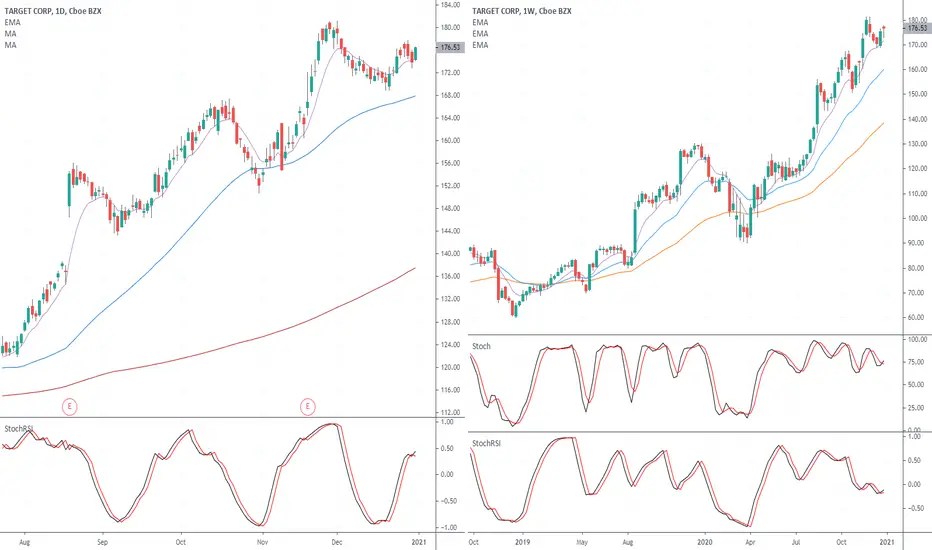
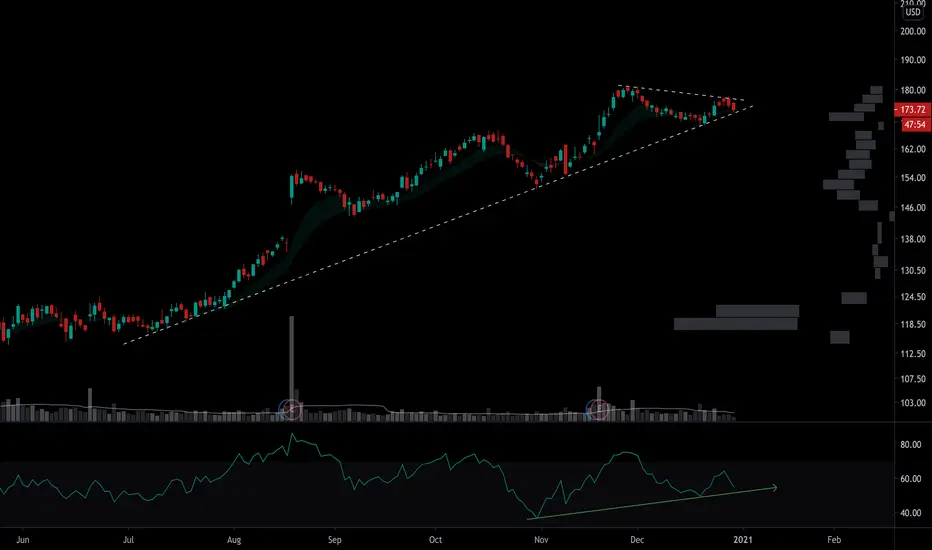
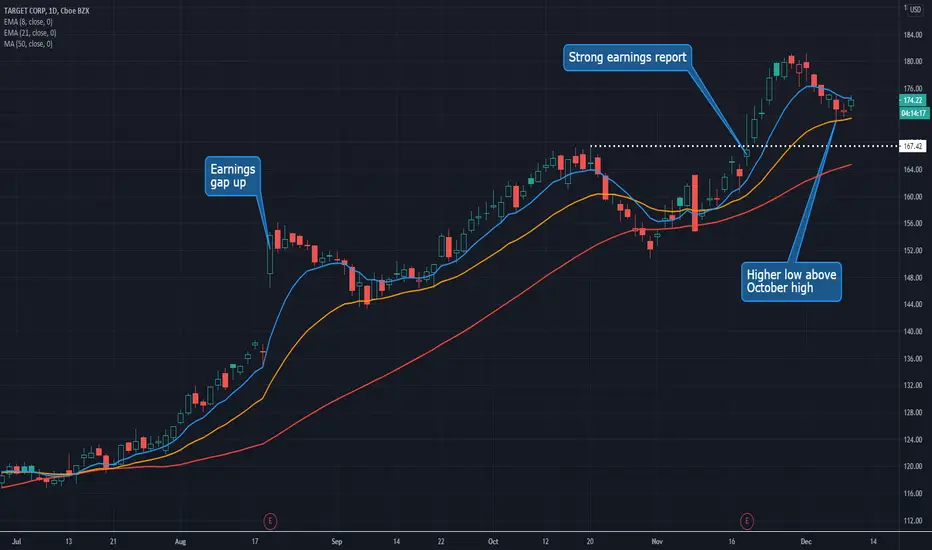
Target Turns Higher After Brief PullbackTarget has been one of the most interesting large companies in the last 2-3 years. It’s managed to dodge the retail apocalypse, build a thriving digital business and enamor a new generation of younger shoppers.
The stock pushed to new highs after a strong earnings report on November 18. It then pulled back gently and is now trying to make a higher low above its previous peak of $167.42.
The other feature standing out on TGT’s chart is the 21-day exponential moving average (EMA). The shares have approached that line but not quite tested it. That kind of fast and tight ascending pattern suggests the buyers remain firmly in control.
Overall, TGT is executing very well. It also has seasonality in its favor as the holidays approach and the market prices in an economic recovery. Investors waiting for a steeper pullback might find their stockings empty on Christmas morn.
TradeStation is a pioneer in the trading industry, providing access to stocks, options, futures and cryptocurrencies. See our Overview for more.

TGT: The best is yet to comeThree white soldiers candlestick formation seen, signifying the end of the correction. The market then sold off, but the losses were almost immediately recovered the next day, showing that there is still further momentum for this stock despite the large price movement. Additionally, TGT's earnings reports were spectacular this quarter, showing robustness past the pandemic phase. A worthy investment/swing trade!

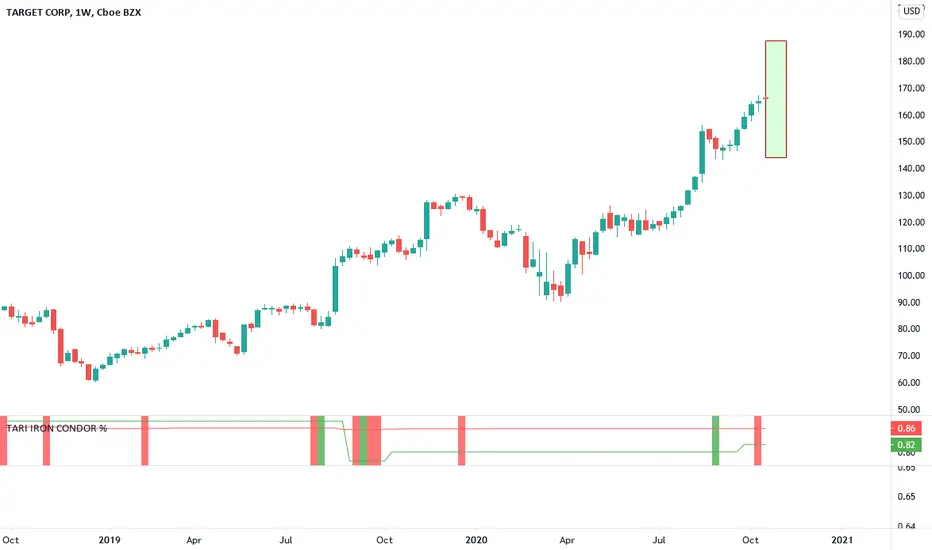
Iron TariHi guys,
just as described in my strategy we have 4weeks 13% strikes.
The maths are simple, just have a look at the strategy, and all the iron conodrs I shared in "ideas".
Enjoy your wallet!
Tari.