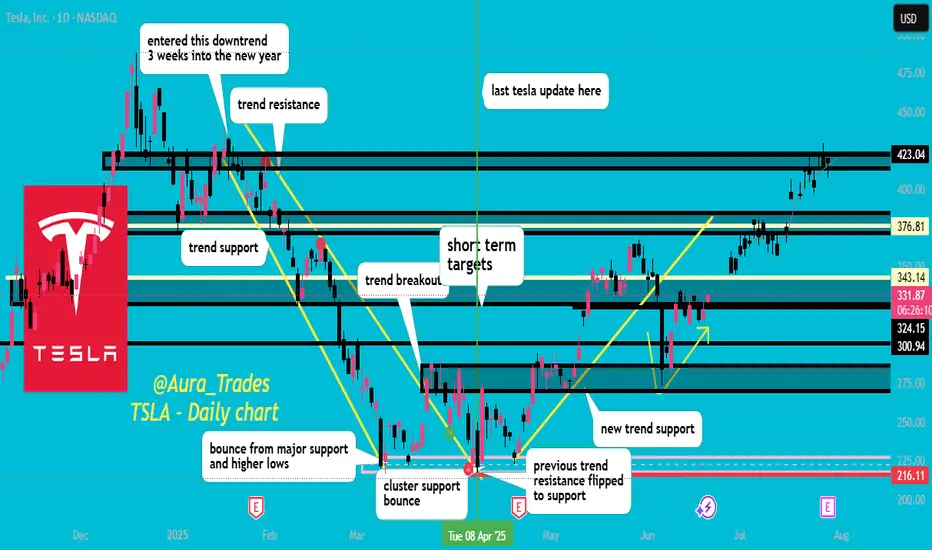
Tesla update, watch 343 level!boost and follow for more ❤️🔥 tsla broke the trend support mentioned in my last analysis, doesn't surprise me too much I did mention it was likely, now look for a daily close above 343, if we can get that then the rally to and past 400+ will come in the blink of an eye 🎯👁️
that is all, I am done posting for today.. I hope you all have a great weekend! stay safe and see you soon ⚡✌️
TSLA trade ideas
Tesla - This bullish break and retest!Tesla - NASDAQ:TSLA - confirmed the bullish reversal:
(click chart above to see the in depth analysis👆🏻)
Tesla recently created a very bullish break and retest. Therefore together with the monthly bullish price action, the recent rally was totally expected. But despite the short term volatility, Tesla remains bullish, is heading higher and will soon create new highs.
Levels to watch: $400
Keep your long term vision!
Philip (BasicTrading)

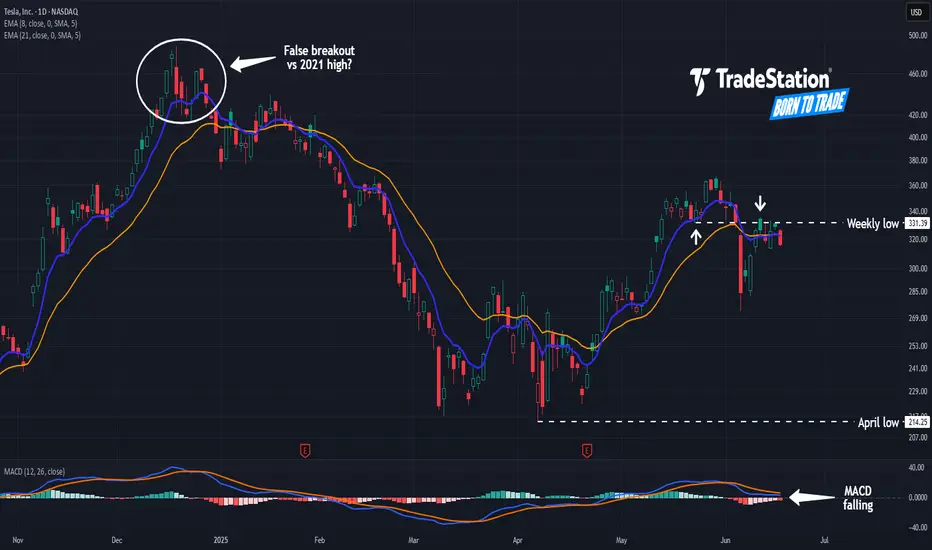
Tesla May Be StallingTesla bounced between early April and late May, but now it may be stalling.
The first pattern on today’s chart is the weekly low of $331.39 from May 22. TSLA fell below that level two weeks ago and was rejected at the same price area last week. Has old support become new resistance?
Second, the stock has fallen under its 8- and 21-day exponential moving averages (EMAs). The 8-day EMA is also at risk of slipping below the 21-day EMA. Such patterns may reflect short-term bearishness. Falling MACD paints a similar picture.
Third, the EV stock peaked at $488.54 in December -- above its previous high of $414.50 from November 2021. But it failed to hold, which could be viewed as a false breakout.
Those signals could focus traders’ attention on the April low of $214.15, which is still more than $100 below TSLA’s close on Tuesday.
Finally, TSLA is an active options underlier. (Its average daily volume of 2.6 million contracts last month ranked third in the entire market, according to TradeStation data.) That could make it easier for traders to take positions with calls and puts.
Check out TradingView's The Leap competition sponsored by TradeStation.
TradeStation has, for decades, advanced the trading industry, providing access to stocks, options and futures. If you're born to trade, we could be for you. See our Overview for more.
Past performance, whether actual or indicated by historical tests of strategies, is no guarantee of future performance or success. There is a possibility that you may sustain a loss equal to or greater than your entire investment regardless of which asset class you trade (equities, options or futures); therefore, you should not invest or risk money that you cannot afford to lose. Online trading is not suitable for all investors. View the document titled Characteristics and Risks of Standardized Options at www.TradeStation.com . Before trading any asset class, customers must read the relevant risk disclosure statements on www.TradeStation.com . System access and trade placement and execution may be delayed or fail due to market volatility and volume, quote delays, system and software errors, Internet traffic, outages and other factors.
Securities and futures trading is offered to self-directed customers by TradeStation Securities, Inc., a broker-dealer registered with the Securities and Exchange Commission and a futures commission merchant licensed with the Commodity Futures Trading Commission). TradeStation Securities is a member of the Financial Industry Regulatory Authority, the National Futures Association, and a number of exchanges.
Options trading is not suitable for all investors. Your TradeStation Securities’ account application to trade options will be considered and approved or disapproved based on all relevant factors, including your trading experience. See www.TradeStation.com . Visit www.TradeStation.com for full details on the costs and fees associated with options.
Margin trading involves risks, and it is important that you fully understand those risks before trading on margin. The Margin Disclosure Statement outlines many of those risks, including that you can lose more funds than you deposit in your margin account; your brokerage firm can force the sale of securities in your account; your brokerage firm can sell your securities without contacting you; and you are not entitled to an extension of time on a margin call. Review the Margin Disclosure Statement at www.TradeStation.com .
TradeStation Securities, Inc. and TradeStation Technologies, Inc. are each wholly owned subsidiaries of TradeStation Group, Inc., both operating, and providing products and services, under the TradeStation brand and trademark. When applying for, or purchasing, accounts, subscriptions, products and services, it is important that you know which company you will be dealing with. Visit www.TradeStation.com for further important information explaining what this means.
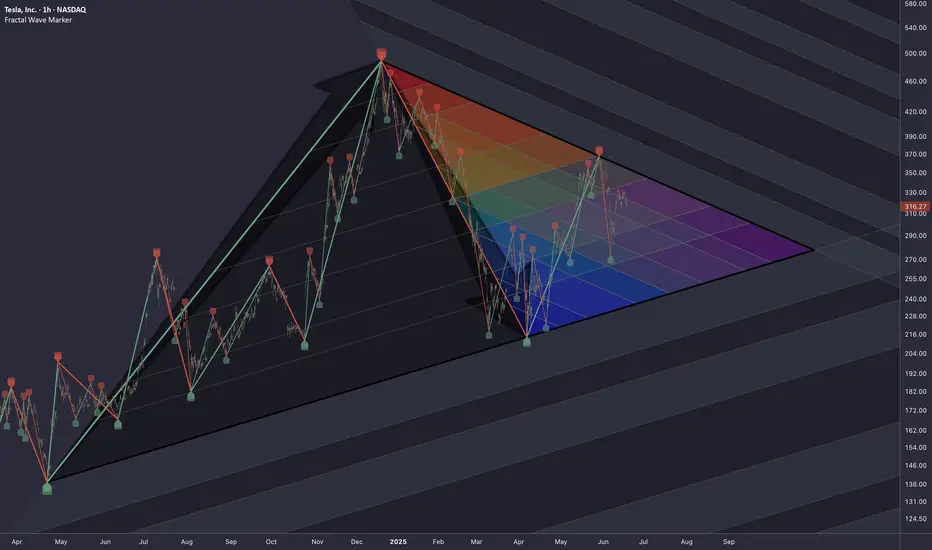
TSLA: Triangle PatternResearching the market through structural lens, particularly the topology of trapped liquidity buildup and compression of volatility, that leads to a proportionally heavier move once a breakout occurs.
Raw compression area derived from waves of higher degrees (2nd, 3rd)
The longer price consolidates within boundaries of a triangular formation, the more significant the breakout tends to be.
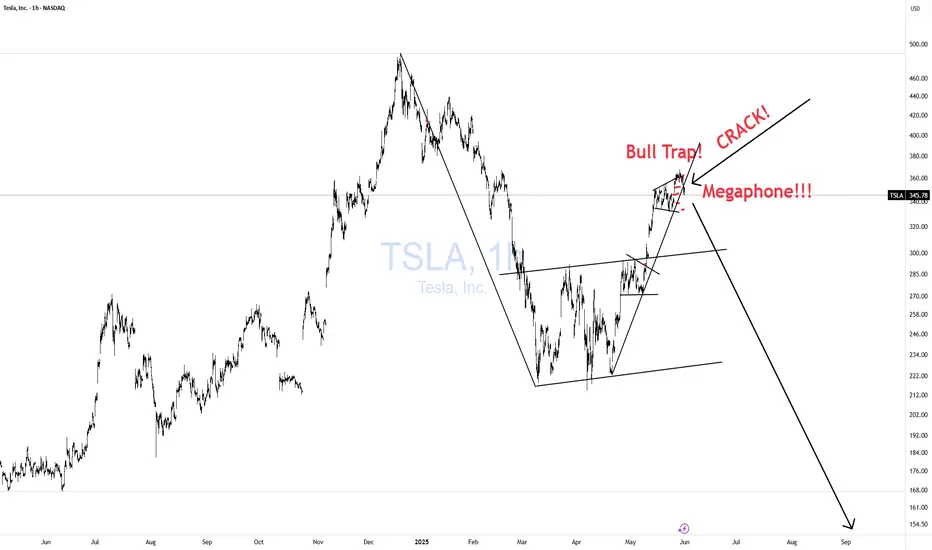
TSLA Honey Ticking Bull Trap!TSLA has a beautiful big ars bear flag! While it should have broken down to trigger a short trade, it decided to Honey Tick people right into a Trap!
It formed a perfect MEGAPHONE in wave 3 up that has now CRACKED! This is a much juicer short setup with the potential of collapsing from here and taking out the entire bear flag and MORE!!
First, we need a lower low and then a lower high and off we GO BABY!!!
Don't Get HONEY TICKED!
As I always say, never EVER!! Invest in toxic people like Elona. They always blow themselves up in the end. It's in their nature!
Click boost and follow, let's get to 5,000 followers. ;)
TESLA PRICE ACTION 20JUNE 2025This is the price action of Tesla . I have discussed everything deeply and if you have any doubts then feel free to message or leave a comment.
I am bullish on Tesla.
NOTE:DO NOT SHORT TESLA

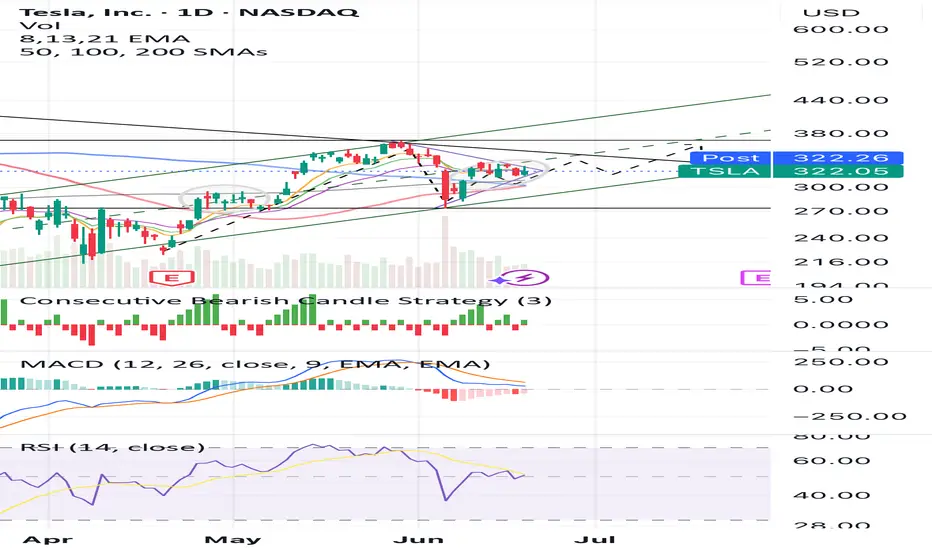
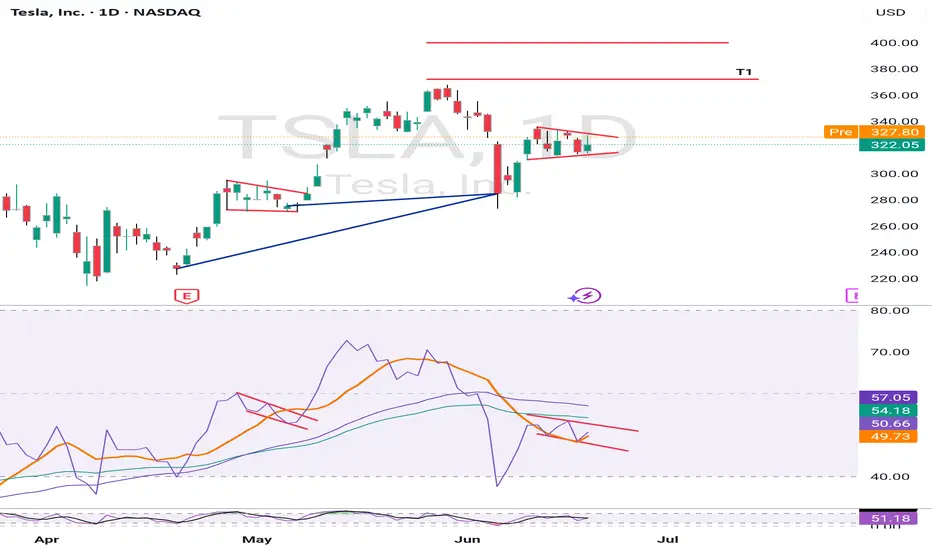
On the edge of bullish breakdownCurrent price is in a falling wedge and consolidating in 310-330 above 100 SMA within a long-term uptrend channel. Two grey circles mark previous & current consolidation zones - a clear attempt to highlight a repeating pattern that may lead to a breakout, just like in late April. MACD/RSI show signs of bullish momentum recovery. PT: 350. NFA!
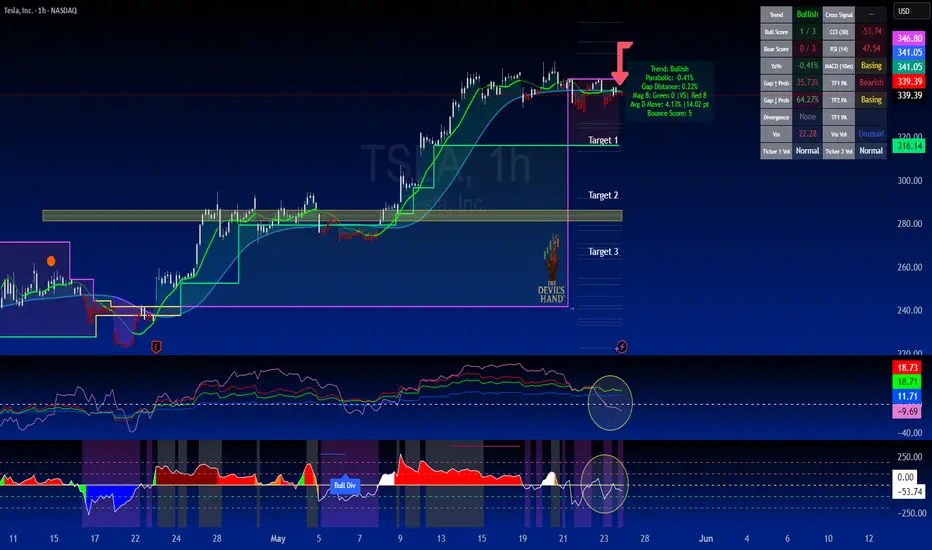
Weekly Technical Analysis for TSLA (June 24–28)TSLA is entering a critical squeeze zone between major gamma walls and key price structure levels. Let’s break this down with both the Daily GEX Map and the 1-Hour Price Action to strategize your trades this week.
📊 GEX Map (Daily Timeframe Insights)
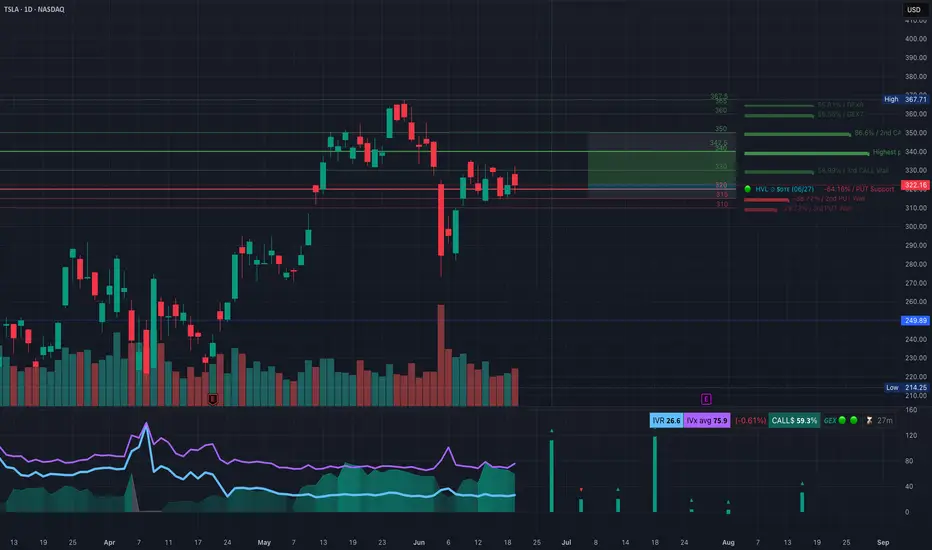
From the first chart:
* Current Price: $322.16
* High Gamma Resistance Zone:
* 🧱 $330 = GEX Cluster
* 🧱 $336–$342 = Highest NTE/Call Wall
* 🧱 $348–$367 = 2nd and 3rd CALL Walls
* Support Levels:
* 🛡️ $315 (2nd PUT Wall)
* 🛡️ $310 (3rd PUT Wall)
* 🔻 Below $310 = Gamma unwind and vacuum toward $296
GEX Sentiment:
* GEX: ✅ Bullish (green dot)
* IV Rank (IVR): 26.6 (low) → cheap options
* CALL$ flow: 59.3% bias bullish
* IVx < IVR → low IV crush risk on CALLs
Interpretation:
TSLA is pinned between two strong gamma zones: $315–$330. A breakout could magnet price quickly to $342+, but a breakdown below $312.50 puts $296 in play fast.
🕐 1-Hour Chart (Smart Money Concepts)
* CHoCH confirmed around $330 zone → bearish pressure
* BOS and reaccumulation near $312–$316 zone → short-term buyer defense
* Trendline support holding, price coiling in a wedge
* Volume shows weak conviction in breakdowns; potential trap under $315
🎯 Trade Scenarios for This Week
🔼 Bullish Setup (Breakout Above $330):
* Entry: Above $333 (confirm breakout + GEX flip)
* Target 1: $342 (GEX target, CALL wall)
* Target 2: $348–$357
* Stop: Below $322
* Trigger: Volume surge + clean CHoCH over pink zone
🔽 Bearish Setup (Breakdown Below $312):
* Entry: Below $311 (gap-filler move)
* Target 1: $296 (FVG + structure zone)
* Target 2: $284 (OB demand)
* Stop: Above $318
* Trigger: CHoCH failure + BOS retest fails under OB
🧠 Smart Tips
* If you’re scalping: watch the $322–$325 chop zone. Only commit on break of wedge.
* Gamma compression + low IV makes TSLA explosive this week—perfect for vertical debit spreads or lottos on direction breakout.
* Best confirmation = volume + higher timeframe CHoCH + breakout candle from consolidation.
🔚 Final Thoughts
TSLA is coiled tight. Watch for the breakout of $330 or a flush under $312. Both offer strong risk-to-reward opportunities. Stay patient, and let price confirm before sizing in.
Disclaimer: This analysis is for educational purposes only and does not constitute financial advice. Always do your own research and manage your risk properly.
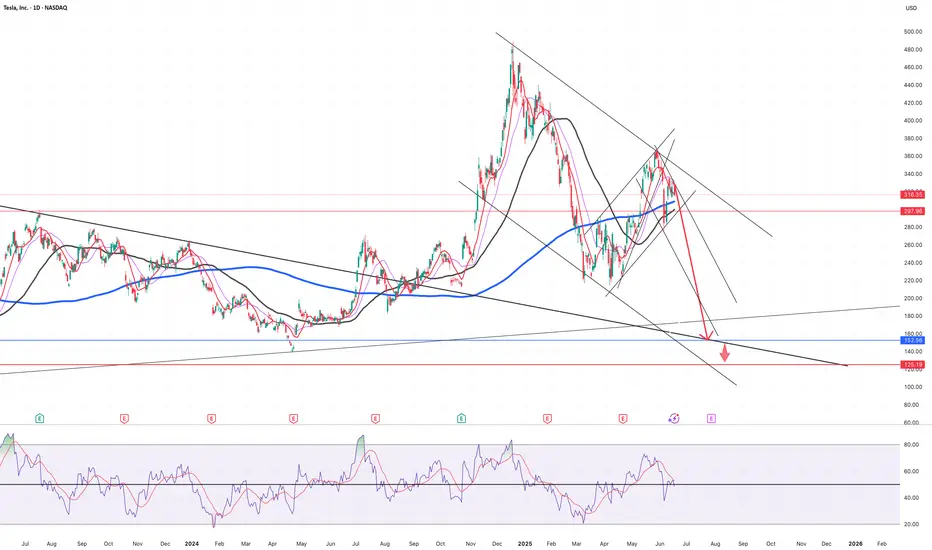
TSLA It’s still downtrendIf break support 297 below then It’s going down till 153 , (extention is 125)
The stock market is highly volatile. Please be very careful with your investments.
$TSLA The Magnificent PennyWelcome to a comprehensive analysis of the little Penny Stock that could..
NASDAQ:TSLA is at it again, ripping shorts and trapping longs. Business as usual.
NASDAQ:TSLA operates primarily from one chart being the Hourly. All signals giveth and all Signal taketh away from this chart.
At present we are seeing a distinctive weakness creeping into the hourly chart which is presently in a distribution pattern making lower lows on it's consolidation. The trend is just starting to turn bearish and as you can see from our dynamic support and resistance levels, our first stop after already retesting resistance is a fill of the box at 316.14
Once this box is broken we can expect to fill the lower gap at 291.85 being a weekly support target.
Finally if a run back to the 265.13 Monthly target would complete the Market Maker discount to grab stock and push it higher from here.
All things being equal, NASDAQ:TSLA is a great short in the mid-term with both CCI and MA angle breaking to the downside.
TSLA Failing at Gamma Wall! Will $322 Hold or Collapse Into $315🔬 GEX (Options Sentiment) Breakdown:
* Gamma Exposure Zones:
* Major Resistance (Gamma Wall): $327.50 → current rejection zone
* Second CALL Wall: $340 → unlikely unless gamma squeeze kicks in
* Strongest CALL Zone: $350 (very unlikely without broader tech rally)
* PUT Support Zones:
* $322.50 → HVL + initial gamma flip
* $315 = highest negative GEX / heavy PUT support
* $310 = 3rd PUT wall — deep flush risk
* Options Metrics:
* IVR: 25.2 (moderate)
* IVx avg: 70.5
* Calls Flow: 71.5% → bullish interest still high
* GEX Sentiment: 🟢🟢🟢🟢 (tilted bullish but with risk below $322.50)
* Interpretation:
* TSLA is trading below the Gamma Wall at $327.5 and just cracked the HVL zone at $322.5 — this is a bearish transition point.
* GEX model shows put acceleration below $322. If bulls don’t step in quickly, it could slide fast to $315 or even $310.
🧠 15-Minute SMC Breakdown:
* Current Price: $325.00
* Structure:
* Multiple CHoCHs and BOS levels near $330–$327
* Bearish wedge breakdown from consolidation just occurred
* Breakdown candle volume surging = institutional selling confirmed
* Entering demand zone (green box) near $324 → temporary bounce possible
* Trendlines:
* Broken wedge & horizontal support = confirms downside pressure
* If $322.50 fails, next liquidity is $315 (GEX + prior BOS zone)
⚔️ Trade Setups:
🟥 Bearish Setup (High Probability):
* Trigger: Continuation below $322.50
* Target 1: $315 (PUT support)
* Target 2: $310
* Stop-loss: Above $327.50 (Gamma Wall)
Price is transitioning below gamma support and into negative delta zone — watch for acceleration if $322.50 loses volume bid.
🟩 Bullish Scenario (Needs Reclaim):
* Trigger: Reclaim of $328
* Target 1: $331.20 (minor resistance)
* Target 2: $336–$340 (CALL wall / next GEX magnet)
* Stop-loss: Below $324.50
Would need strong market reversal and SPY/QQQ support for this to play out.
💭 My Thoughts:
* TSLA is transitioning into a bearish zone, especially with this CHoCH + GEX rejection from $327.5.
* Volume spike shows sellers are stepping in — bounces are sell opportunities unless reclaimed fast.
* Call buyers are still heavy (71.5%) — if this unwinds, downside could be even faster.
* Great setup for PUT spread or directional PUTs on breakdown.
🔚 Conclusion:
TSLA has rejected from the $327.5 Gamma Wall and now cracked a key support. With structure and options data aligned, a flush to $315 is on watch if $322.5 breaks cleanly. Bullish only above $328 with strength.
Disclaimer: This content is for educational purposes only. Always manage your risk and execute trades based on your own strategy.

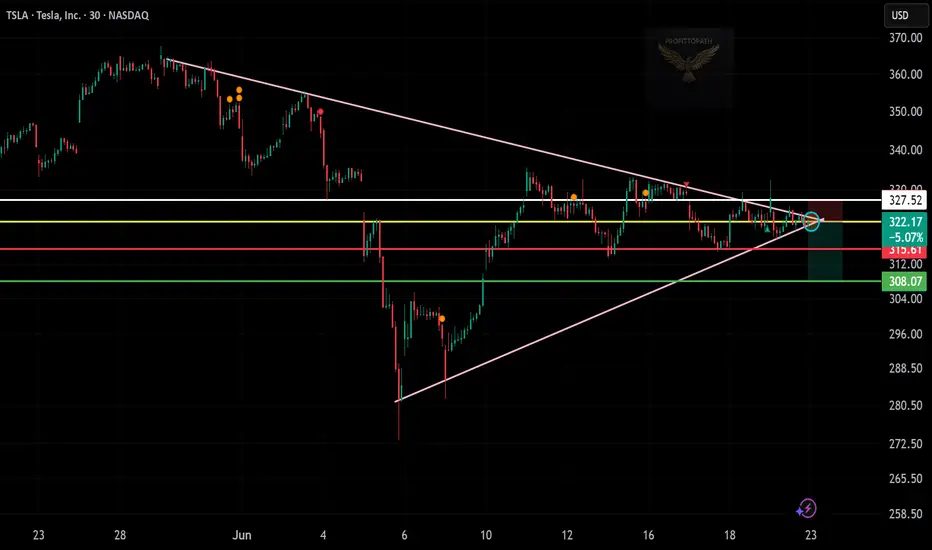
$TSLA Short Trade – Breakdown in the Making “When pressure buil⚡🔻 💣📉
Tesla ( NASDAQ:TSLA ) is coiling tighter than ever inside this symmetrical triangle — but this isn’t strength… it’s stress.
With lower highs stacking and bulls running out of breath, the breakdown could hit like a spark in a lithium mine. ⚠️🔋
Is this just technicals? Or is the market doubting the Elon engine again? 🚗🧠
📌 Trade Setup:
Entry: $322.17
Target: $308.07
Stop-loss: $327.52
From breakout darling to breakdown candidate — Tesla’s chart is whispering a warning.
Will it hold… or will gravity take over? 🧲
#TSLA #ShortSetup #BearishChart #TeslaTrade #TradingViewSetup #ChartBreakdown #TechnicalAnalysis #OptionsPlay #ProfittoPath
What Is T-Distribution in Trading? What Is T-Distribution in Trading?
In the financial markets, understanding T-distribution in probability is a valuable skill. This statistical concept, crucial for small sample sizes, offers insights into market trends and risks. By grasping T-distribution, traders gain a powerful tool for evaluating strategies, risks, and portfolios. Let's delve into what T-distribution is and how it's effectively used in the realm of trading.
Understanding T-Distribution
The T-distribution in probability distribution plays a crucial role in trading, especially in situations where sample sizes are small. William Sealy Gosset first introduced it under the pseudonym "Student". This distribution resembles the normal distribution with its bell-shaped curve but has thicker tails, meaning it predicts more outcomes in the extreme ends than a normal distribution would.
A key element of T-distribution is the concept of 'degrees of freedom', which essentially refers to the number of values in a calculation that are free to vary. It's usually the sample size minus one.
The degrees of freedom affect the shape of the T-distribution; with fewer degrees of freedom, the distribution has heavier tails. As the degrees of freedom increase, the distribution starts to resemble the normal distribution more closely. This is particularly significant in trading when dealing with small data sets, where the T-distribution provides a more accurate estimation of probability and risk than the normal distribution.
T-Distribution vs Normal Distribution
T-distribution and normal distribution are foundational in statistical analysis, yet they serve different purposes. While both exhibit a bell-shaped curve, the T-distribution has thicker tails, implying a higher probability of extreme values. This makes it more suitable for small sample sizes or when the standard deviation is unknown.
In contrast, the normal distribution, with its thinner tails, is ideal for larger sample sets where the standard deviation is known. Traders often use T-distribution for more accurate analysis in small-scale or uncertain data scenarios, while normal distribution is preferred for larger, more stable datasets, where extreme outcomes are less likely.
Application in Trading
In trading, T-distribution is a valuable tool for analysing financial data. It is primarily used in constructing confidence intervals and conducting hypothesis testing, which are essential for making informed trading decisions.
For instance, a trader might use T-distribution to test the effectiveness of a new trading strategy. Suppose a trader has developed a strategy using the technical analysis tools and wants to understand its potential effectiveness compared to the general market performance. They would collect a sample of returns from this strategy over a period, say, 30 days. Given the small sample size, using T-distribution is appropriate here.
The trader would then calculate the mean return of this sample and use T-distribution to create a confidence interval. This interval would provide a range within which the true mean return of the strategy is likely to lie, with a certain level of confidence. If this confidence interval shows a higher mean return than the market average, the trader might conclude that the strategy is potentially effective. However, it's important to note that this is an estimation and not a guarantee of future performance.
How to Plug Probability and Normal Distribution in Your T-Calculation
To use a T-calculator for integrating probability and normal distribution, follow these steps:
- Input Degrees of Freedom: For T-distribution, calculate the degrees of freedom (sample size minus one).
- Convert Z-Score to T-Value: If using normal distribution data, convert the Z-score (standard deviation units from the mean in a normal distribution) to a T-value using the formula: T = Z * (sqrt(n)), where 'n' is the sample size.
- Enter T-Value: Input this T-value into the calculator.
- Calculate Probability: The calculator will then output the probability, providing a statistical basis for trading decisions based on the T-distribution.
Limitations and Considerations of T-Distribution
While T-distribution is a powerful tool in trading analysis, it's important to recognise its limitations and considerations:
- Sample Size Sensitivity: T-distribution is most effective with small sample sizes. As the sample size increases, it converges to a normal distribution, reducing its distinct utility.
- Assumption of Normality: T-distribution assumes that the underlying data is approximately normally distributed. This may not hold true for all financial data sets, especially those with significant skewness or kurtosis.
- Degrees of Freedom Complications: Misestimating degrees of freedom can lead to inaccurate results. It's crucial to calculate this correctly based on the sample data.
- Outlier Sensitivity: T-distribution can be overly sensitive to outliers in the data, which can skew results.
Advanced Applications of T-Distribution in Trading
T-distribution extends beyond basic trading applications, playing a role in advanced financial analyses:
- Risk Modelling: Utilised in constructing sophisticated risk models, helping traders assess the probability of extreme losses.
- Algorithmic Trading: Integral in developing complex algorithms.
- Portfolio Optimisation: Assists in optimising portfolios by estimating returns and risks of various assets.
- Market Research: Used in advanced market research methodologies to analyse small sample behavioural studies.
The Bottom Line
The T-distribution is a powerful tool, offering nuanced insights in scenarios involving small sample sizes or uncertain standard deviations. Its ability to accommodate real-world data's quirks makes it invaluable for various trading applications, from strategy testing to risk assessment. However, understanding its limitations and proper application is crucial for accurate analysis.
This article represents the opinion of the Companies operating under the FXOpen brand only. It is not to be construed as an offer, solicitation, or recommendation with respect to products and services provided by the Companies operating under the FXOpen brand, nor is it to be considered financial advice.
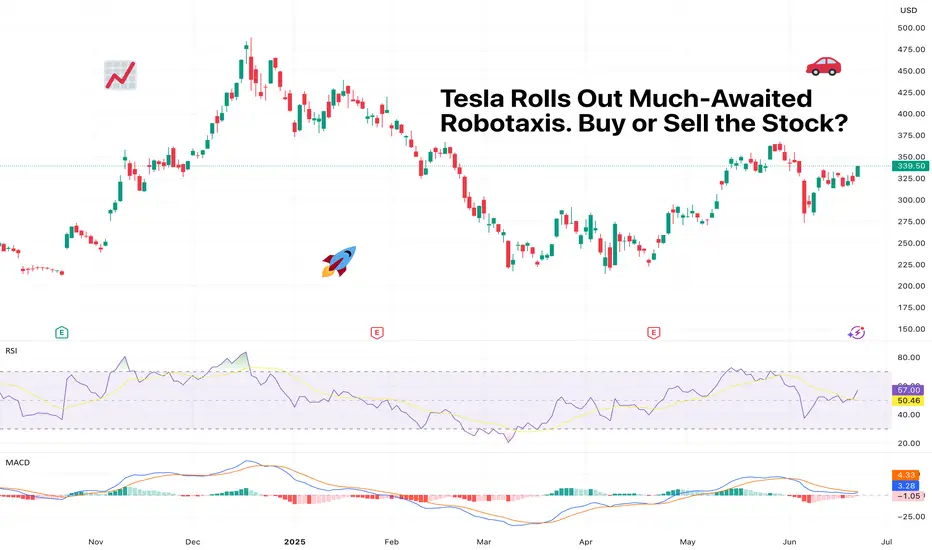
Tesla Rolls Out Much-Awaited Robotaxis. Buy or Sell the Stock?They’re here. After years of tweets, teasers, and timelines that aged like unrefrigerated dairy, Tesla NASDAQ:TSLA officially launched its long-awaited robotaxi service in Austin, Texas.
The self-driving revolution, we were told, would arrive like a lightning bolt. Instead, it quietly rolled up to the curb with a safety monitor riding shotgun.
On Sunday, ( as promised ) a small, highly curated fleet of Teslas — fully driverless, but not entirely unsupervised — began picking up paying passengers in an isolated section of Austin. CEO Elon Musk, as usual, led the cheer squad, declaring victory on X.
“Super congratulations to the Tesla AI software and chip design teams on a successful robotaxi launch!! Both the AI chip and software teams were built from scratch within Tesla.”
Investors, naturally, perked up. Tesla shares edged higher by more than 5% Monday morning as Wall Street tried to figure out whether this was the long-awaited catalyst for another rally… or just another “sell-the-news” moment that fizzles as quickly as the hype fades.
🔔 The Soft Launch Heard Around The Internet
Let’s not get carried away. This wasn’t a citywide revolution. Tesla’s launch was extremely limited — more of a PR exercise than a true market rollout. Only a handful of Teslas were involved, operating in a tightly controlled, geofenced area.
The riders? Carefully selected influencers, many of whom were more excited to film TikToks than analyze technical driving capability. In other words, this wasn’t exactly New York City rush-hour stress testing.
The rides cost a flat fee of $4.20, because, of course they did. And while the cars drove themselves, safety monitors sat in the front passenger seats — a very human reminder that the project is still very much in beta mode.
The bigger question for investors: Does this prove Tesla’s technology is ready for prime time? Or is it simply an appetizer served years before the main course?
📈 The Market Reaction: Buy the Rumor, Sell the Launch?
Here’s where things get tricky for traders.
The stock market, as always, is forward-looking. Tesla stock didn’t just wake up bullish on Monday because of a few rides in Austin — it’s been rallying for months because of the promise of robotaxis.
Since Tesla’s big October 10 robotaxi event — where Musk laid out plans to launch a self-driving cab service in 2025 — shares have climbed roughly 35%. Much of that gain is already baked into expectations for Tesla finally delivering on what Musk has been promising since at least 2016.
Now that the product is technically “live,” even in tiny demo form, some traders are wondering: is this the start of an even bigger rally?
The answer probably depends on how fast Tesla can scale. And that’s where reality gets stickier.
🤔 The Scaling Problem: A Long Road Ahead
As exciting as Sunday’s launch may have been for influencers and Tesla superfans, it’s not exactly proof of scalability. Deploying 10 carefully monitored cars in a tiny slice of Austin is one thing; blanketing entire metro areas, or states, or countries is another beast entirely.
Tesla’s AI software may be improving, and its in-house chip design gives it some vertical integration advantages. But scaling fully autonomous fleets will require navigating a minefield of regulatory, safety, and logistical challenges — not to mention stiff competition.
Alphabet’s Waymo is already operating robotaxi services in Phoenix, San Francisco, and Los Angeles, with years of public road testing under its belt. Cruise (General Motors) ran its own driverless service before recently pausing operations after high-profile safety incidents. The technology arms race is fierce — and far from settled.
Industry experts continue to caution that mass-market robotaxis may take years — if not decades — to fully materialize. And while Tesla loves to move fast and break things, cities, regulators, and insurance companies tend to prefer a bit more caution when thousands of driverless vehicles are involved.
📝 What’s Actually Priced Into Tesla Stock?
Here’s where this gets existential for Tesla bulls.
A huge chunk of Tesla’s market valuation — some would argue most of it — now rests on the idea that it isn’t just a car company. It’s an AI company. A software company. A robotics company. A future robotaxi empire. If those narratives start to weaken, so does the multiple.
Tesla remains dominant in EV production and it still benefits from profit margins (about half of the profits coming from selling regulatory credits to other carmakers). But even Musk himself has made clear that Tesla’s long-term valuation depends heavily on successfully delivering robotaxis and humanoid robots.
If Sunday’s soft launch is the start of something truly scalable, then maybe the valuation holds up. If it stalls — either due to regulatory hurdles, technological ceilings, or public skepticism — the market may need to reevaluate just how much of Tesla’s price reflects reality versus dreams.
👀 Bottom Line: Revolutionary or Just Another Test Ride?
So, should you buy or sell Tesla after its long-awaited robotaxi debut?
That depends on how you frame this moment. The bulls see a trillion-dollar industry being born, with Tesla perfectly positioned. The bears see a carefully staged PR event masking how far away true autonomy still is.
For now, Tesla gets credit for being bold — even if it’s bold enough to roll out a very small, very managed test.
But markets eventually ask: “What’s next?” And unless Tesla can quickly scale from 10 cars in Austin to fully functioning fleets in major cities, a victory lap here could feel a little premature.
As always with Tesla: the story is thrilling, the stock is volatile, and the future is still very much under construction.
And with its earnings just around the corner — you’re following the earnings calendar , right? — things might just be getting exciting.
Off to you : Which side are on? The bullish traders looking to add to their long positions or the bearish sellers who’ve been calling “overvalued” for years? Share your thoughts in the comments!
TSLA trade of the weekThis idea is something new where I'm asking my HIGHLY EXPERIMENTAL dowsing work for a "best bang for your buck" trade at the beginning of the week. Last week was pretty good saying to short SPY on Wed., so I'm going to journal these and see if it can be consistent.
If this aligns with YOUR work, great.
The idea is TSLA has a spike up towards the upper gap around $326-28. My levels on TSLA often are overshot, but anyway. Then watch for it to head towards the lower gap in the $310-307 zone and possibly down to $302.
My work is INCONSISTENT. There's more going into this than just looking at an indicator. This is energy, intention, intuition and God knows what else and it's more for myself than you. But, if you're interested, I'm happy to answer questions and share as I hope it inspires your own sense of what is possible beyond just the physical world.

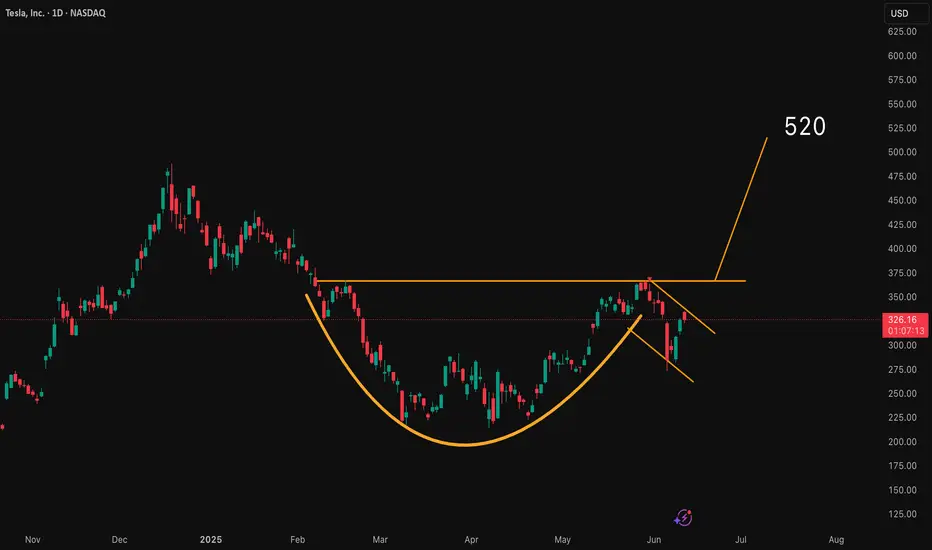
Cup and handleA big move is coming if the formation breaks to the upside. I see 500-520$ as the target area.
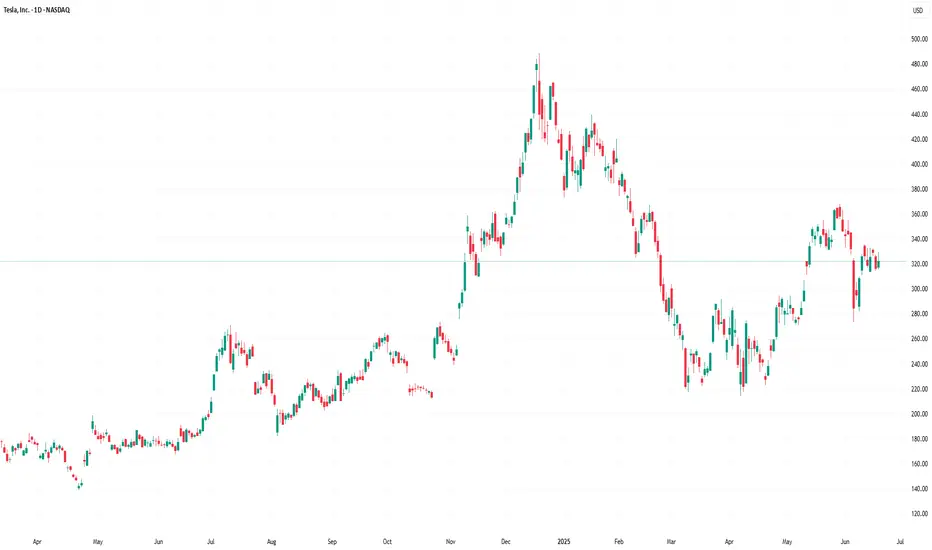
TESLA: Can double its price ($640) by the end of the year.Tesla is neutral on its 1D technical outlook (RSI = 51.064, MACD = 4.910, ADX = 24.971), consolidating for the past week, but remains over its 1D MA50 and 1D MA200 nonetheless. Since the major market bottom on January 6th 2023, it's been trading inside a Channel Up and this is its 3rd bullish wave. The 2 prior rose by +196.67% from the bottom of the pattern (despite the 2nd breaking marginally under it). Consequently, this suggests that Tesla can rise by +100% from the current $320 level, before the Channel Up tops (HH) again. We are bullish, TP = 640.
See how our prior idea has worked out:
## If you like our free content follow our profile to get more daily ideas. ##
## Comments and likes are greatly appreciated. ##

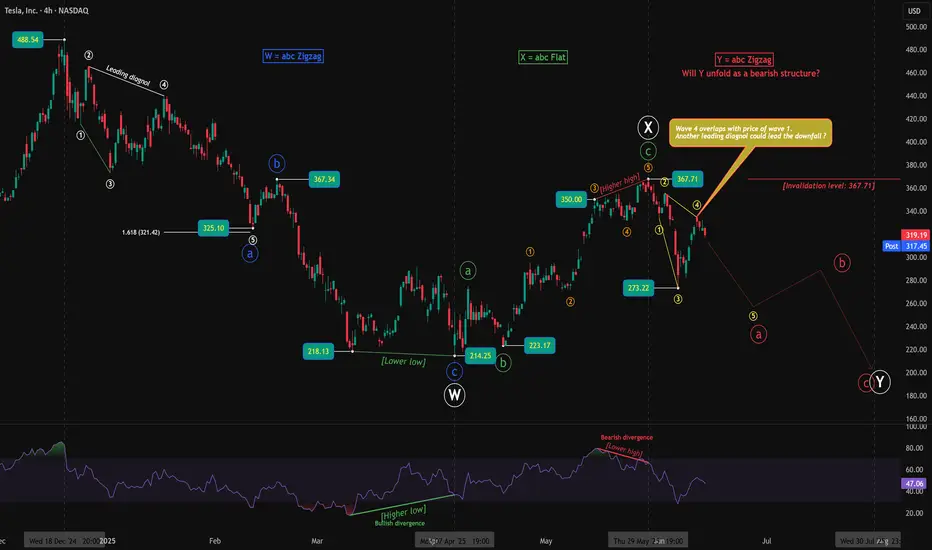
Tesla’s Flat Deception: Bearish Wave Y in the Making?Tesla’s price structure has taken traders on quite a journey, and after peeling back the layers, it's clear that both bullish and bearish possibilities demanded attention — but only one holds more weight for now.
The first sign of life came at the March low, where price made a lower low (218.13 to 214.25), but RSI formed a higher low. This classic bullish divergence paved the way for a strong rally, confirming that Wave W had likely ended with a sharp zigzag, and Wave X was beginning to unfold. The bounce from 214.25 extended into a flat structure, which completed near 367.71 — a textbook ABC flat with the internal wave b forming a higher low at 223.17.
Initially, this structure looked like the beginning of a bullish impulse. The drop to 273.22 perfectly tagged the 0.618 Fibonacci retracement, and it was tempting to label it as Wave 2 of a new impulse. However, that bullish view began to crack when the bounce from 273.22 appeared to be a three-wave move, not a clean five-wave impulse. More importantly, Wave 4 of this move overlapped the price of Wave 1 — a key violation that rules out a typical impulse and instead suggests the move was a leading diagonal.
This view is supported by the RSI, which revealed bearish divergence as price climbed from 350.00 to 367.71 — price made a higher high, but RSI made a lower high, indicating fading momentum. That divergence, combined with the overlapping structure, tilts the probability toward a bearish scenario now unfolding as Wave Y.
If this view plays out, the decline from 367.71 may be the start of Wave a of Y in a final zigzag correction. The projected path would take Tesla lower in a 5-3-5 structure, with potential support near or below the March lows. The bearish view remains valid as long as price stays below 367.71 — the clear invalidation point. A move above that level would force a reevaluation and potentially revive the bullish case.
At this point, the market has spoken — and it's whispering bearish. The structure favors caution unless bulls reclaim momentum with strength.
Disclaimer: This analysis is for educational purposes only and does not constitute investment advice. Please do your own research (DYOR) before making any trading decisions.
TSLA JUNE 20 2025 READ NOTESThis is momentum based price targeting & Tesla can easily do $390 but before that 342 is a solid resistance. From there we can get a dip and then price can continue the up move further
ANY NEWS IS TO BE AVOIDED
Now price action which is way superior is clearly suggesting the same up move.
I fact RSI is saying $400++ can come but it would be super dafe to exit around $390
If you nave any doubts then you can leave a comment.
TSLA – Long Trade Analysis (30-min chart)!📈
🟢 Chart Pattern: Symmetrical Triangle Breakout
Price is breaking out of a tight triangle, indicating potential momentum buildup. Volume spike confirmation would strengthen the move.
🛒 Entry: Around $322.05 (breakout zone)
🎯 Target Levels (Upside):
TP1: $327.38 (minor resistance)
TP2: $333.72
TP3: $339.71 (strong resistance zone from early June)
🛑 Stop-Loss:
Below $317.30 (triangle base support and recent consolidation low)
This gives a risk/reward ratio of approx. 1:2.5, which is solid.
🧠 Why This Setup Makes Sense:
TSLA is moving ahead of the June 22 robotaxi event
Strong support trendline from June 6
Breakout is aligning with bullish sentiment and upcoming catalyst
Market is bullish overall, helping large-cap tech
⚠️ What to Watch:
Watch for fake breakouts — wait for candle close or volume confirmation
Be ready for volatility as event news can cause whipsaw action
Option traders: Consider bull call spreads if IV is high

Tesla🚗 Tesla (TSLA) – Long-Term Bullish Outlook 📈
Tesla is showing extreme bullish strength across higher timeframes, supported by strong fundamentals, innovation momentum, and institutional interest. The current price action suggests a solid long-term buying opportunity for patient investors and swing traders alike.
🔍 Technical Outlook:
The stock has broken key resistance levels and is maintaining higher lows.
Momentum indicators support continuation of the uptrend.
Volume and sentiment remain favorable.
📅 Investment Horizon:
Mid to Long Term (Up to 2 Years)
🎯 Target Levels:
➡️ 500 – First major resistance
➡️ 700 – Medium-term breakout target
➡️ 900 – Long-term bullish target based on macro and chart structure
📌 Strategy:
Buy on dips or sustained breakouts. Suitable for long-term portfolios with a 1–2 year holding perspective. Risk management and scaling in recommended.
💬 This is not financial advice. Always do your own research and manage risk appropriately.
#TSLA #Tesla #Stocks #TradingView #Investing #Bullish #LongTerm #SwingTrade #GrowthStocks

Bullish Setup Suggests Rally Towards $350 Zone
- T1 = $340.00
- T2 = $350.00
Stop Levels:
- S1 = $315.00
- S2 = $310.00
**Wisdom of Professional Traders:**
This analysis synthesizes insights from thousands of professional traders and market experts, leveraging collective intelligence to identify high-probability trade setups. The wisdom of crowds principle suggests that aggregated market perspectives from experienced professionals often outperform individual forecasts, reducing cognitive biases and highlighting consensus opportunities in Tesla.
**Key Insights:**
Tesla continues to receive robust interest as macroeconomic conditions favor growth-oriented companies, particularly in the electric vehicle sector. The recent earnings showed signs of stabilization in gross margins, thanks to operational efficiency and cost reductions. Similarly, the company's megapack energy storage segment is gaining traction, which provides an ancillary growth avenue outside its core vehicle business. Technical indicators suggest strong momentum, with Tesla's Relative Strength Index (RSI) approaching bullish levels while trading volume supports the ongoing price recovery.
Furthermore, global EV adoption continues to rise, with increased government support for sustainable energy initiatives securing Tesla's place as a leading player. Supply chain constrictions, previously a concern, are relaxing, providing tailwinds for smoother production cycles.
**Recent Performance:**
Tesla's stock has gained over 8% in the past two weeks, recovering from its support levels around $305. The recent breakout above $320 signals renewed buying interest, accompanied by increased institutional participation. Short-term volatility has brought manageable dips, but overall momentum indicates bullish consolidation towards higher highs in its near-term trading range.
**Expert Analysis:**
Market strategists highlight Tesla’s ability to outperform its competitors due to vertical integration, advanced battery technologies, and scaling of operational efficiencies. Technical analysts note Tesla hovering near an ascending triangle formation with breakout potential above $330. Analysts also observe robust support around $310, which acts as a safety net for downside risks. Moving averages, especially the 50-day and 200-day lines, are converging as they indicate sustained bullish sentiment.
**News Impact:**
Recent news regarding expanded production facilities in Europe and positive developments in autonomous driving technology have fueled optimism among investors. Further bolstering sentiment is CEO Elon Musk’s strategic focus on prioritizing volumes over short-term profit metrics—a move widely seen as prudent given the current competitive landscape in EV markets.
**Trading Recommendation:**
Tesla is primed for upside momentum and presents an attractive long opportunity for traders targeting $340 and $350 next price zones. Its technical and fundamental outlook support the bullish case as macroeconomic tailwinds and company-specific factors align for higher valuations. Focus on maintaining risk discipline by exiting trades if stops at $315 or $310 are breached. For patient investors, Tesla is likely to remain a candidate for continued capital appreciation.
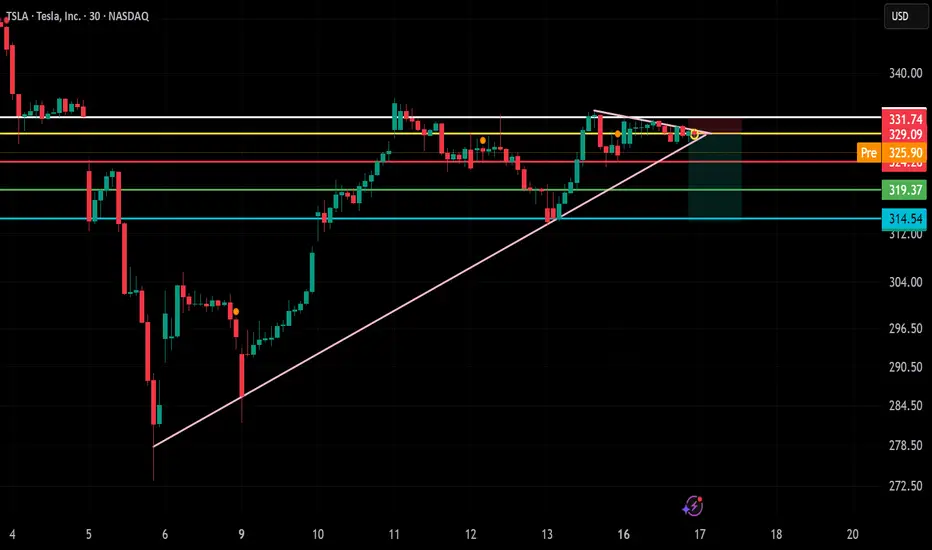
TSLA – Short Trade Setup!📉
🔍 Pattern: Rising wedge breakdown
📍 Entry: ~$329.09 (breakdown candle near resistance)
🎯 Target: $319.37 (first support), $314.54 (major support)
🛑 Stop-loss: $331.74 (above wedge and resistance zone)
✅ Why this setup?
Price is rejecting from wedge top + supply zone
Bearish structure with lower highs forming
Clear breakdown below ascending trendline
Good risk-reward targeting previous demand zones
🕒 Timeframe: 30-minute
📈 Bias: Short / Reversal from resistance