$TSLA | Robotaxi Launch Incoming? - Plan Rock Solid w/ 3 TradesNASDAQ:TSLA
Launch could be as soon as Sunday, June 22. However, Musk has emphasized safety as priority. There is the potential to undercut traditional taxi services at less than $0.20 per mile. Tesla’s government and military contracts are key growth drivers but further clash between Musk and President Trump could cause further volatility in price action. Long-term $271 is a critical price point. There are several ways to play Tesla:
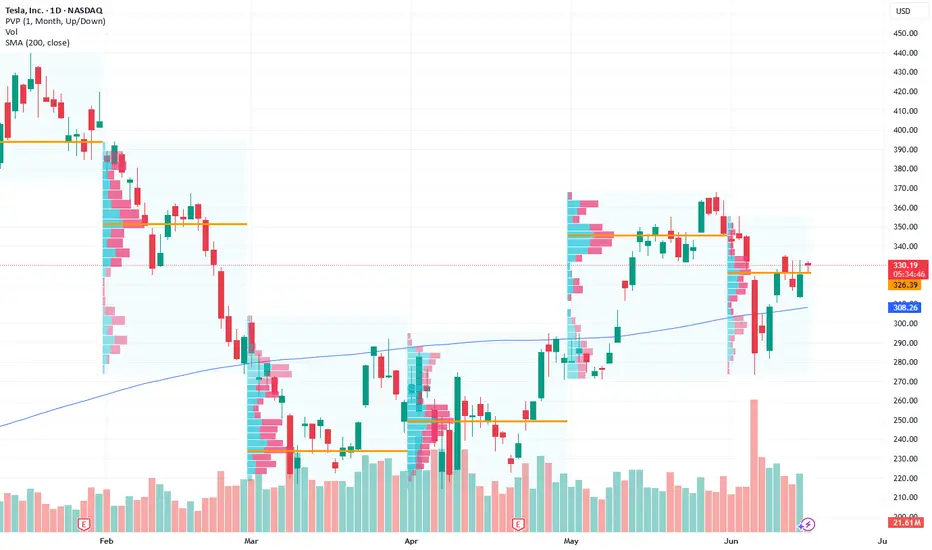
* Range between $270 and $350
* $330 to $400 into price discovery
* Breakdown under $270 targeting $212 and $204
TSLA trade ideas
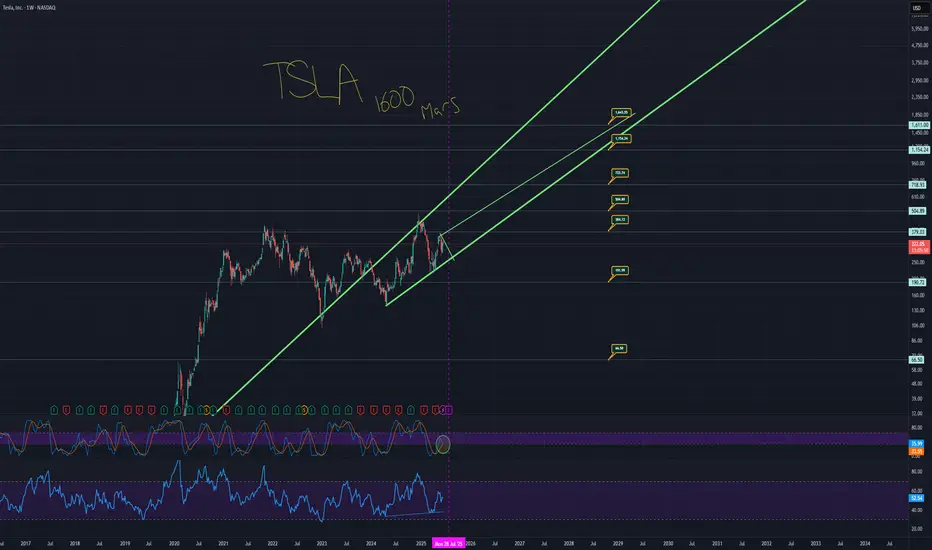
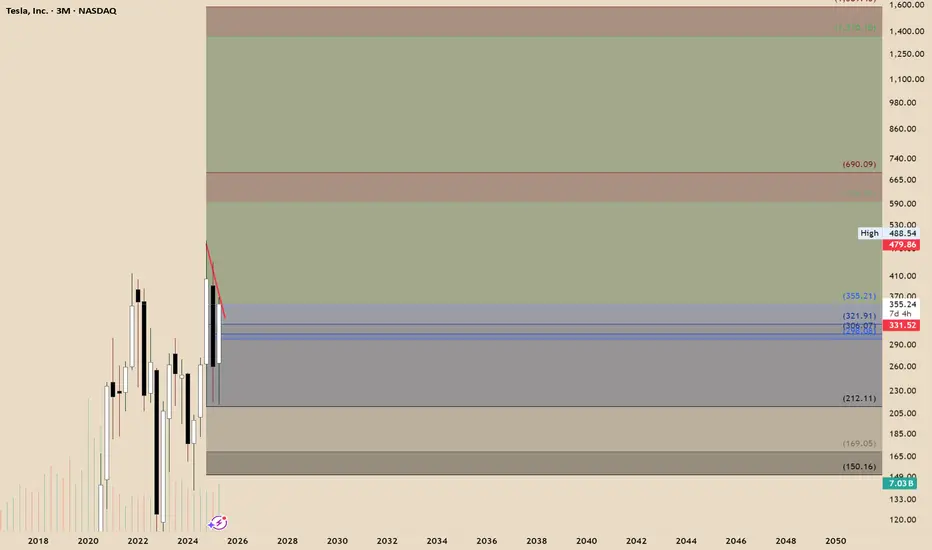
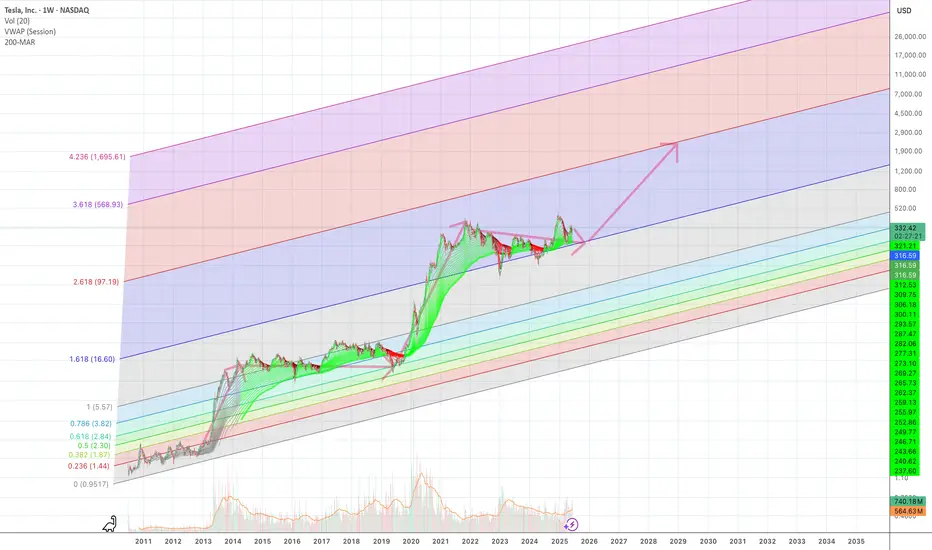
TSLA TO 1600, YOU SAW IT HERE FIRSTHere's the TA that takes Tesla legitimately to 1600.
The monthly chart has a trend that is currently acting as support.
The price has fallen under that trend.
Price action is also over a massive support trend from the weekly chart.
These are the two thickest green trends.
When you zoom back and look at TSLA as a whole, you see the bigger picture.
You have a situation where the low side takes you to around $60 to 70 dollars with a low of around $48. And then you have the high side taking you to around 1600. It sounds like a candidate for a stock reverse split.
Essentially, don't miss out on this potential solar data fast car thingy ready to really zoom.
Here is the chart with the auto fib numbers showing potential targets.
Remember, this likely doesn't occur all in one night, but the projection is really looking like it takes off from earnings. Projection line in yellow.
You have an opportunity where short term trends go to a strong long term trend which climbs to a support trend meaning price can literally take off from multiple of these trends meaning, we can price action go from 420 down to 250 and back up to 1600 in less than a year total.
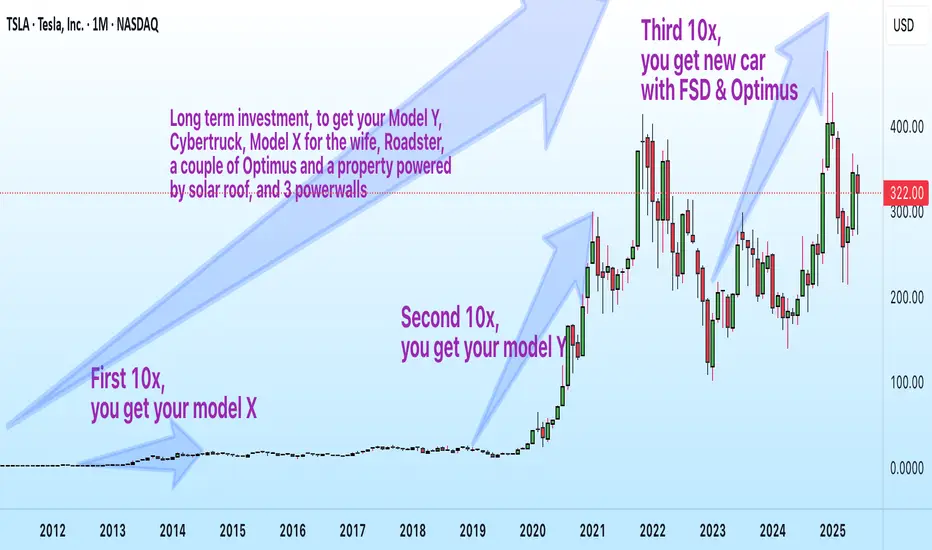
$TSLA Long-Term View: From $2 to $300+—How Far Can Vision Go?
📈 13-Year Monthly Chart of NASDAQ:TSLA
A $20,000 investment in Tesla back in 2012 wasn’t just a bet on a stock—it was a ticket to the future.
By 2014, those gains could’ve paid for a Model S.
By 2019, the same investment might’ve covered a Model Y and Model 3—one for you, one for your spouse.
Now, with Tesla pushing the limits of AI and robotics, could that investment soon deliver a full FSD suite and even a pair of Optimus robots serving in your home?
This chart tracks NASDAQ:TSLA ’s incredible rise—from just $2.19 in 2012 to $319.50 in June 2025.
Sometimes, holding is innovation.
TSLA: Anyone knows this powerful pattern?TSLA:
Anyone knows this powerful pattern?
The crowd gets lost in colorful indicators, forgetting that the market speaks clearly through just price and volume.
.
US STOCKS- WALL STREET DREAM- LET'S THE MARKET SPEAK!
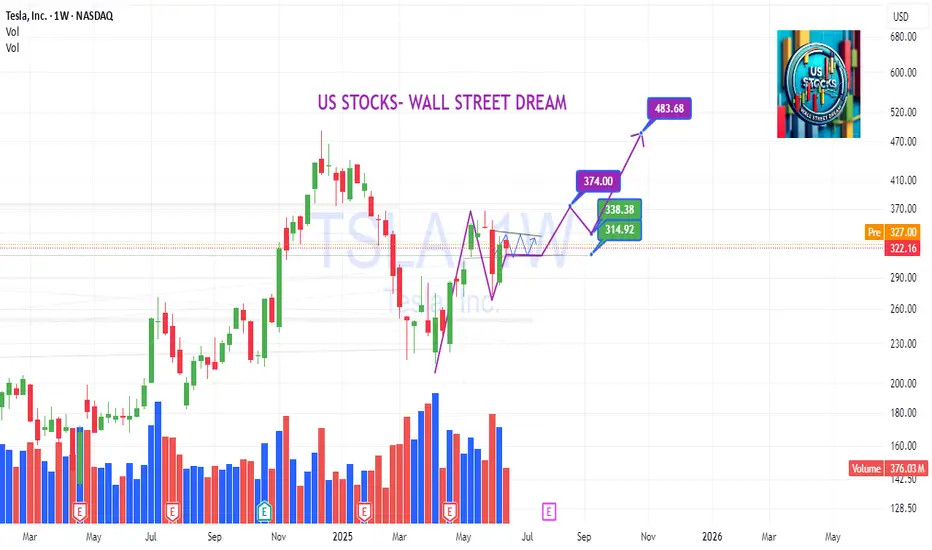
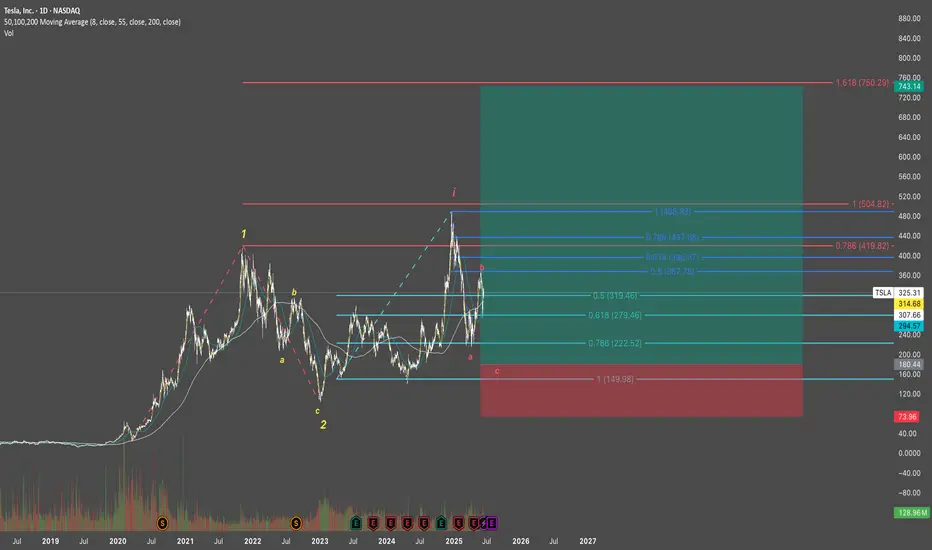
A Bullish Long-Term Outlook Tesla continues to present a compelling case for long-term investors, underpinned by its innovation-led growth trajectory and emerging dominance in autonomous mobility. Technically, recent market structure reveals an imbalance within a quarterly bullish breaker, suggesting further price expansion. If macroeconomic conditions remain favorable, the next algorithmic target zones fall between $594 and $690, signaling potential upside.
On the fundamental front, Tesla’s recent moves—particularly its rollout of the robotaxi network—have ignited fresh investor optimism. Analysts now estimate that autonomous driving could account for a substantial portion of Tesla’s future valuation, with some long-range forecasts placing the stock above $2,000 within the next several years.
While short-term pressures such as softening EV demand and regulatory barriers persist, Tesla’s consistent execution on AI-driven mobility may unlock new valuation territory.
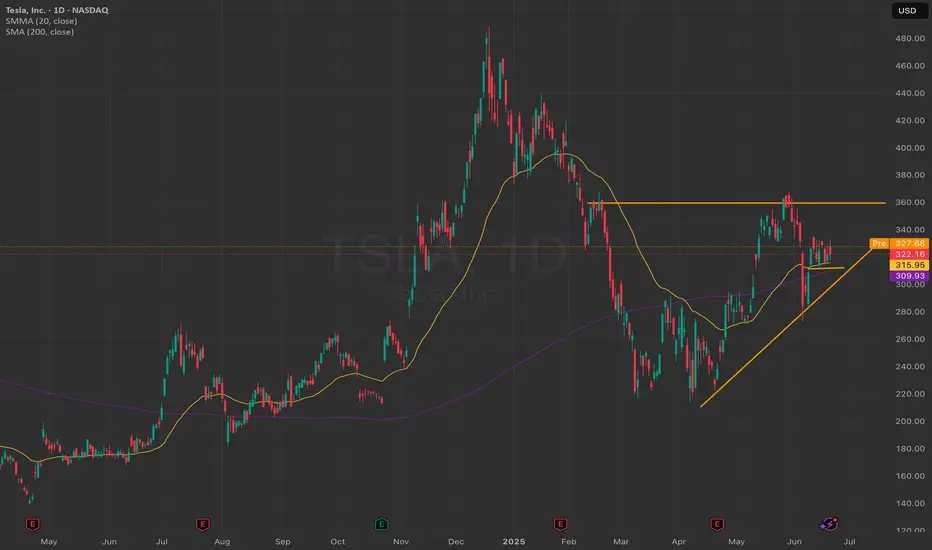
TSLA ready to head higherTSLA at the 200 SMA coming out of a sell off.... After the RoboTaxi debut, may get positive momentum to go higher ...
TESLA LONG IDEAThe overall trend of TSLA is bullish. However, it has been retracing for a while. Currently, there's a confirmation showing that the stock is ready for a rally, targeting the previous high.
Using Structural Range Concept (SRC), a subset of Smart Money Concept (SMC), price has shown an intention to resume bullish trend. There was a mitigation of a demand zone in the discount level which led to an internal bullish break of structure, confirming the intention to go up.
A retracement into the demand zone is necessary to maximize return while minimizing risk. Entry is around $258.25 while the exit is around $210.72 and the final target is around $488.10. The risk reward ratio (RRR) is about 4.9 (that is, 4.9x of the risk).
Confluences for the long idea:
1. The trend is bullish
2. Price is in discount level
3. Price has given internal break of structure with inducement after mitigating a valid demand zone.
4. Price is also respecting bullish trend line.
Disclaimer: This is not a financial advice. Don't take the signal if you don't accept the risk. The outcome maybe different from the projection.

TSLA Breaking Out! Is This Just the Beginning or a Trap? Jun 24 🔥Price Action Overview:
TSLA had a powerful move, jumping +8.23% to $348.68. It cleared key resistance and now consolidates near $349–350. Volume surged, but we’re seeing a bull flag structure with some internal weakness forming.
🧠 Smart Money Market Structure (15-min Chart)
* CHoCH occurred before the breakout, showing smart money accumulation.
* Break of Structure (BOS) confirms bullish intent.
* Price is now ranging in a supply zone, rejecting upper levels with signs of compression.
* Consolidation wedge suggests a possible breakout or fakeout setup.
🔮 Gamma Exposure (GEX) Breakdown (1h Chart)
* Current Price: $348.68
* Gamma Resistance (Call Wall):
* $357.53 → 1st resistance
* $365.00 → heavy resistance
* $367.5 → Extreme Call Wall / GEXY8
* Gamma Support:
* $340 → strong support
* $320 → HVL (High Volume Level) and PUT defense
* $315 / 312.5 → 2nd PUT Wall (if breakdown)
Interpretation:
Price is trapped between GEX compression levels. A breakout above $350 could trigger a gamma squeeze toward $357–360+. A breakdown below $340 targets $320 fast.
📈 Indicators Snapshot
* Volume: High on the breakout, but tapering off during consolidation.
* RSI/MACD (not shown): Likely cooling off — favoring a pullback or re-accumulation.
* CHoCH & OB Zones: Indicate smart money watching $340-$345 for support retest.
⚖️ Scalping vs Swing Outlook
✅ Bullish Case
* Break above $350 → Watch $357.50 and $365 targets.
* Above $367 = gamma squeeze zone unlocked.
Entry: Break and hold $350
Target: $357.50, then $365
Stop: Below $345
⚠️ Bearish Case
* Break below $340 → Flush to $320 and possibly $315
* GEX puts will dominate under $320
Entry: Break and hold below $340
Target: $320, $315
Stop: Above $345
🧭 Trade Strategy Summary
* ⚔️ Inflection Zone: $340–$350 = Decision zone
* 🚀 Watch for gamma squeeze if $350+ holds
* 🛑 Breakdown below $340 flips bias bearish
* 🔄 Volume confirmation is key
Disclaimer: This analysis is for educational purposes only and does not constitute financial advice. Always do your own research and manage risk carefully.

Quick View: $TSLA
- Bullish Box on the daily chart supported by the ema50d and strong ema 21d and 9d. No volume on this box.
- Almost the same pattern on the hourly
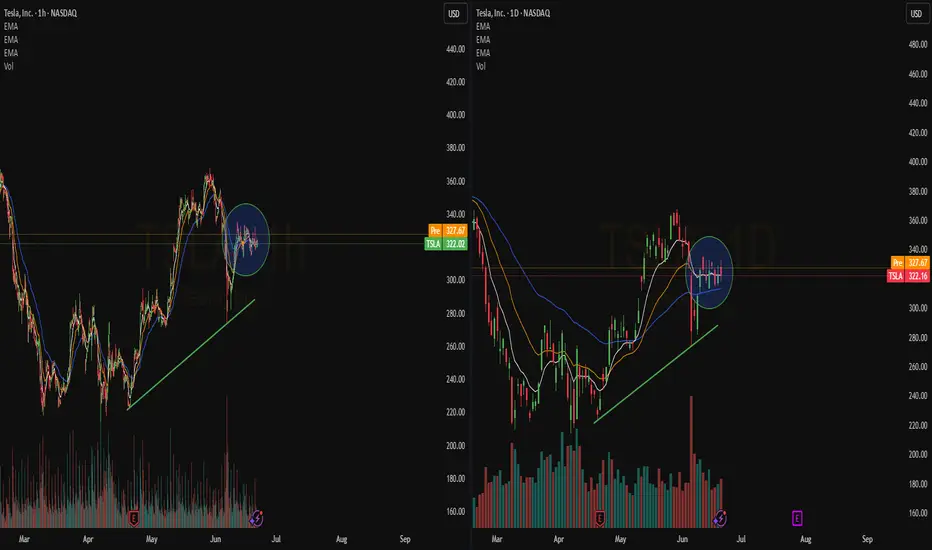
Take a bullish position on TSLA as price action confirms upside
Current Price: $325.31
Direction: LONG
Targets:
- T1 = $335.00
- T2 = $345.00
Stop Levels:
- S1 = $320.00
- S2 = $315.00
**Wisdom of Professional Traders:**
This analysis synthesizes insights from thousands of professional traders and market experts, leveraging collective intelligence to identify high-probability trade setups. The wisdom of crowds principle suggests that aggregated market perspectives from experienced professionals often outperform individual forecasts, reducing cognitive biases and highlighting consensus opportunities in Tesla.
**Key Insights:**
Tesla has shown substantial resilience in the tech-heavy market, with bullish sentiment linked to its innovative product lineup, particularly autonomous vehicles and the forthcoming robo-taxi launch. Institutional investors have actively increased positions, signaling long-term confidence in Tesla’s disruptive growth narrative. However, mixed profitability metrics and emerging competition in the global EV space keep valuations under scrutiny. Tesla’s price action around $325.31 suggests that the optimism surrounding potential catalysts outweighs near-term concerns, with technical momentum favoring further upside gains.
**Recent Performance:**
Tesla has demonstrated significant strength in recent trading sessions, successfully recovering from a minor pullback that aligned with broader market volatility. The stock climbed steadily from its $300 support level and has outperformed the broader tech sector during a period of overall market uncertainty. Heavy volume and speculative trading suggest strong engagement from both institutional and retail participants.
**Expert Analysis:**
Technical outlook for Tesla indicates bullish divergence on the daily Relative Strength Index (RSI) coupled with a successful retest of its 50-day moving average. These factors affirm that momentum remains firmly to the upside. Analysts highlight Tesla’s ability to set remarkable trends within the EV sector, backed by advancing autonomous technologies and renewable energy solutions. Near-term resistance sits at $335, where a breakout would likely trigger further upward movement toward $345.
**News Impact:**
Recent news regarding Tesla’s upcoming robo-taxi launch in June has considerably bolstered investor sentiment. Market participants view this innovation as a key milestone that could redefine Tesla’s growth trajectory. However, declining EV sales in Europe and the United States remain a concern, potentially capping excessive bullish momentum. Traders should watch for more clarity on macroeconomic factors influencing demand.
**Trading Recommendation:**
Tesla’s combination of technical strength and ground-breaking product developments underpins a favorable trading outlook. A long position with well-defined stops below $320 offers an attractive risk/reward setup, targeting $335 and $345 sequentially. While global sales trends warrant close monitoring, Tesla’s leadership within the EV and tech space supports a bullish thesis in the short term.
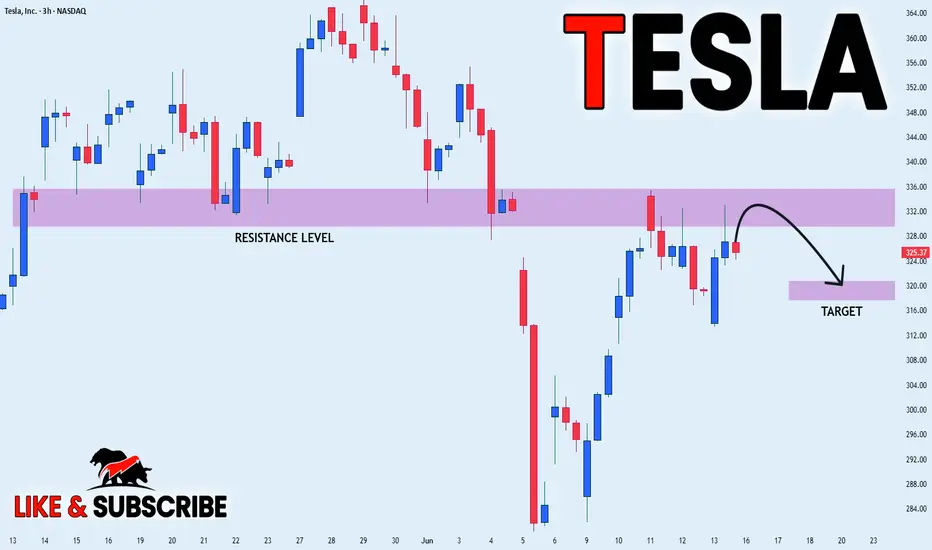
TESLA WILL GO DOWN|SHORT|
✅TESLA is going up now
But a strong resistance level is ahead at 336$
Thus I am expecting a pullback
And a move down towards the target of 320$
SHORT🔥
✅Like and subscribe to never miss a new idea!✅
Disclosure: I am part of Trade Nation's Influencer program and receive a monthly fee for using their TradingView charts in my analysis.
TSLA UPSIDE? BULLISH?Thoughts on Elliott Wave pattern applied to TSLA DAILY chart. Please do share thoughts, my belief is were are in a primary third wave, expect 5 impulse waves of minuet up. Hearing good things from tesla again recently.
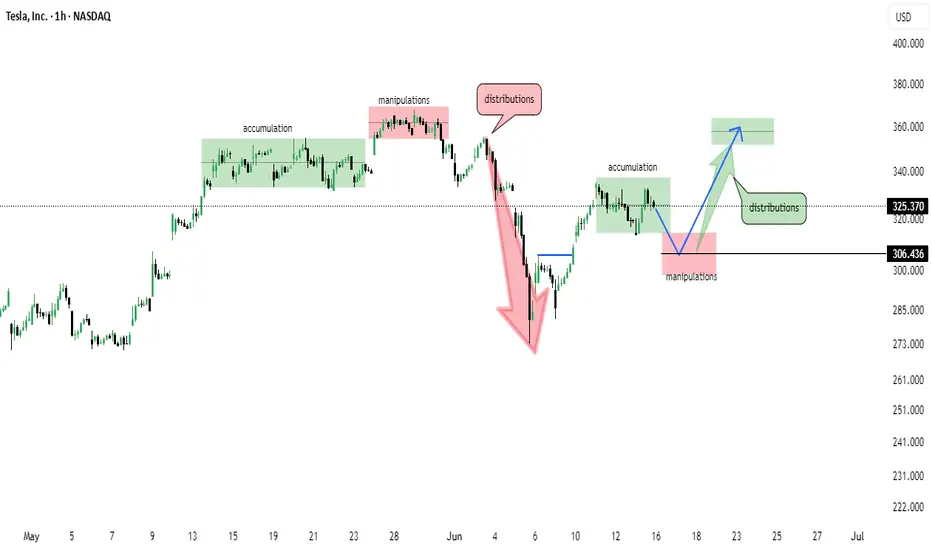
Tesla (TSLA) 1H Chart – Wyckoff Cycle in ActionThis chart reflects a textbook Wyckoff pattern unfolding on TSLA’s 1-hour timeframe:
🔹 Accumulation Phase observed early May
🔹 Followed by Manipulation & Distribution – classic trap before markdown
🔹 Sharp selloff led to another Accumulation zone around $305
🔹 Further manipulation wicks indicate smart money involvement
🔹 Now projecting a move towards $360–$370 distribution zone
📌 Structure breakdown:
Smart Money Accumulation ➡️ Manipulation ➡️ Distribution
Bullish momentum building from $306 support
Eyes on reaction near the marked green distribution box 📦
📅 As of June 15, 2025 – chart aligns with Wyckoff theory and institutional behavior.
Near bottom. On The way To $2k as The Singularity Approaches see chart.
Near bottom. On The way To $2k as The Singularity Approaches .
TSLA shortPart of a larger analysis, at the moment Tsla rejected 332 B pivot and imo retesting possible b.o. area. missed gap up open, retest of highs sent 305p strike. looking to close at 310-305 tgt zone. n.f.a. g.l.h.f

Tesla (TSLA) Shares Rebound After Sharp DropTesla (TSLA) Shares Rebound After Sharp Drop
When analysing the Tesla (TSLA) stock price chart six days ago, on the morning of 5 June, we:
→ highlighted Elon Musk’s critical comments regarding the spending bill promoted by the US President;
→ noted that a potential rift between Musk and Trump could have long-term implications, including for TSLA shares;
→ outlined an ascending channel (marked in blue);
→ suggested that the price might correct from the upper to the lower boundary of the channel.
This scenario played out rather aggressively: later that same day, during the main trading session, Tesla’s share price dropped sharply to the lower boundary of the channel amid a scandal involving Musk and Trump.
However, the lower boundary of the channel predictably acted as support. Yesterday, TSLA shares were among the top five performers in the S&P 500 index (US SPX 500 mini on FXOpen), gaining around 5.6%.
As a result, TSLA stock price climbed back above the psychologically important $300 mark, recovering from the previous week’s sell-off.
Why Are Tesla (TSLA) Shares Rising?
Bullish drivers include:
→ The upcoming launch of Tesla’s robotaxi service, provisionally scheduled for 22 June. Elon Musk has stated he intends to use the service himself.
→ Easing of tensions with the US President. Donald Trump declared that he has no intention of "getting rid of Tesla or Starlink" should he return to the White House.
→ Continued support from Cathie Wood, the prominent asset manager, who once again reaffirmed her confidence in Tesla’s future success.
Technical Analysis of TSLA Chart
Today, TSLA’s share price is hovering near the median line of the previously identified ascending channel – a zone where supply and demand typically seek equilibrium.
Also worth noting is the $320 level: in May, it acted as support, which suggests it may now function as resistance.
Given these factors, it is reasonable to expect that the sharp recovery from the 5 June low may begin to lose momentum, with the price likely to stabilise and form a consolidation range following the recent spike in volatility.
This article represents the opinion of the Companies operating under the FXOpen brand only. It is not to be construed as an offer, solicitation, or recommendation with respect to products and services provided by the Companies operating under the FXOpen brand, nor is it to be considered financial advice.

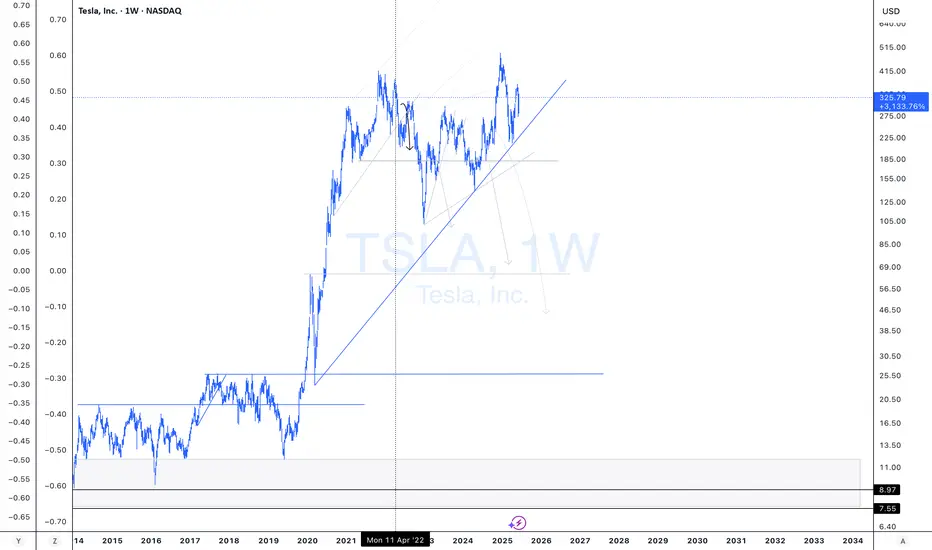
TSLA Short Entry | Recession UnderwayI have added to NASDAQ:TSLA short.
I have also linked my previous Tesla short chart from 2022.
Nothing has changed with Tesla. The company is severely over-valued.
I will continue to provide updates.
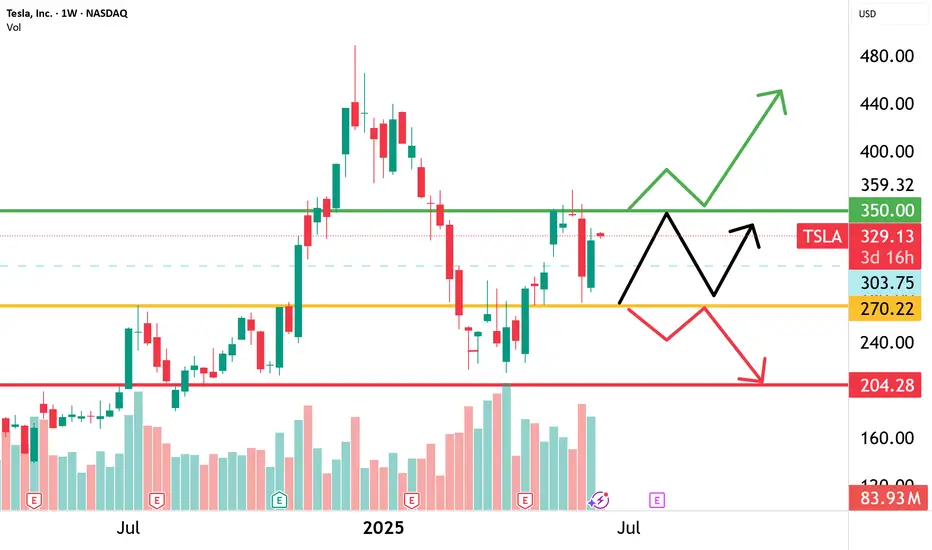
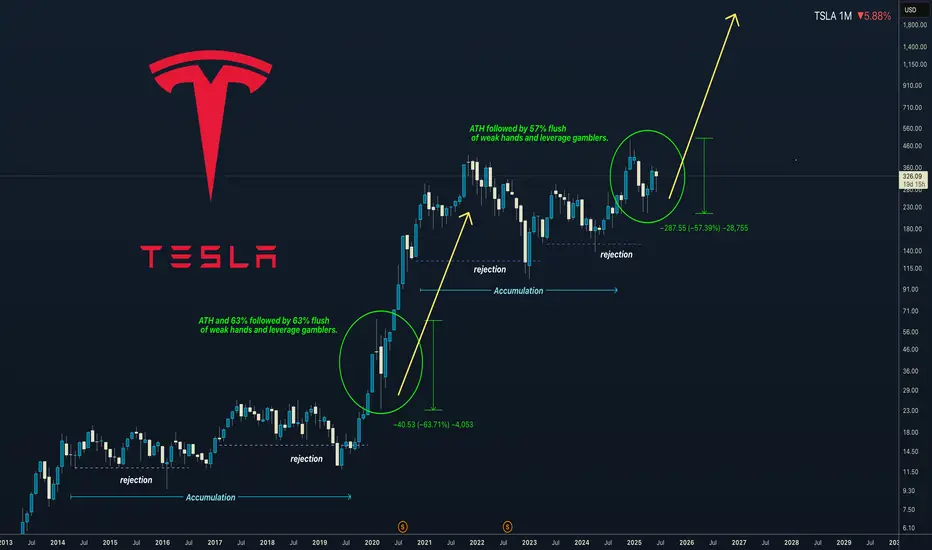
Tesla Crashed 57% — Here’s What History Says Happens AfterThose who knows me you know Im Tesla Bull. I got a longterm vision for Robotics and AI. Which I think Tesla will be big part of it. Whether you like Elon Musk or not Tesla will participate. Can. his behavior and politics acitivities affect Tesla stocks? Absolutely, Im aware that this is risky long term investment. I got numbers which I follow, shared in my previous Tesla ideas.
Here is a just price action and historical perspective - History doesnt repeat but it definitely rhymes and I can see this pattern repeating. Here is a key points.
5 years accumulation
Few big dumps followed by rejections
Break out and new ATH
ATH imidiatelly followed by 60% dump
After Dump price expanded 1000%
Currently we are at point 4.....
Will the history repeat ??
I dont know and Im not shilling anything, its my view which Im betting on based on the data from the expert analysts which I shared in this posts.
PS: Every of mine Tesla idea gets too emotional comments. I get it, you hate Elon, or you have different opinions. Fine I respect that, but please stay civil, it's not necessary to attack person on the internet for having different opinion.
Have a gret day !!
Called and bought $200 bottom
Long term vision
TESLATesla is in the correction right now for bigger structure. It can go up to break the recent top with small correction or it can breakdown further before a push up.
Disclosure: We are part of Trade Nation's Influencer program and receive a monthly fee for using their TradingView charts in our analysis.
SPY & MegaCap strengthSPY saw a very strong gap up, negating most of the selling from last week.
despite rising tensions in the middle east - investors have shrugged off volatility and bought the initial dip.
This may be proving that "war" is good for stocks.
we observed a very close correlation between the indices and oil today.
As oil reversed higher - markets saw a bit of weakness. As oil fell markets rallied.
TSLA trying to break a 4 hour bullish pattern
META new Smart Glasses release causing a surge.
MSFT new all time high tap
NVDA firm with ripping semiconductors
GOOGL looking strong for continuation
AMZN moving nicely off support
AAPL lagging the mega's but positive

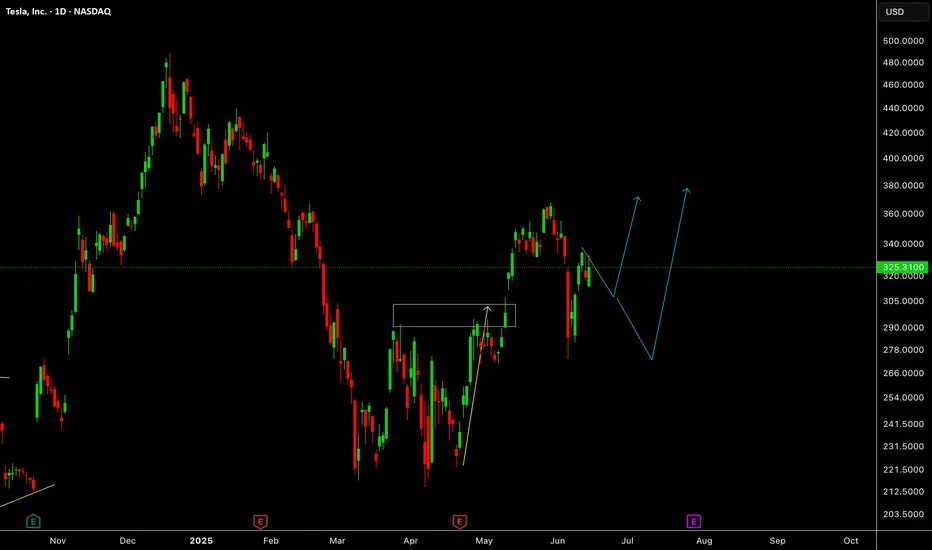
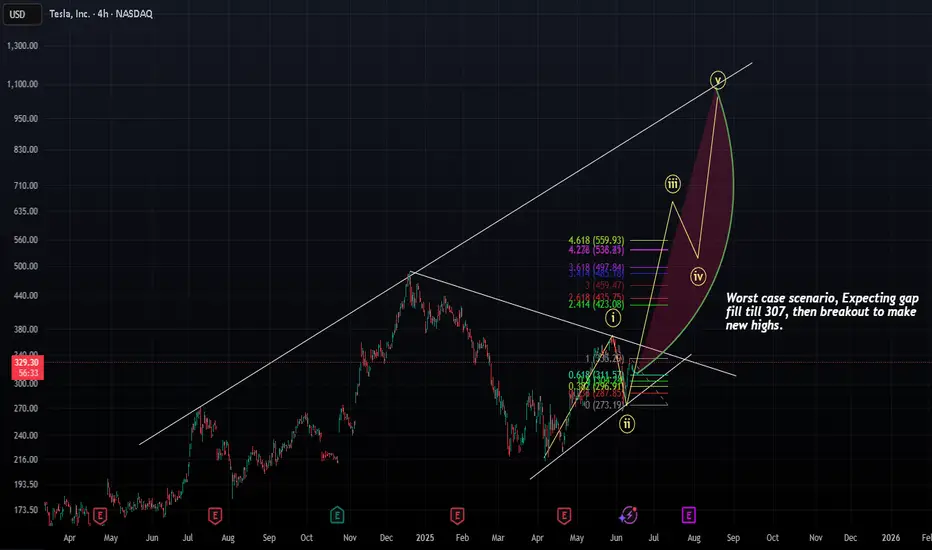
TESLA - Some consolidation, before parabolic moveAnticipating Tesla to consolidate, with a worst-case scenario of filling the gap down to $307, followed by a sharp parabolic rise to new all-time highs.
Get ready for a parabolic move :)
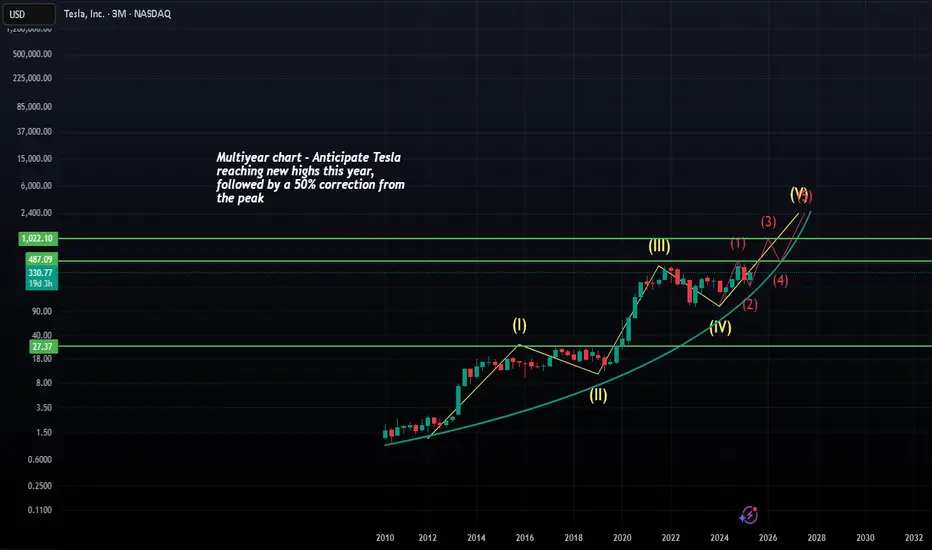
TESLA - Multiyear ChartI'm optimistic about Tesla's long-term prospects, viewing it as a multi-year investment. I anticipate Tesla reaching new highs this year, followed by a 50% correction from the peak to retest the breakout level. With patience, holding for years could yield strong returns.
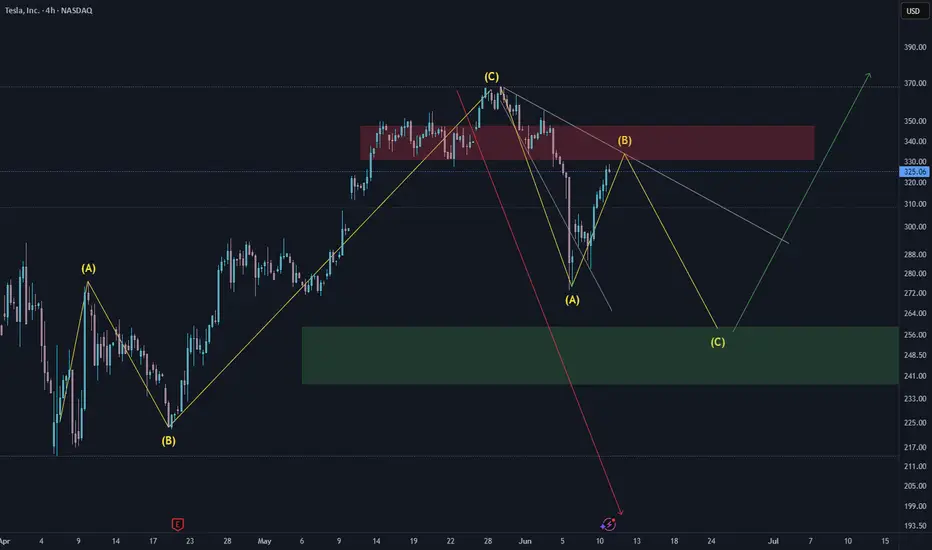
Possible retrace before upside moveThe initial upward move from 214 is corrective in nature. Since the current correction to 273 doesn't seem to be proper ABC correction, I am expecting further C wave correction to the Green box. Breaking the Red Box and the trendline with a retest will invalidate further downward correction. Based on the Major Indexes structure, I am not expecting Tesla to retrace below 213 as depicted by red line .
Note
**Disclaimer** : All details shared here is for educational purpose only. Please do your own research and consider appropriate risk management before making short term or long-term investment decisions.
Approach Market always with probabilities and make sure risk management in place.
Request your support by like, comment and follow