looking hella bullishThe price will likely shoot up during premarket, then capitualate, then have the real price movement when the market opens.
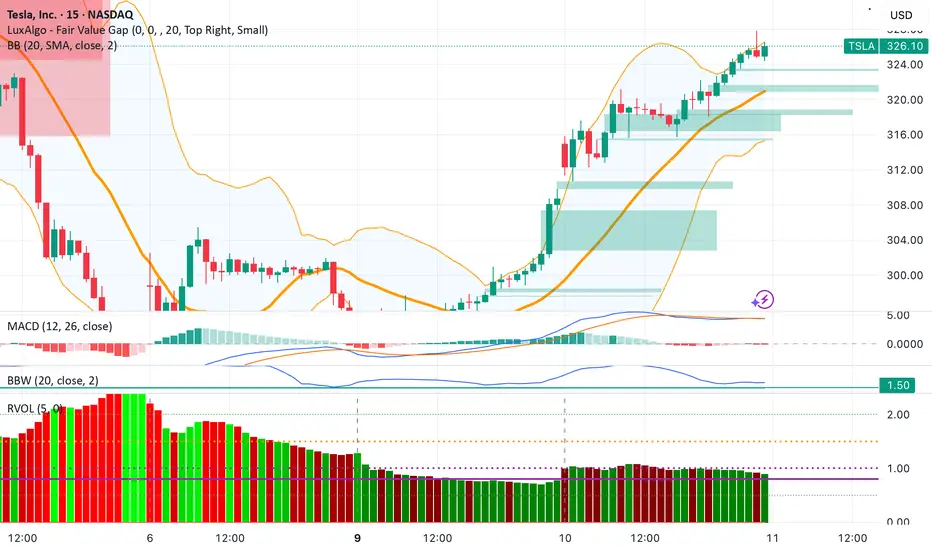
Price is getting squeezed tighter, likely will have a dramatic move.
TSLA trade ideas

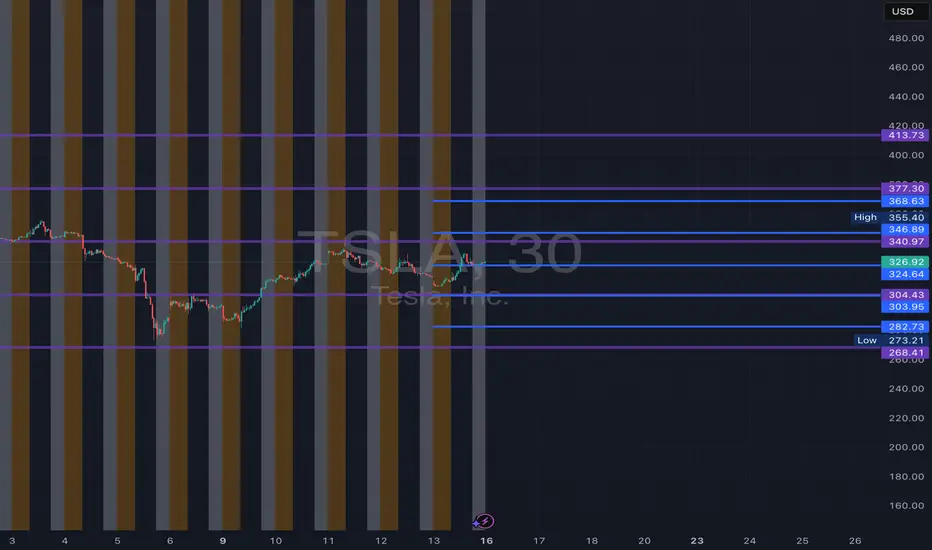
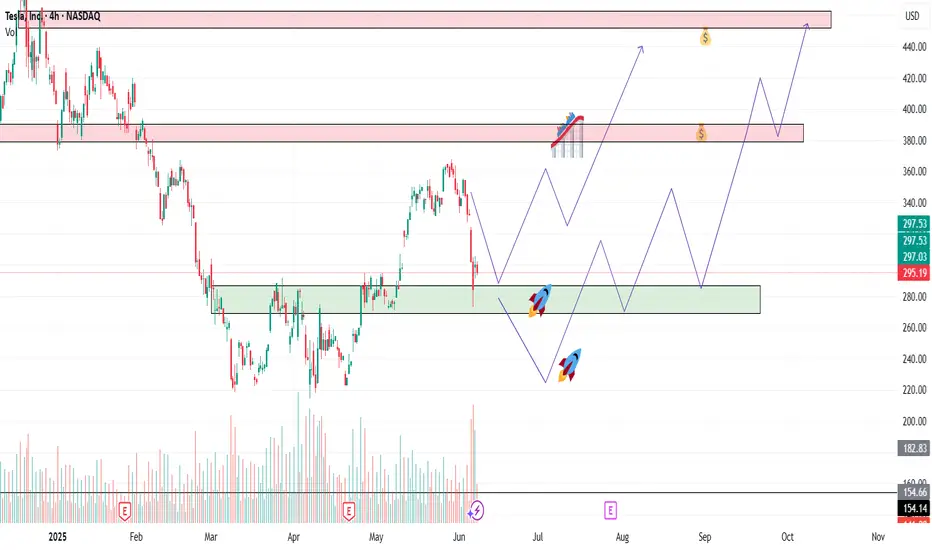
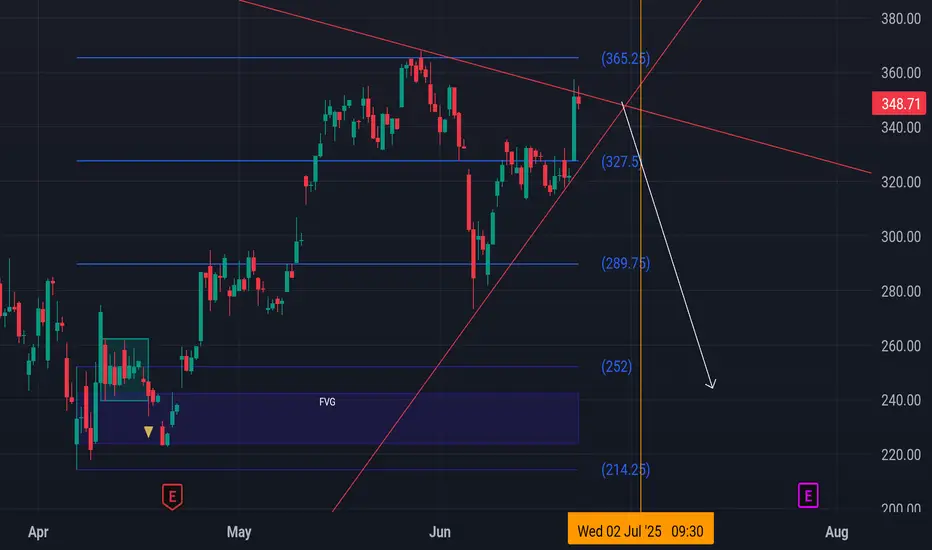
TSLA June 2025 Monthly Support & Resistance Lines Valid till EOMOverview:
The purple lines serve as support and resistance levels for TSLA stock throughout the month of June. When the price approaches these lines from either the bottom or the top, I will consider taking long or short positions in TSLA stock, depending on the direction of the price movement.
Trading Timeframes
I usually use 30min candlesticks to swing trade options by holding 2-3 days max. Some can also use 3hr or 4hrs to do 2 weeks max swing trades for massive up or down movements.
I post these 1st week of every month and they are valid till the end of the month.
Extra:
I added Blue Lines which are weekly line for June 16th to 20th.
Short TSLA, for nowdef juice to the downside right now, media attn is insane. But theirs major harmonics at play. and ill be buying at those lows and posting long, until then. dont fight it. t3 almost hit of momentum measure. actually insane moves
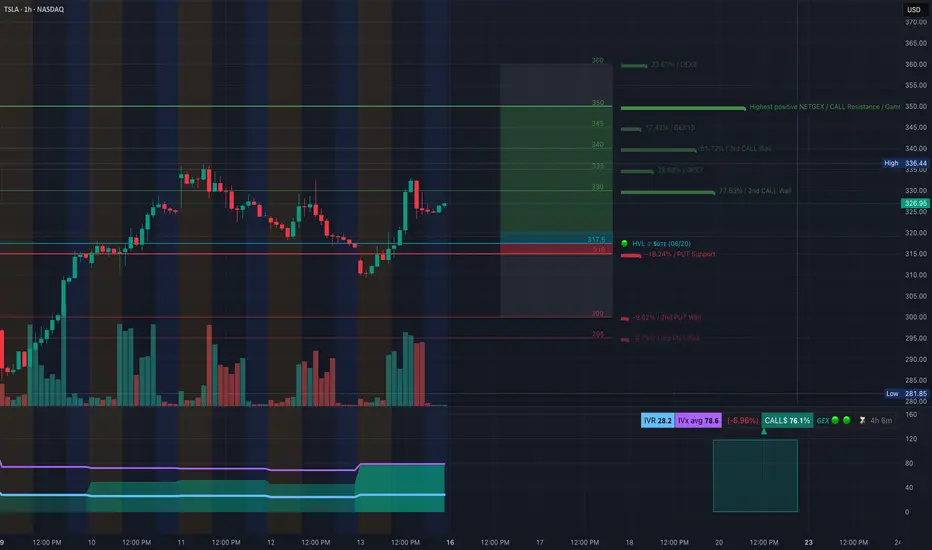
TSLA: Gamma & Price Action Aligning for Potential Bullish-Jun 16TSLA: Gamma Setups & Price Action Aligning for Potential Bullish Run
1️⃣ Options GEX Insights
* Gamma ‘walls’ building: Strongest Call protection at 335–350, anchored by the largest NETGEX/Call Wall — signaling substantial gamma support in that zone.
* Current call exposure stands at 76.1%, with puts at 23.9%. With IV suppressed (28.2 vs 78.6 avg), volatility is compressed—ideal for a quick rebound if triggered.
* Price is near 325, resting above the 317.5 HVL, and poised to test the gamma shelf near 335–340. Entry into 0–5DTE or 3DTE calls around 325–330 offers leverage as gamma accelerates through these walls.
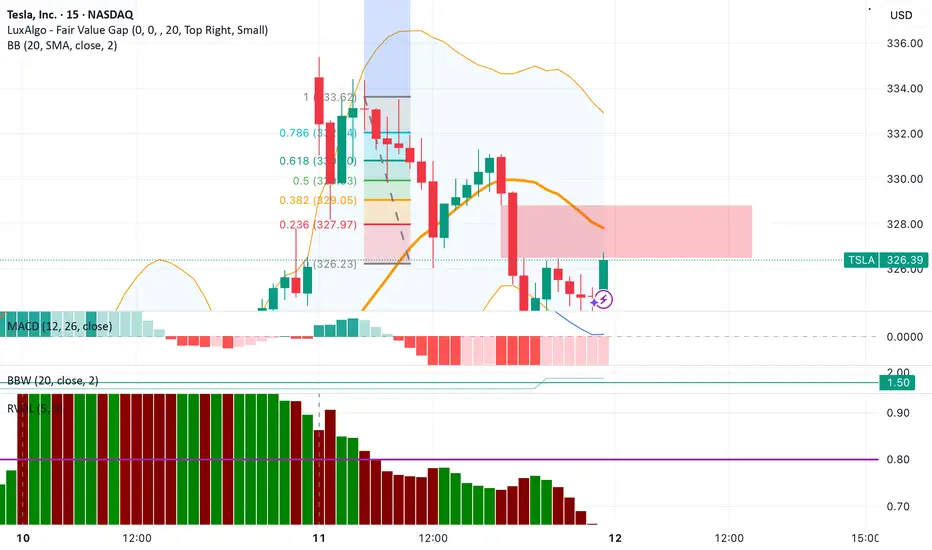
2️⃣ 15-Minute Chart & Trade Plan
* Structure: Broke down below ascending range, but just executed a bullish Break of Structure (BOS) reversal near 309–310.
* Current trend: Eyes stacked higher lows (HL), structure confirmed—momentum is rebuilding.
* Key Zones:
* Entry area: on pullback/support near 325–326
* Target: 332.99–335+ (aligned with Call Wall)
* Invalidation: below 319.11, which would signal loss of structure.
⏫ Trade Suggestion: Consider initiating a bull entry on dip into 325–326, targeting 332–335 for the short term, and scaling out or trailing into gamma resistance zones.
🧠 Why I’m Interested
The alignment here is compelling: Options flow shows strong net gamma support ahead, IV is low (less decay hit), and structure reset (HL + BOS) confirms a textbook SMC setup. TSLA is carving out a classic bull signal off gamma-based support—ideal for scalping or short-term leg trades.
🚨 Disclaimer
This is not financial advice—purely educational. Trade with proper risk management, and be aware options carry unique risks, including rapid theta decay and volatility shifts.
Gold silver the es and the Russell Friday 13 there's no time to have a long discussion here the information is in the video important things are happening in these markets and they are explained in the video. there are some changes suggesting that the silver may not actually go lower at this point even though the gold is holding for the time being .

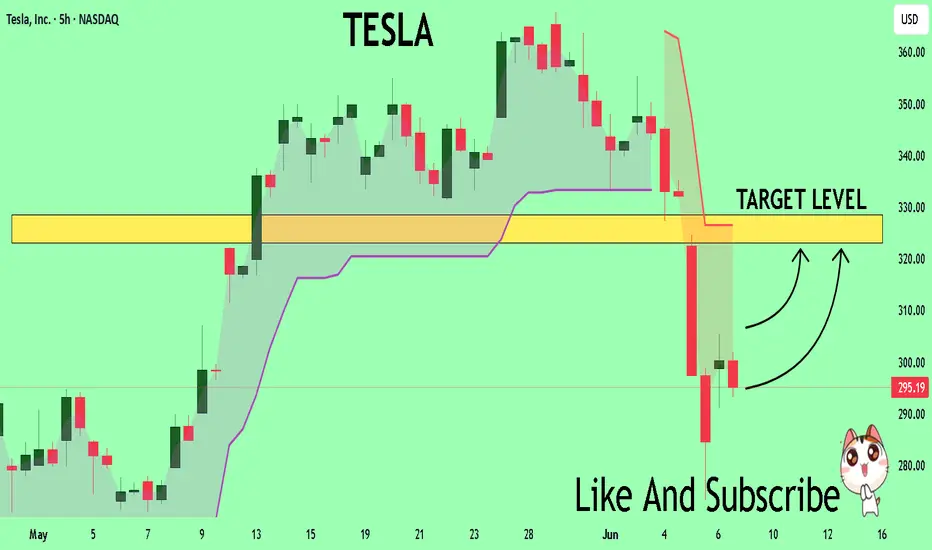
TSLA Rebounds from $290 | Buy the Dip or Political Trap?⚠️Just when it looked like Tesla was heading for a breakdown, we got a sharp bounce off the $290 level — and traders are watching closely. But here’s the twist: the move came after a headline-heavy week featuring none other than Trump vs. Elon.
🗞️ According to Politico, tensions flared after Trump made comments suggesting EVs were "doomed without government subsidies." Elon clapped back, defending Tesla’s profitability and independence. This added pressure on TSLA... and then came the bounce. Coincidence? Or whales buying fear?
📥 Entry Zones
• $290 – Strong demand zone, tested and respected
• $275 – Deeper retest if market pulls back
• $240 – Extreme fear level, unlikely unless macro worsens
🎯 Profit Targets
• $305 – Gap-fill magnet
• $320 – Resistance test
• $355+ – If Robotaxi or AI hype returns in force
TESLA Technical Analysis! BUY!
My dear subscribers,
My technical analysis for TESLA is below:
The price is coiling around a solid key level - 295.19
Bias - Bullish
Technical Indicators: Pivot Points Low anticipates a potential price reversal.
Super trend shows a clear buy, giving a perfect indicators' convergence.
Goal - 323.17
About Used Indicators:
By the very nature of the supertrend indicator, it offers firm support and resistance levels for traders to enter and exit trades. Additionally, it also provides signals for setting stop losses
Disclosure: I am part of Trade Nation's Influencer program and receive a monthly fee for using their TradingView charts in my analysis.
———————————
WISH YOU ALL LUCK
How I Got My Win Rate to 94.12% ($4.59 per $1 risk expectancy)There's a lot of people who talk smack about high win rates, probably to justify their low win rates.
The justification usually sounds something like this 'You do know the best traders have win rates under 50% and win rates mean nothing right?'. Nothing could be further from the truth in the context of the archetypal character who writes such a thing in trading view minds. A high win rate shows something very very important.. proof of edge.
Now if someone wants to believe I'm taking penny wins and dollar losses, be my guest but use your head...in fact, one better... use your eyes. There is a nice little stat there called 'profit factor', what it tells you is how many dollars profit per trade my expectancy is. Wake up, understand that not everyone is a trading guru scammer. Not everyones stats are fake, and if you want to see for yourself... its easy to do. Simply watch my livestream, there is no better proof of edge than that.

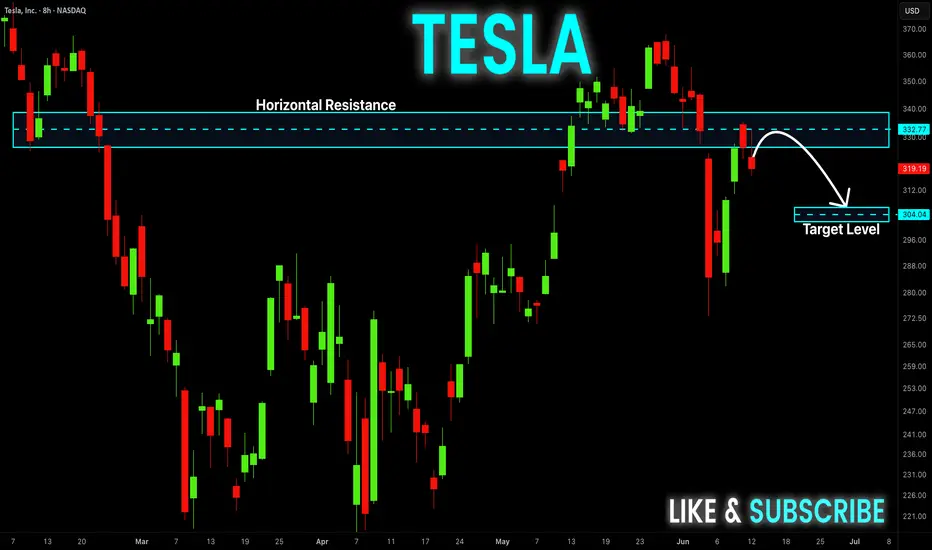
TESLA Will Fall! Sell!
Hello,Traders!
TESLA went up from the
Horizontal support but has
Hit a horizontal resistance
Of 335$ and we are already
Seeing a bearish pullback
So we will be expecting
A further local move down today
Sell!
Comment and subscribe to help us grow!
Check out other forecasts below too!
Disclosure: I am part of Trade Nation's Influencer program and receive a monthly fee for using their TradingView charts in my analysis.
$TSLA is making moves! 30% Upside Swing🚀 NASDAQ:TSLA is making moves!
The H5_S is almost there—just waiting for that green light 🟢 to lock in the entry!
🔥 Eyeing July 18th $325 Calls if we get the confirmation. Let’s see how this unfolds!
Not Financial Advice
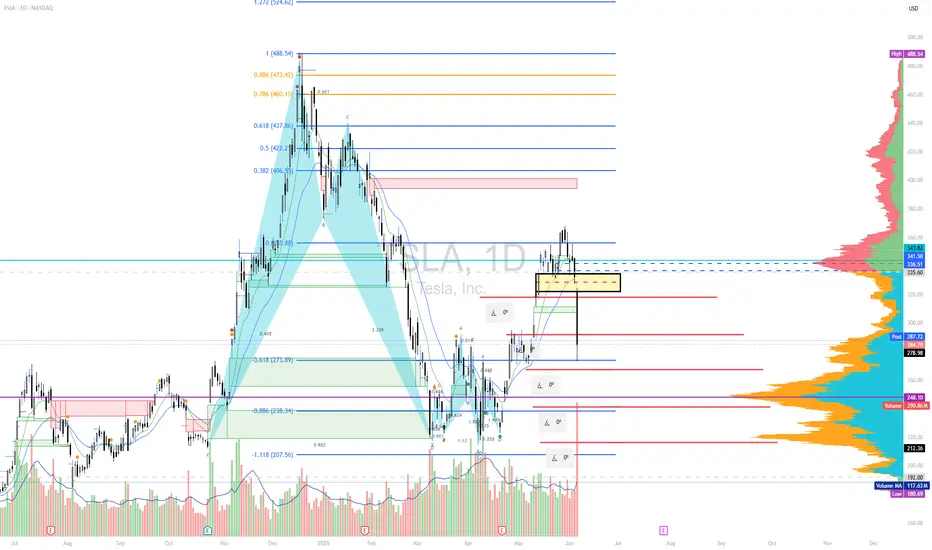
Tesla TSLA 🧠 Breakdown of this setup:
The pattern is an inverse head‑and‑shoulders, signaling a reversal from bearish to bullish momentum.
Technical commentators highlight crucial support near $300, suggesting that’s the fueling station before lift-off
After breaking the neckline, measured upside targets land in the $400–420 zone, fitting that “rocketship” trajectory vibe
🎯 Launch Pad & Destination
Pre‑launch dip: ~$300 sets the inverse H&S bottom.
Ignition point: Breakout above neckline brings liftoff.
Orbit target: ~$420—your mission succesfully completed.

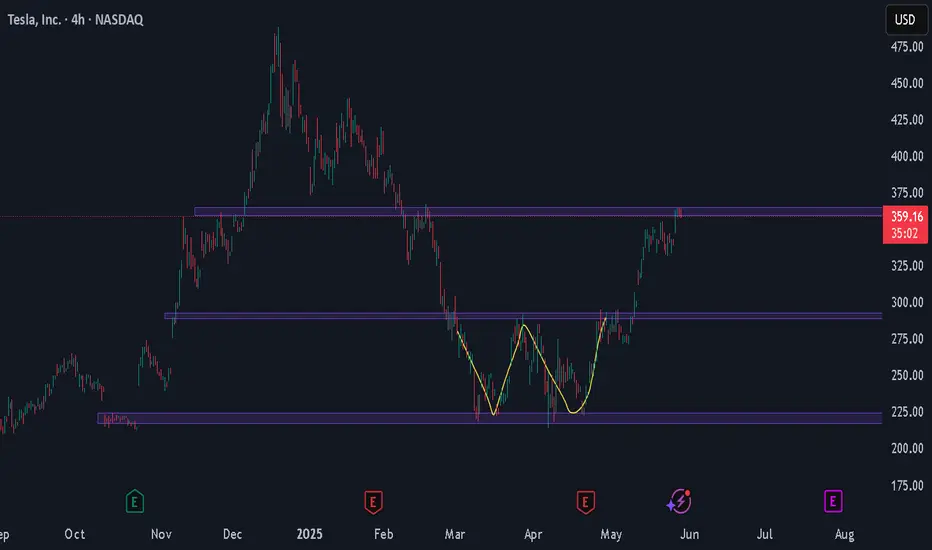
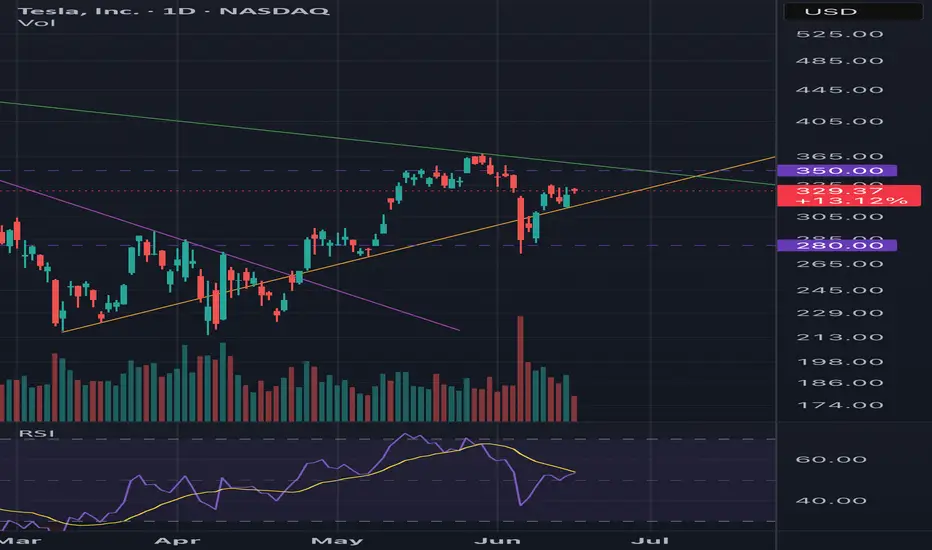
Tesla (TSLA) Share AnalysisHello, Tesla investors!
Tesla stock has gained good momentum recently, breaking the downtrend and rising to $362. This rise has been fueled by investor interest in Elon Musk's full-time return to the company's helm and the upcoming Robotaxi launch.
Technically speaking , the stock has formed a "double bottom" (W) pattern, and its target, $362, has been reached. However, we are now facing strong resistance at this level. If this resistance level is not surpassed with sufficient trading volume, we may see a short-term pullback.
The possibility of a short-term correction increases, especially with the RSI indicator approaching the overbought zone.
The $335 and $290 regions stand out as support levels. These levels are important to watch for possible pullbacks.
In summary , Tesla stock is in an important resistance zone. Breaking through this level with high volume could signal the start of a new uptrend. Otherwise, we may face a short-term correction. Consider these levels and technical indicators when making investment decisions.
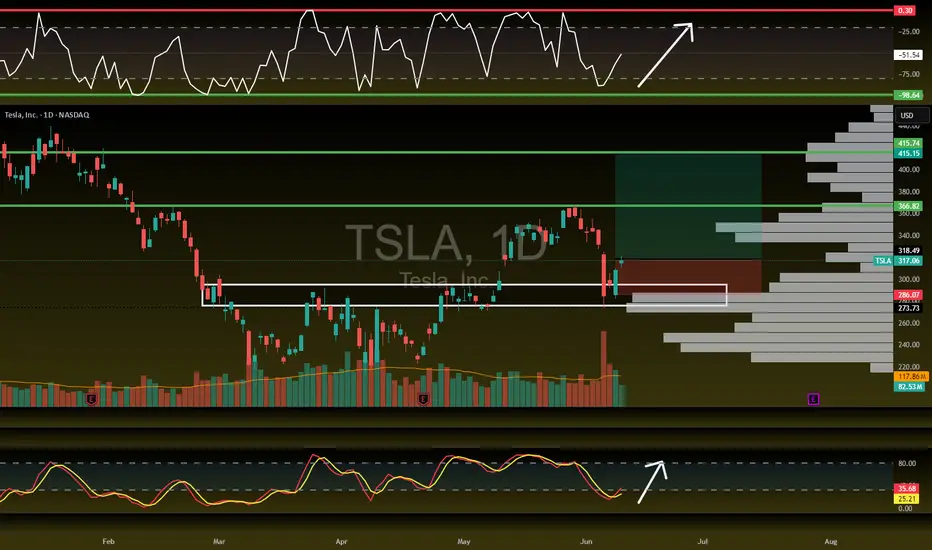
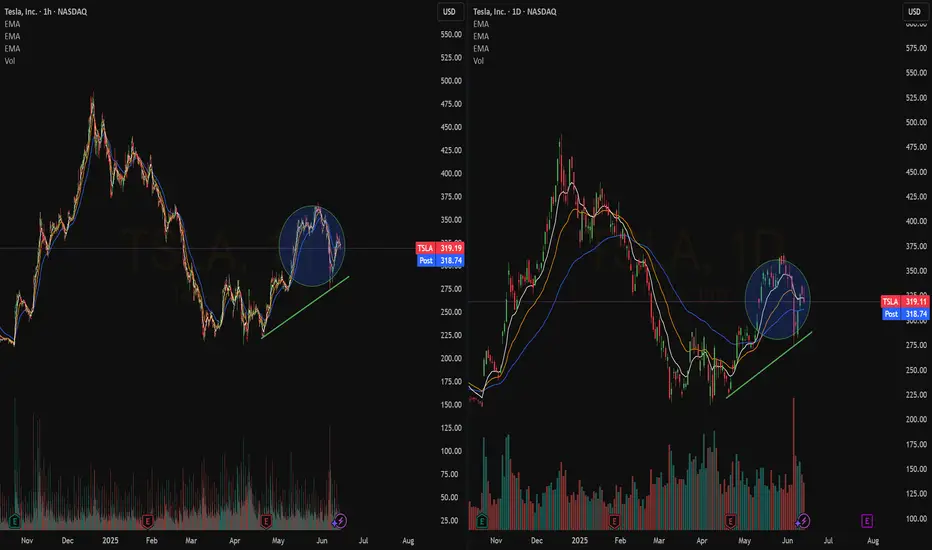
Quick View: $TSLADaily -> Bullish crossover with pullback (and volume)
Hourly-> Consolidated bullish trend
Watching for a #TopSwing Setup on the Daily Chart
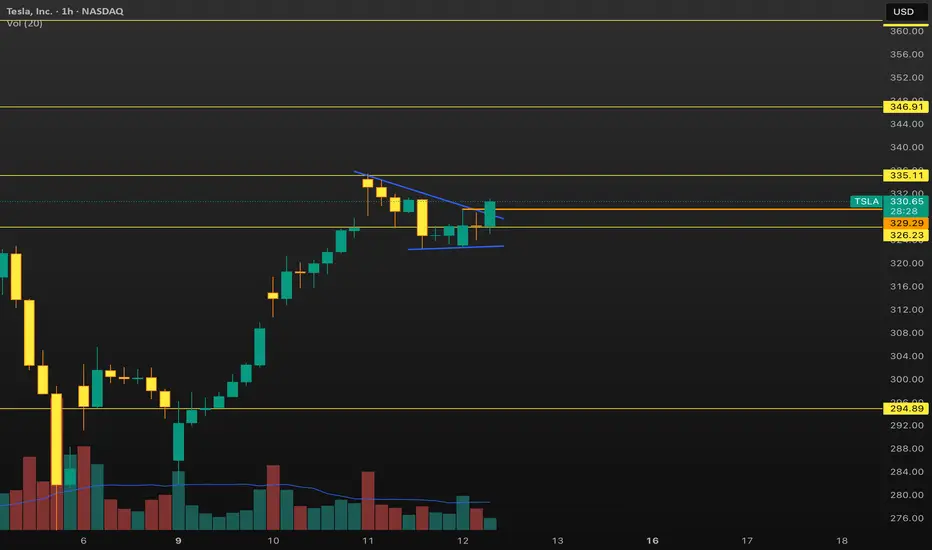
TSLA This is good. 329 over and 335 is next resistance. Really good trade if for tomorrow for next week. Given the stock can hold here
[GEX] TSLA Breakdown & Options Trade Idea for 39DTELast week, TSLA dropped hard, likely due to political tensions. Let’s not forget — just a month ago, their EVs were showcased at the White House entrance...
In the span of 30 hours, TSLA fell -22% (see red line below), while SPX barely reacted. Why? Because both realized and implied volatility dropped — remember VIX is around 17/18.
This sharp TSLA drop already seemed overdone, which helped fuel the +5% bounce on Friday.Most TSLA options positions are near-term and still show negative sentiment — but further expirations grow increasingly bullish.
🔍 If you use options GEX matrix , you’ll see the bearish hedging flow gradually turns more neutral-to-bullish.
Most cumulative support/resistance zones lie between 250–340, with spot currently just under the chop zone.
🧠 TSLA Trade Idea
It’s been a while since I posted a neutral Iron Condor, but TSLA might be an exception.
Despite last week’s IV spike, call pricing skew still dominates across expirations — as seen in our Options Overlay indicator.This tells me the market doesn’t fear TSLA crashing below 200. So, I’m aiming to capture premium on the July 18th expiry without day trading.
I’m thinking of something simple, well-manageable in either direction.To refine leg placement, I use visual GEX zones.
🐻🔴 Downside:
Strong put support at 250
Gradual support layers up to 280
🐂 🟢 Upside:
Target area: 340–350 for the July 18 expiry.
📅 Closing the Trade:I'll consider closing or adjusting at 21 DTE or when 50% max profit is hit — per TastyTrade’s studies.
🔁 Rolling Plan:IF short delta on one side drops below ~14 and price pulls away, I’ll roll the untested side to collect more credit.
🧑🏫 I’ll likely post trade management live in Discord for educational purposes.
~~~~~~~~~~~~~~~~~~~~~~~~~~~~~~~~~~~
🦋 Bonus Idea: TSLA Broken Wing Butterfly
If you think TSLA has more downside, a Put Broken Wing Butterfly — like the one shown in my previous YT video — is also a great way to structure this trade using the same GEX levels.
There’s no single way to use Gamma Exposure — it’s the most actionable hedging signal we have. Combine it with your knowledge of strategies and you can trade almost any scenario.
One thing’s for sure — this market moves faster than ever.A single day of internal conflict wiped -22% off TSLA…The next morning, the market already moved on, so as always:
Trade Safe Out There!

Yesterday was a great time to buy the dip!I see a lot of money coming in at higher time frames. I will hold for a while, and I also see lots of turbulence. Let’s see what happens after the CPI on June 12 😎
Bearish Elliot Triangle Wave $250 targetObserving Tesla Chart, I noticed a bearish 4hr Elliot Wave A-E. The flow is also bearish and lines up with the bear sentiment. Looking for a bearish Apex Breakout..
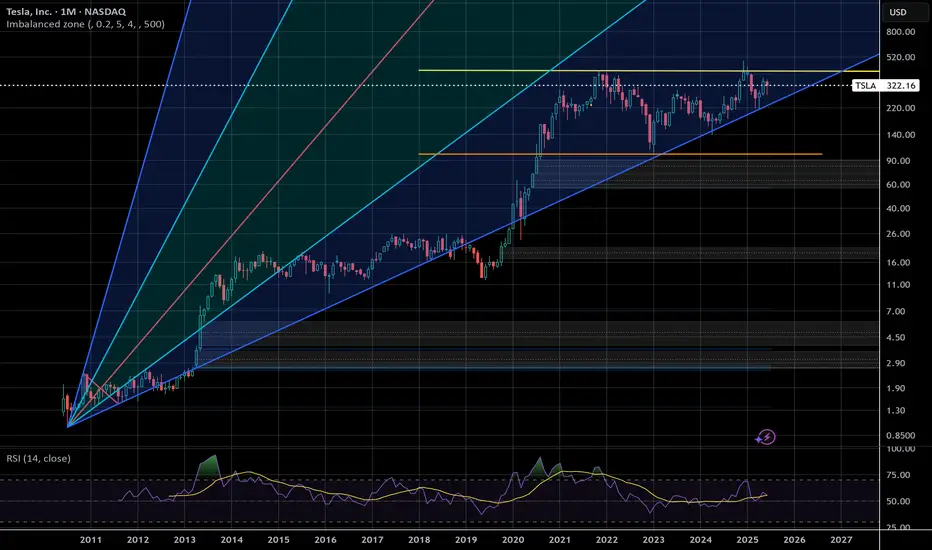
The Importance of Price HistoryAs you can see, even the first year of a stocks price history can influence trends forever
TSLA is now at a key level on a historical trend, riding a longtime trendline while being sandwiched in a strong support/resistance area since 2021. Watching for big moves that signal the S & P 500's direction in the coming month, the next price move will be volatile
If TSLA falls below $100 it's in big danger of falling down that grey imbalance zone on the monthly. The volatility of this stock is it's greatest asset and weakness. Personally, I wouldn't want to be trading this stock without a tight stop loss
TSLA Bullish to $350I’m still bullish on TSLA. As long as it stays above the orange trend line I expect us to grind higher. RSI is not in overbought territory. $350 is the target.
Wednesday Session Debrief (100% Win Rate This Week Thus Far).Early move 1 put @ 935am entry was stacked against a large Bullish FVG so I didn't take it. Call structure came in, but ended up being false positive. As a result i opened a short hedge (01), got chopped up and opened another long and 3 more shorts during 1 hour of choppy price movements as bulls and bears fought over direction to establish control. The final short i opened was when price pushed below $330, exited in very decent profit today considering the unpredictable price action.
LONG entry @ $316.05 | 09:55am + LONG exit @ $321.05 | 11:20amToday goes to show what happens when you follow structure, and let mat and probability take care of the outcome. An exceptional day, remember... consistent green days are a reflection of discipline, not luck.
Some more pertinent details re price action today. I hit an algo entry at 9:55, MM's did a hard shake out of the weak hands, dropped the price significantly but there was no strong bearish FVG even though price dropped 3 points which gave me conviction to hold the position which paid off very well. There was no significant short move and the price rallied to a weekly high.
Polyanonymous.
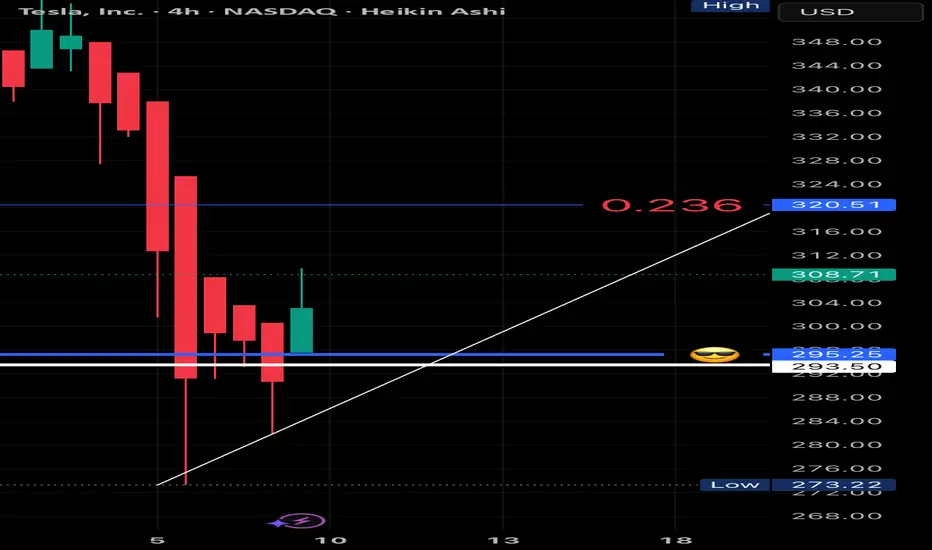
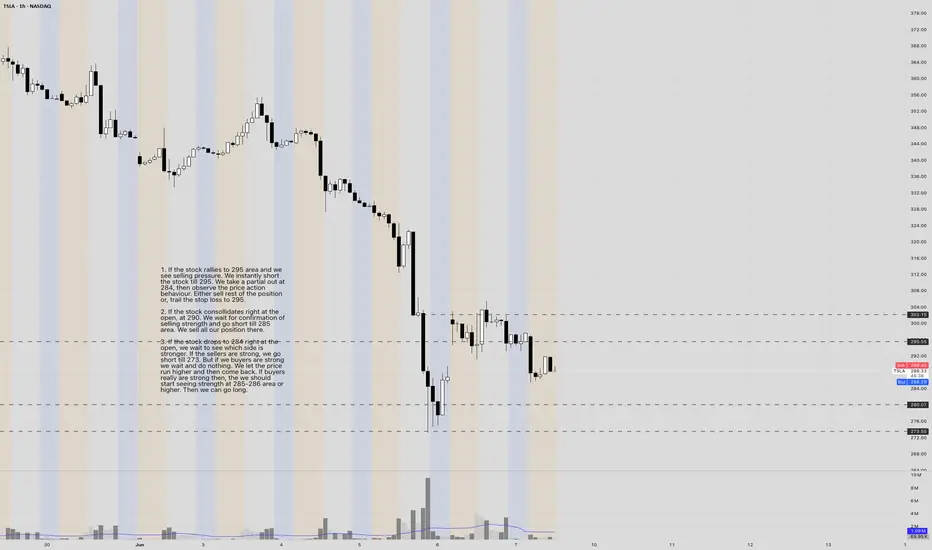
TSLA. SHORT @ 304. SHORT @ 295. LONG @ 284. LONG @ 273. INTRADAYOverview -
The economic calendar is light this week. The stocks previously have shown a trend of being affected a lot more by the news, compared to the economic data. Today, US-China are having talks regarding the trade. The volatility should come from the outcome of the trade discussion. We will not stay in the market for that long. We will only trade the predictable open and call it day.
INTRADAY PLAN -
1. If the stock rallies to 295 area and we see selling pressure. We instantly short the stock till 284. We take a partial out at 284, then observe the price action behavior. We can either sell rest of the position or, trail the stop loss to 273.
2. If the stock consolidates at the open, at 290. We wait for confirmation of selling strength and go short till 285 area. We sell all our position there.
3. If the stock drops to 284 right at the open, we wait to see which side is stronger. If the sellers are strong, we go short till 273. But if we buyers are strong we wait and do nothing. We let the price run higher and then come back. If buyers really are strong, then we should start seeing strength at 285-286 area or higher. Then we can go long.
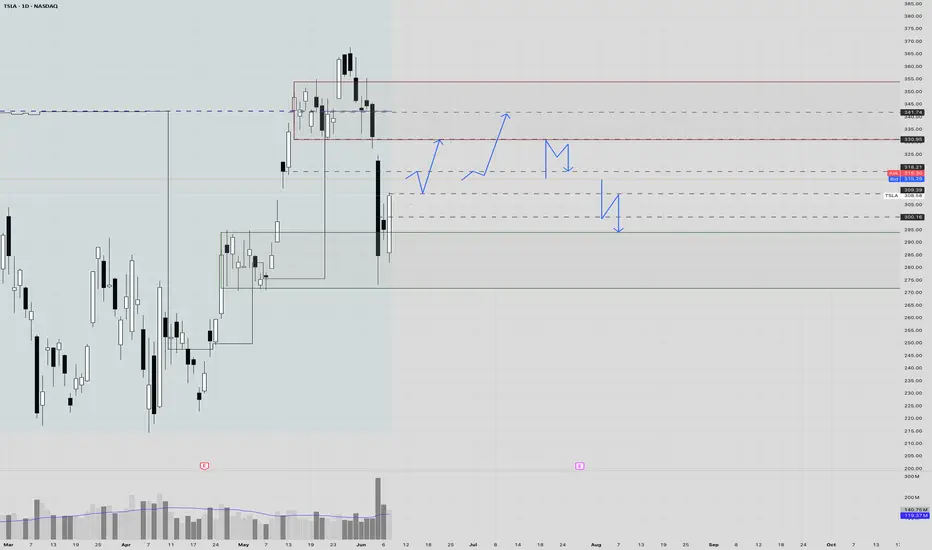
TSLA. LONG @ 309. SHORT @ 330. PIVOT @ 318. INTRADAY 1. If stock doesn't break the 312 level in the pre-market and ends up rallying to 318, where we see a little selling strength. We wait. We let the price come down and wait for the buyers to make the following moves.
If the buyers step in at 316+, we go long till 341.
If the buyers step in at 309+, we go long till 330.
2. If the stock blows past 318 and directly rallies to the 330 area, we wait for the sellers to show themselves. If the sellers starting showing desperation in the 330 area, we go short, till 318.
3. If the stock opens, 309 support fails and the stock directly drops to the 300 zone. We wait for a good entry at 309 zone and go short from there till 295.