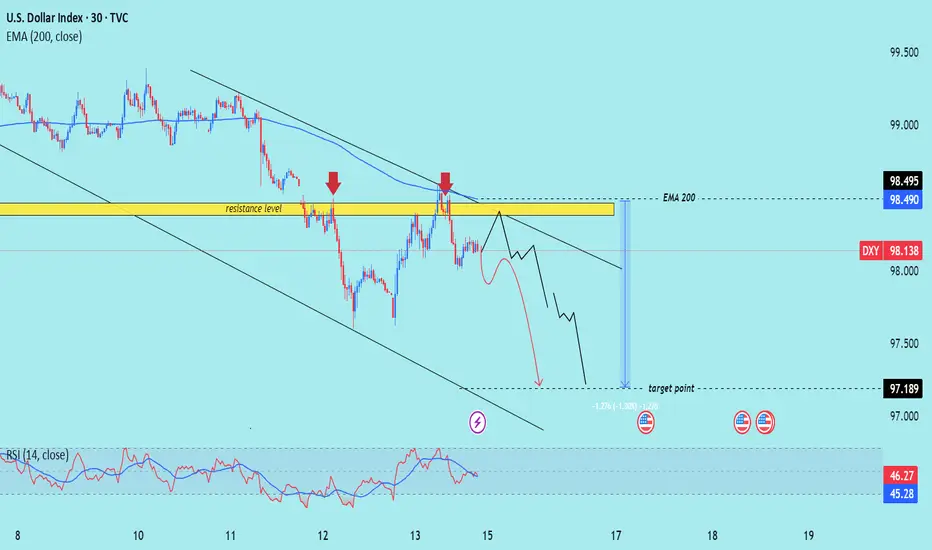
Index/US) Bearish trend analysis Read The caption)SMC trading point update
Technical analysis of U.S. Dollar Index (DXY) on the 30-minute timeframe, with the price respecting a clear downtrend and repeatedly rejecting a resistance zone near the 200 EMA.
---
Analysis Breakdown
Key Technical Elements:
1. Downtrend Structure:
The price rema
16.06.25 Morning ForecastPairs on Watch -
FX:NZDUSD
FX:CADJPY
OANDA:XAUUSD
FX:EURCAD
A short overview of the instruments I am looking at for today, multi-timeframe analysis down to what I will be looking at for an entry. Enjoy!

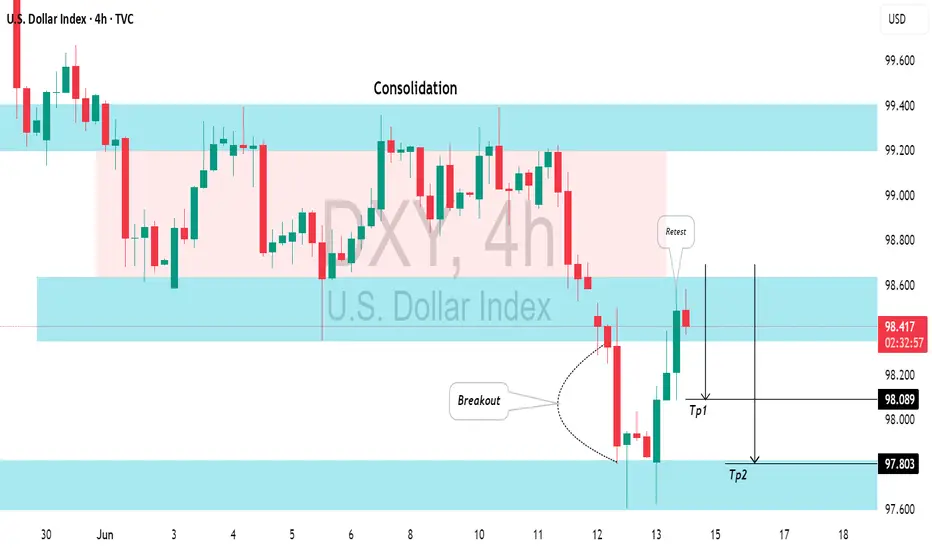
US DOLLAR INDEX(DXY): Classic Bearish SetupI believe that 📉DOLLAR INDEX has a potential to continue falling.
The market has been consolidating in a wide intraday horizontal range, and the breakout below the range support is a significant bearish indicator.
Target levels are 98.08 then 97.80 support.
Dollar Monthly CLS I Model 1 I Reversal I DOBHey, Market Warriors, here is another outlook on this instrument
If you’ve been following me, you already know every setup you see is built around a CLS Footprint, a Key Level, Liquidity and a specific execution model.
If you haven't followed me yet, start now.
My trading system is completely
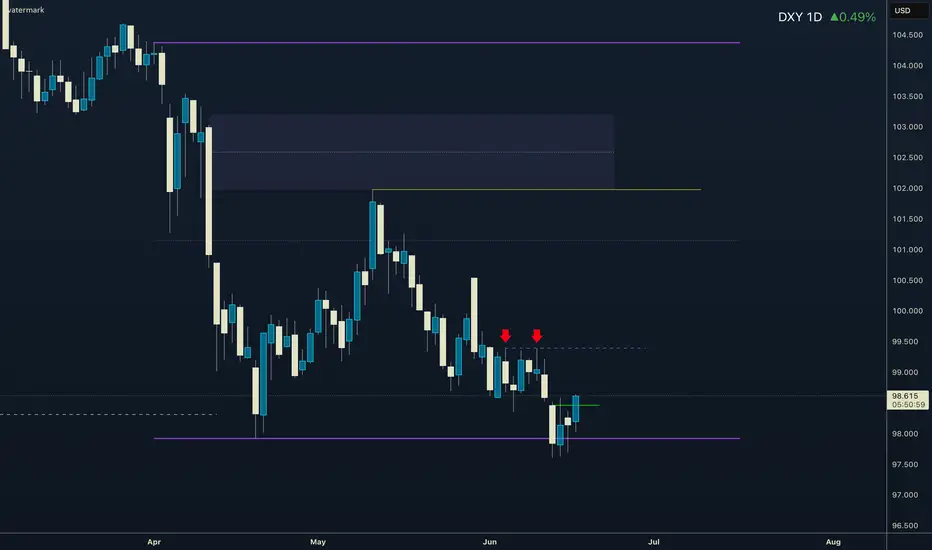
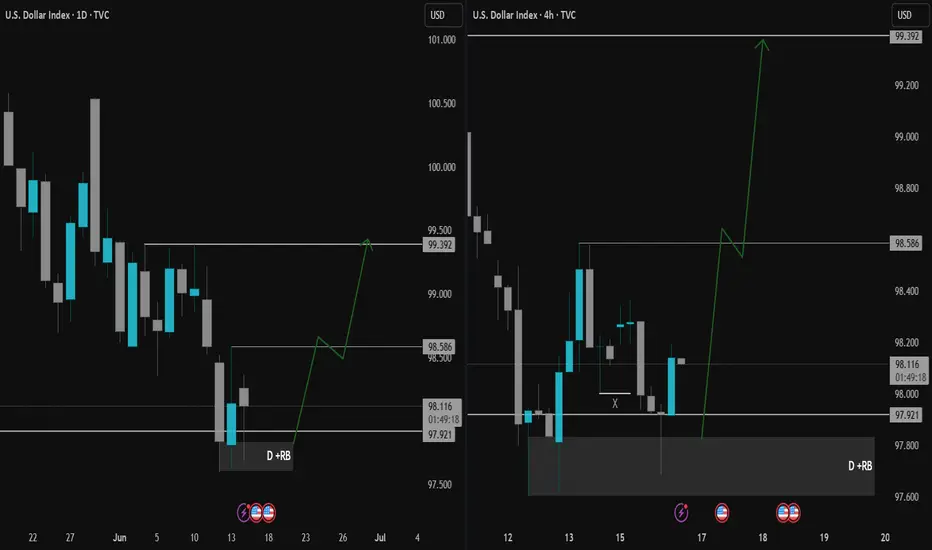
DXY Market Outlook: Eyes on 99.392Hello Traders,
DXY found buyers at the 97.921 level we tracked last week and managed to close daily candles above this level. We can now refer to this area as a rejection block (D + RB). This week, the block was retested and encountered rejection from buyers.
With this buyer reaction, our target i
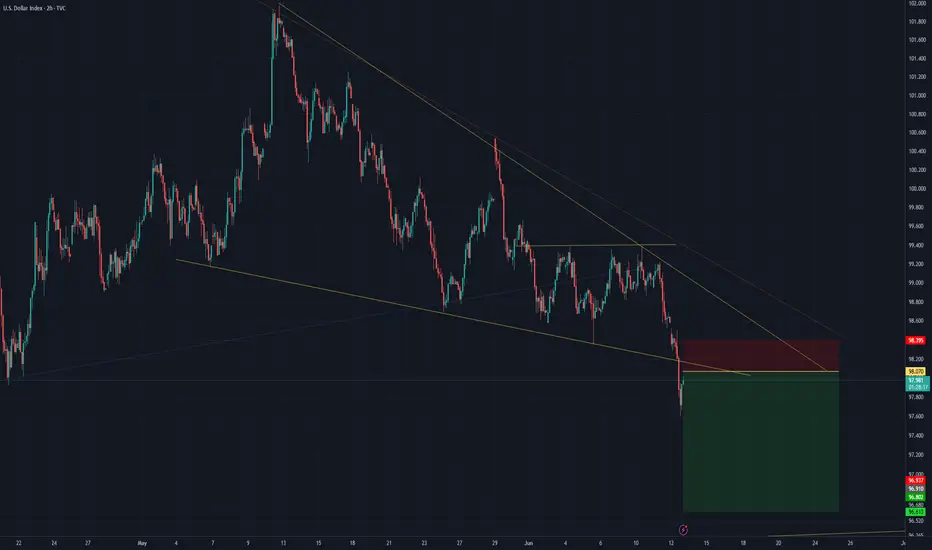
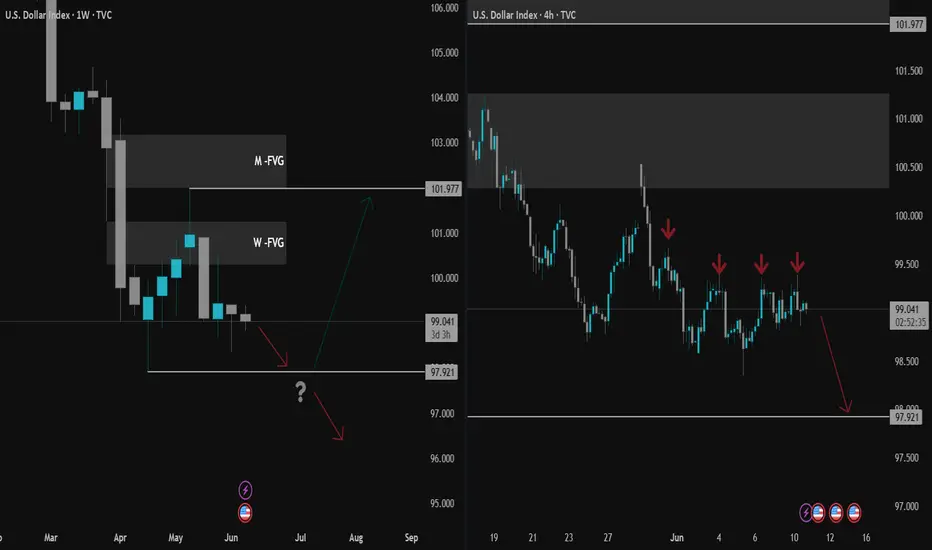
Stuck in the Zone: DXY Tests Balance Between 98 and 99Hello Traders,
After a sharp and uninterrupted decline in the DXY, price found support at the 97.921 level. Sellers then regained control from the weekly bearish Fair Value Gap (W-FVG), pushing price back into the 99 zone.
In this zone, neither sellers nor buyers have managed to assert dominance—s
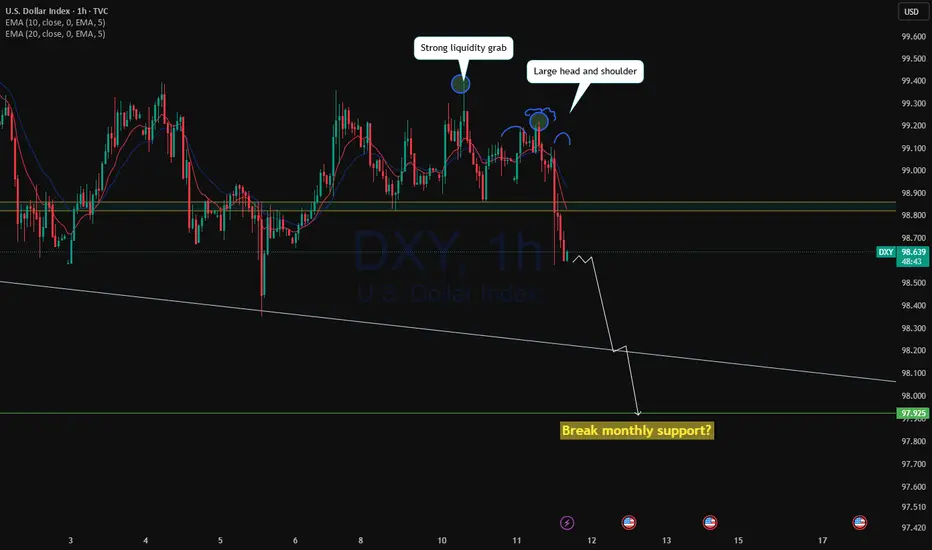
DXY ready for free fall?DXY at 99.39 strong liquidity grab then rejected back to the support level then following a head and shoulder, price completely has broker out of the support with CPI, it has finally managed break out of consolidation.
As the impulse has volume, we may see further drop to the monthly support 97.93
Reversal pattern on DXYPrice entered into the 12 months Fair value gap the second time and took out the old low there. This is called stop hunt, which is particularly significant because it happened inside a Higher timeframe Fair value gap. After this stop hunt came an invalidation of a Fair value gap (BISI). This price s

EURUSD at Key Resistance: Will It Drop to 98.350?The dollar is approaching a familiar zone that previously acted as a strong barrier, triggering bearish momentum in the past. Given its historical significance, how price reacts here could set the tone for the next move.
If bearish signals emerge, such as rejection candles, long upper wicks, or bea

See all ideas
Displays a symbol's price movements over previous years to identify recurring trends.
Frequently Asked Questions
US Dollar index reached its highest quote on Sep 28, 2022 — 114.670 USD. See more data on the US Dollar index chart.
The lowest ever quote of US Dollar index is 89.130 USD. It was reached on Jan 6, 2021. See more data on the US Dollar index chart.
US Dollar index is just a number that lets you track performance of the instruments comprising the index, so you can't invest in it directly. But you can buy US Dollar index futures or funds or invest in its components.