USTEC.F trade ideas
we all have eyes right?buy every base. lets take this to olympus, moon, maybe the sun. this is bullish.

nasdaq. a good time to sellIn my view, it’s time to sell the Nasdaq. We’ve reached new highs, and last month was the best May in over 30 years — statistically, this alone calls for caution.
Even though the economy appears strong on the surface, and market fears around DAS and Trump have faded, investors are ignoring the real issue: U.S. public debt. This is the elephant in the room.
With recent labor data pointing toward potential weakness, the risk of a major recession is increasing. If employment starts to deteriorate, the U.S. won’t be able to refinance its ever-growing debt. Trillions in interest payments are coming due soon — around $3 trillion, which is equivalent to the entire Italian public debt. The U.S. needs to roll over roughly a third of its debt, and fast.
Given all this, I don’t see any solid reason to be buying Nasdaq at current levels. It’s rallied extremely fast, and I see a retracement toward 20,000 as a realistic scenario — potentially even lower if upcoming economic data disappoints.
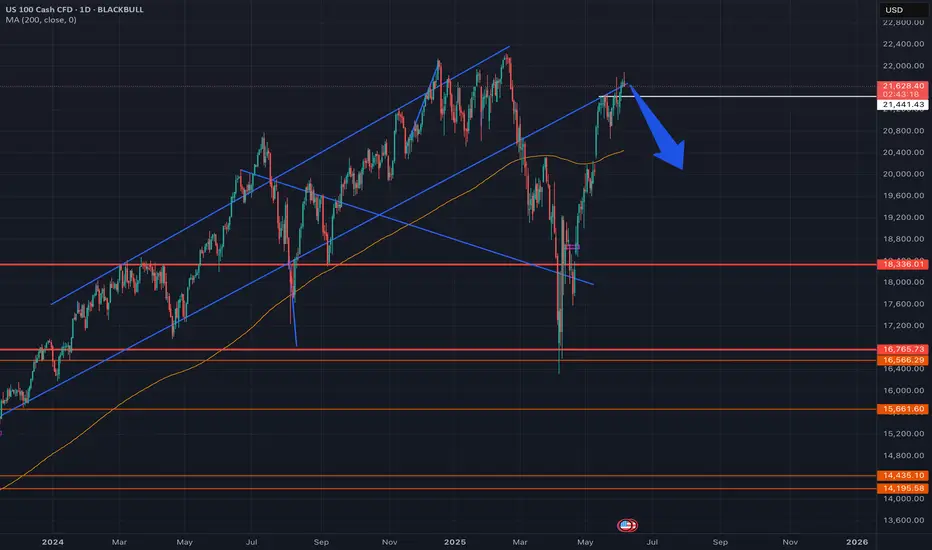
US100 Weekly: Bullish Pullback or Breakdown at 21,000?
US100 – Weekly Technical Outlook
Week ending: 06 June 2025
⸻
📊 Big Picture Summary:
The NASDAQ 100 is still in a larger uptrend, but it’s facing resistance at the 22,000 level. Rejection there has triggered a short-term pullback. As long as price holds above 21,000, the bullish structure remains valid. Below that, we risk a deeper correction.
⸻
🕰 Multi-Timeframe Snapshot:
• Weekly: 21,488 | Small up-bar | Higher Low > prior | Re-testing February supply
• Daily: 21,472 | Long upper wick | Higher High | Rejected 22k supply
• 12H: 21,474 | Outside-bar pullback | Expanding | Closed into 0.382 Fib
• 4H: 21,474 | Large bear bar | Higher Low | Lands on 100 SMA
• 90M: 21,474 | Momentum flush | Lower Low | Tags 0.618 Fib + trendline
⸻
📈 Trend & Structure Analysis:
• Weekly: Strong uptrend with rising SMA stack; price above Ichimoku cloud. As long as 21,000 holds, pullbacks are buyable. Key support: 20,350–19,140.
• Daily: Uptrend intact but overextended. Rising wedge structure broke at 22k, risk of pullback to 21,070 or 20,750.
• 12H: Bullish while above 21,160, but channel loss warns of potential dip to 21,000.
• 4H: Rising wedge break confirmed; testing 100 SMA. Needs to reclaim 21,700 to resume strength.
• 90M: Bearish flush with momentum reset. Needs quick reclaim of 21,630, else risk of continuation to 21,300.
⸻
📊 Momentum & Flow:
• Weekly RSI: 58 | MACD + | CMF +0.08
• Daily RSI: 62 | MACD – | Bearish divergence developing
• 12H RSI: 55 | MACD –
• 4H RSI: 44 | MACD – | Hidden bullish possible
• 90M RSI: 35 | MACD –
Interpretation: Higher timeframes show strength but momentum is cooling off. Lower timeframes show bearish pressure, but it looks corrective, not a trend reversal—unless 21,000 fails.
⸻
📉 Volatility Overview:
• Weekly: Mild expansion, %B at 0.66
• Daily: Expansion pausing, %B from 0.93 → 0.75
• 12H: Post-squeeze contraction
• 4H: Mean reversion phase
• 90M: Lower-band flush, ready for new drive
⸻
📍 Key Levels to Watch:
• 22,200–22,900: Weekly + Daily supply zone (strong resistance)
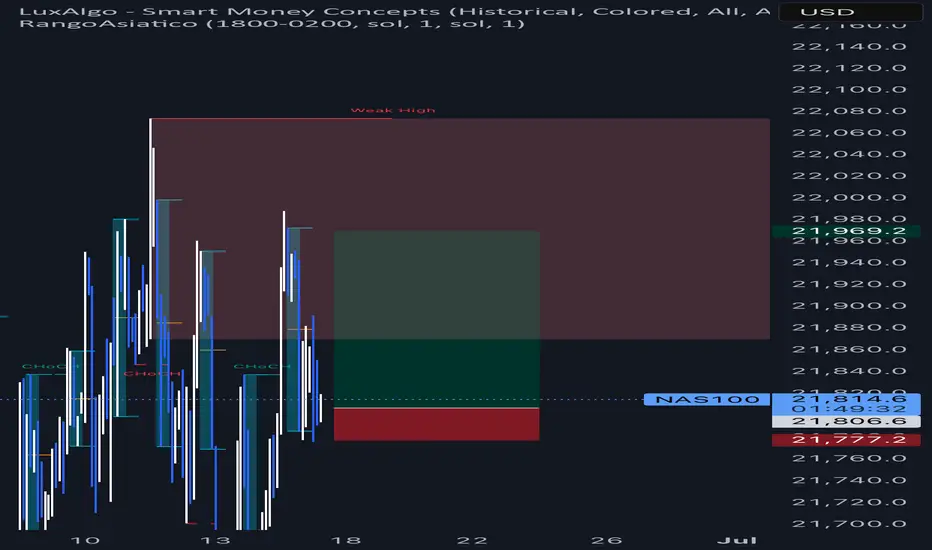
• 21,804–21,718: Intraday bear OB (90M)
• 21,661–21,627: Bull OB on 90M – key battle line
• 21,468–21,396: 4H order block + Fib cluster
• 21,130–21,000: Major 12H support + rising trendline
• 20,750–20,420: Strong Daily demand zone
• 18,306–17,800: Weekly macro support
⸻
🔥 Confluence Hotspots:
• 22,200 – Multi-timeframe supply, channel top = strong sell zone
• 21,660 – 90M bull OB + Fib 0.382 = minor support
• 21,468 – 4H Fib + wedge retest = neutral
• 21,130 – 12H OB + trendline + 100 SMA = major support
• 20,750 – Daily demand + 200 SMA = deeper buy zone
⸻
🧠 If / Then Logic:
• If 90M closes above 21,660 + 4H prints HL → Bull continuation
• If price ranges 21,660–21,350 for 24h → Expect pause
• If 90M closes below 21,350 → Bearish extension likely
⸻
🎯 TradingView Alert Grid:
• US100 crosses 22,200 → “Weekly supply breached – reassess bias.”
• US100 crosses 21,804 → “Intraday bear OB reclaimed – review short bias.”
• US100 crosses 21,660 → “Primary bull trigger activated – watch for long setups.”
• US100 crosses 21,000 → “Critical support broken – full re-analysis needed.”
• US100 crosses 20,750 → “Testing demand – reassess buy zone.”
⸻
🎲 Scenario Odds:
• Breakout above 22,200 → 25%
• Range between 21,800 ↔ 21,000 → 50%
• Dip below 21,000 then reclaim → 25%
⸻
✅ Final Summary:
The trend is still bullish at the macro level, but we’re in a corrective pullback. As long as 21,000 holds, this remains a healthy reset.
Watch 21,130 for long setups, and 21,660 as the first reactivation trigger for upside.
If 21,000 fails, brace for deeper demand tests at 20,750 and possibly 18,800.
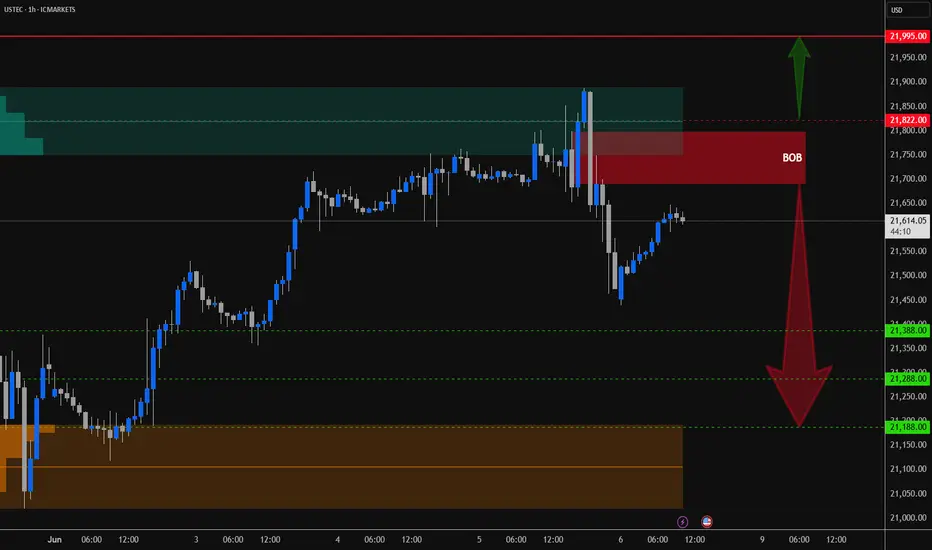
NASDAQ 100 - Potential TargetsDear Friends in Trading,
How I see it: (Upside seems limited)
** NFP DATA RELEASE TODAY - Be safe!
Key Resistance @ 21700 - 21800
Potential Targets - "SHORT"
1] 21388.00
2] 21288.00
3] 21188.00
I sincerely hope my point of view offers you a valued insight.
Thank you for taking the time to study my analysis.
NAS100 Technical Analysis – Bearish Rejection at ResistanceNAS100 Technical Analysis – Bearish Rejection at Resistance 🚨
📅 Date: June 6, 2025
📈 Instrument: NAS100 (US Tech 100 Index)
🔍 Chart Overview:
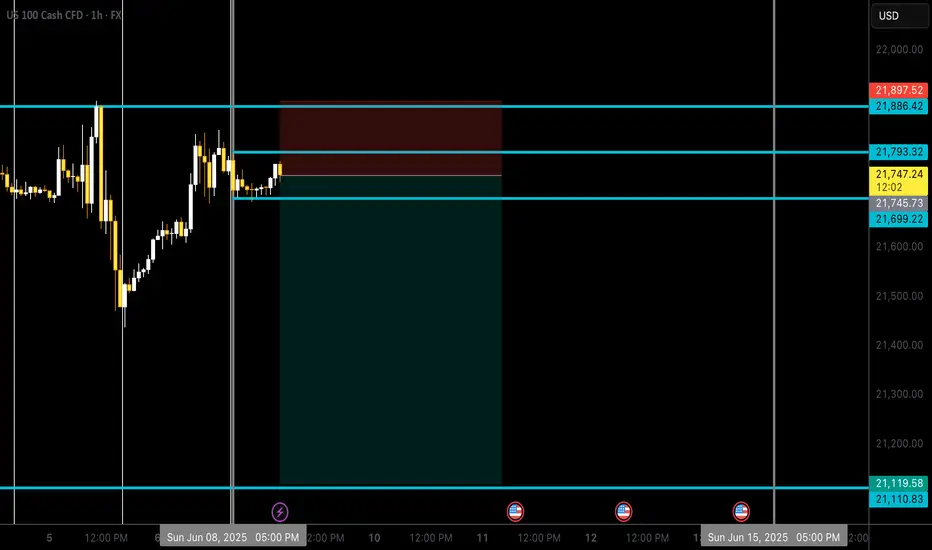
The price action shows a clear rejection from the 21,800 USD resistance zone, marked by two strong bearish wicks (indicated by red arrows 🔴). This level has proven to be a strong supply zone, as sellers repeatedly step in to push prices lower.
🔵 Key Zones:
🔺 Resistance Zone: 21,750 – 21,800 USD
✅ Multiple rejections and bearish pressure.
🔻 Support Zone 1: 21,100 – 21,200 USD
📍 Acts as a mid-range demand zone and a potential take-profit level for short positions.
📉 Support Zone 2 (Major): 20,700 – 20,850 USD
📦 High-probability bounce area due to historical demand.
🔄 Price Action Insight:
The chart outlines a bearish double rejection pattern at the resistance level.
The current candlestick setup suggests bearish momentum, with a potential drop toward the mid-support zone.
If the price breaks below the mid-support, it could cascade down toward the major support near 20,800 USD.
📌 Projected Move:
🔻 From current levels (~21,750), expect:
Pullback from resistance,
Target 1️⃣: 21,100 USD zone,
Target 2️⃣: 20,800 USD major support.
🚫 A clean break and close above 21,800 invalidates the bearish outlook and may trigger a bullish continuation.
✅ Conclusion:
The chart favors a short bias below the resistance zone. Patience is key—wait for confirmation (like a bearish engulfing or break of structure 📉) before entering positions.
📊 Always use risk management. Set stop-loss above resistance in case of reversal.

USTECH (Nasdaq) Daily Trade SetupIn this update we review the recent price action in the Nasdaq and identify the next high-probability trading opportunity and price objectives to target. To review today's video analysis, click here!

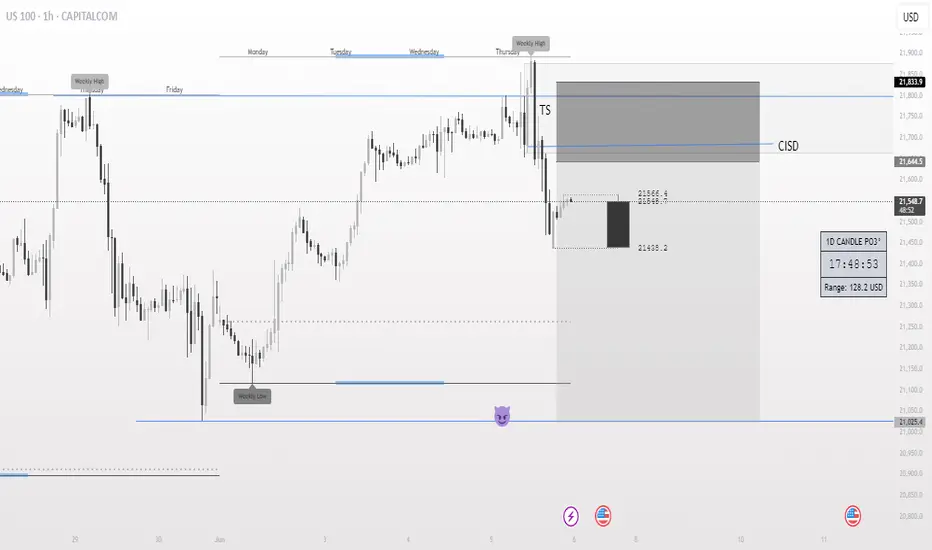
CRT analysis on US100there is a daily rejection from last week previous high, causing a turtle soup
using the h1 change in structure delivery I have marked a a valid CISD and we look to sell from that zone
Down, Down Down, Down Down Down This idea tags onto my my other live idea on the Nasdaq (see my linked posts)
As we are still near the TOP as bullish euphoria is still present, I think now would be a good time to put my main POI's for the next 2 months out there:
21000
19300
11800
What are your POIs?

Clairfication of NDQ Elliott Wave PatternA request was made for clairification of my recent NDQ Elliott wave count.
This is a detailed count of NDQ - Minuette wave (iii).

Stocks on the rise...The NASDAQ is on its way to print a new ATH. Shoutout to the lads still waiting on a 2008-style meltdown.
Hanzo / Nas100 15 Min Path ( Tactical Bearish Break Out Zone )🔥 Nas100 – 15 Min Scalping Analysis (Bearish Setup)
Bias: Waiting For Break Out
Time Frame: 15 Min
Entry Type: Confirmed Entry After Break Out
👌Bearish After Break : 21720
Price must break liquidity with high volume to confirm the move.
☄️ Hanzo Protocol: Dual-Direction Entry Intel
➕ Zone Activated: Strategic Reaction from Refined Liquidity Layer
Marked volatility from a high-precision supply/demand zone. System detects potential for both long and short operations.
🩸 Momentum Signature Detected:
Displacement candle confirms directional intent — AI pattern scan active.
— If upward: Bullish momentum burst.
— If downward: Aggressive bearish rejection.

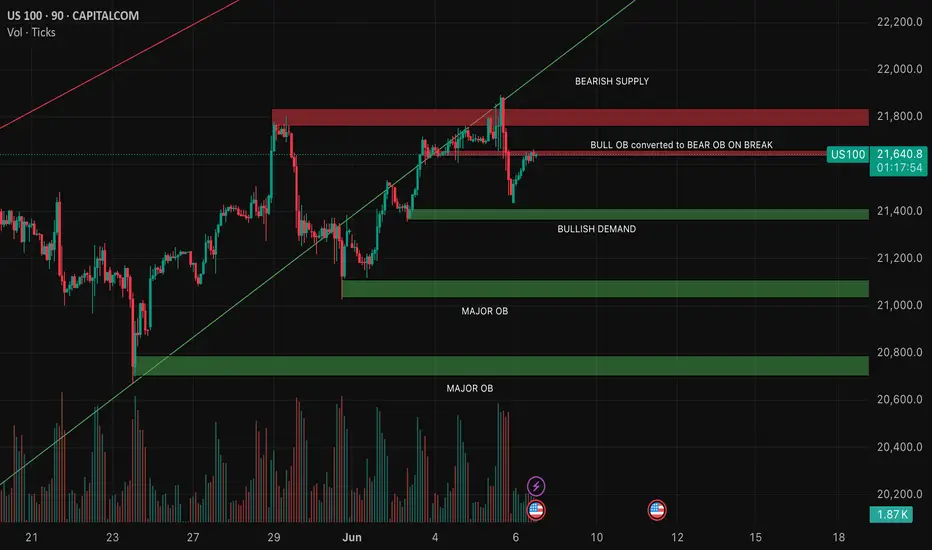
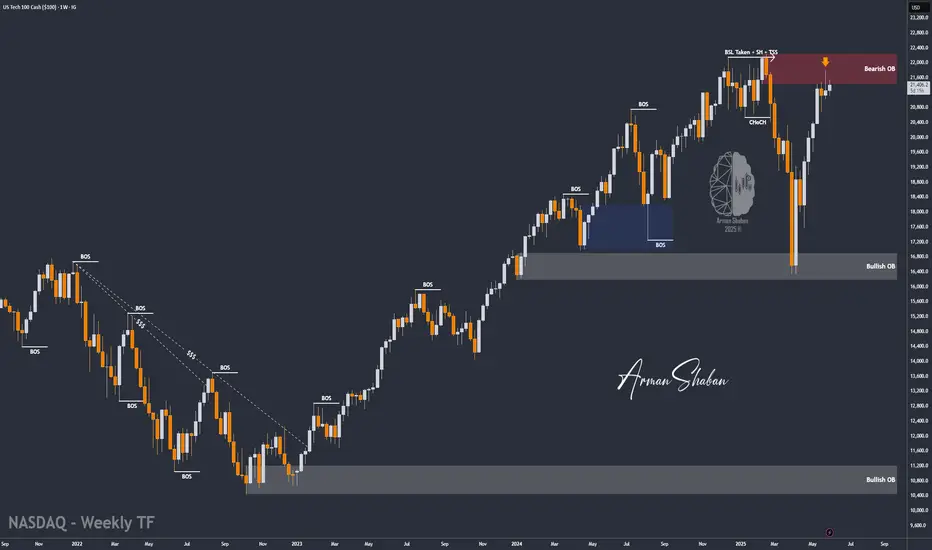
NASDAQ at Weekly Supply Zone – Bearish Breakdown Ahead? (READ)By examining the #Nasdaq chart on the weekly timeframe, we can see that the price is currently trading within the supply zone around 21,400. If it manages to close and stabilize below 21,100, we can expect further downside for this index. The potential bearish targets are 21,000, 20,700, 20,200, and 19,150. The key supply zone ranges from 21,400 to 22,200.
Please support me with your likes and comments to motivate me to share more analysis with you and share your opinion about the possible trend of this chart with me !
Best Regards , Arman Shaban
Bearish Three DivesBearish pattern hit on the 15 minute. Expecting a drop to 21k. Still bullish on the larger timeframes

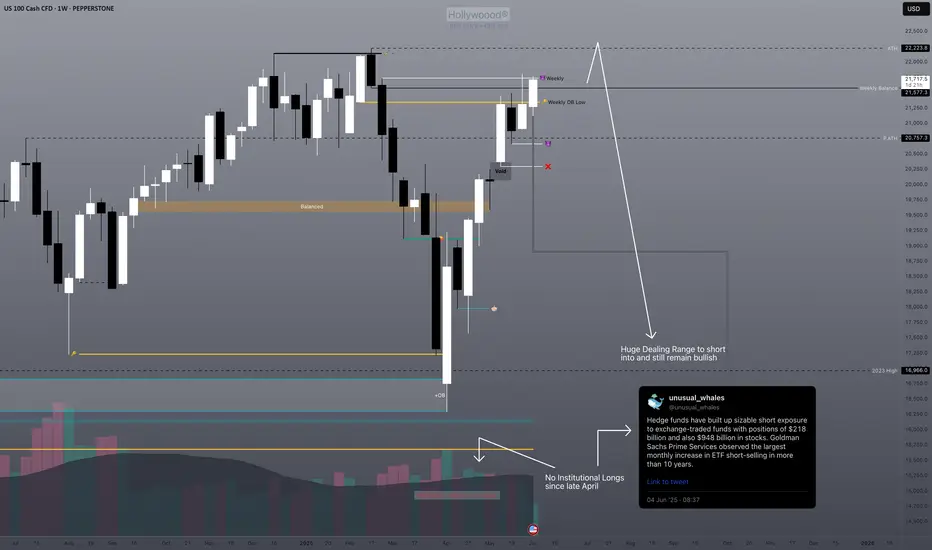
Hedge funds are unusually bearish and here's why...We have a huge dealing range to short into and still remain bullish, it's basically free money on technical retracement/correction while not ruining the market.
The retailers have been buying since April but there is no institutional orderflow evidenced by no peak above average volume levels.
Technicals will reign supreme here. Trump is either trolling about the rate decrease or he has no idea about chart technicals 😮💨. I bet he's trolling, as he has cabinets on cabinets of market advisors who know fully how correction cycles work.
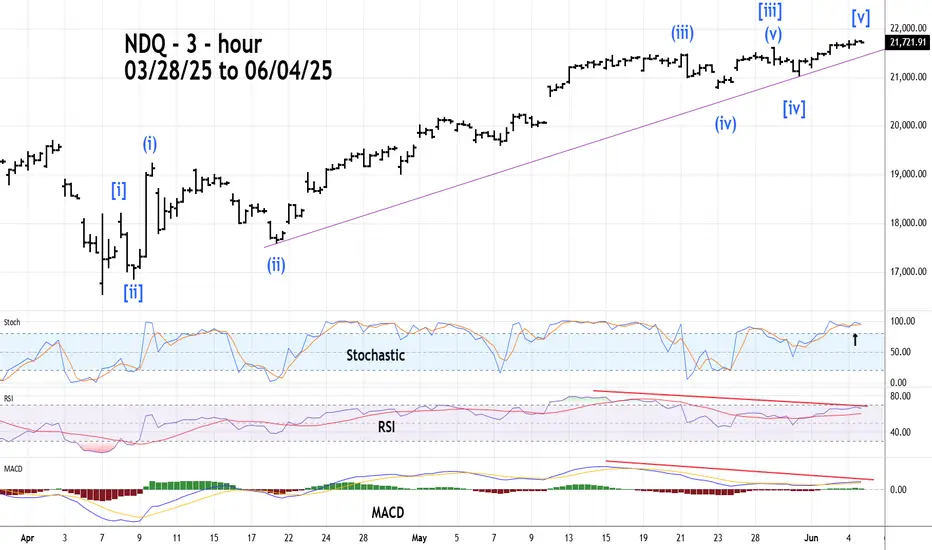
Nasdaq 100 - Bearish Elliott Wave CountThe Nasdaq 100 (NDQ) has a completed extended Elliott five wave Impulse pattern from the 04/07/25 bottom.
Three - hour Stochastic is in the overbought zone and on the verge of a bearish cross.
RSI and MACD have bearish divergences.
A break below the rising trendline could be an important sell signal.
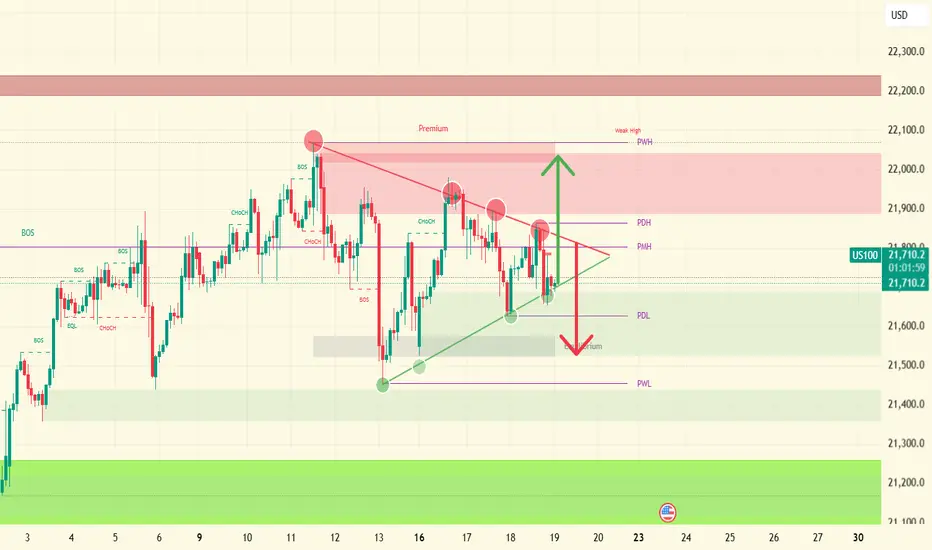
US100 2H in a Symmetrical Triangle—Eyes on BREAKOUT!1. A Symmetrical Triangle in Play
Rising support line (green) connecting the sequence of higher lows.
Falling resistance line (red) connecting the lower highs.
Price is squeezing into the apex of that triangle – classic consolidation/indecision.
What to watch:
A clean break above the red trendline (~21,820–21,850) would be a bullish signal.
A break below the green trendline (~21,650–21,670) would open the door for a move down toward 21,500 or even the 21,400 zone.
2. Value & “Premium” Zones
The green shaded area around 21,500–21,600 is marked “Equilibrium/Value,” where buyers have stepped in repeatedly.
Above ~21,950 there’s a “Premium” supply zone (red) where heavy selling has shown up.
These zones can act as sensible targets or rejection areas once price breaks out of the triangle.
3. Key Reference Levels
PDH / PDL (Previous Day High / Low): ~21,860 / ~21,620
PWH / PWL (Previous Week High / Low): ~21,960 / ~21,430
Traders often use these to confirm break-outs (e.g. holding above PDH now that it’s pierced).
4. Momentum Indicators
MACD: Lines hovering just under zero, histogram weakening → suggests the bulls aren’t quite firing on all cylinders yet.
RSI: Sitting around mid-40s, neutral but with a slight downside bias.
Neither is over-extended; momentum is “sleepy,” which aligns with the triangle/consolidation picture.
5. What This Means for Traders
Neutral bias until one side wins the breakout.
Bull scenario: Triangle → breakout → retest of ~21,820 → rocket toward 22,000–22,200 supply zone.
Bear scenario: Failure at the red trendline → drop through support → test 21,600 then 21,400 demand areas.
NASDAQStable bullish bias—large speculators are neither aggressively piling in nor stepping back.
Lack of a sharp position shift suggests the market is in consolidation or mild uptrend rather than a strong breakout.
Watch for fresh breakout above recent highs or shakeouts below support to confirm a shift in direction.
Bias: Slight bullish.
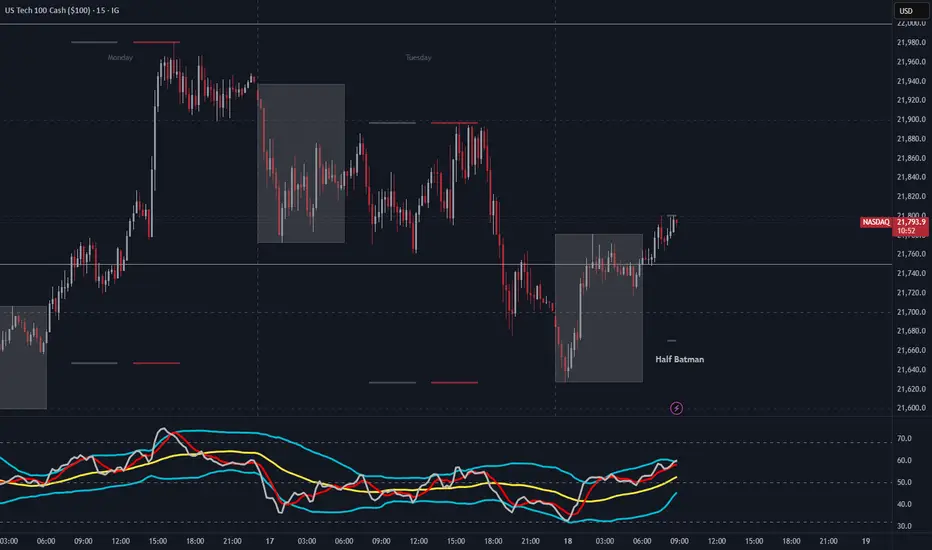
NAS100 (US100) Mid Week Reversal - Bullish Order FlowA Half Batman presents itself during the Asian session and seems to be ready for LDN opening. This Peak Formation could be seen as the reset, to turn NAS100 bullish and ready to break the structure high.

Turn Your Chart – Turn Your ViewCurious about tricking your trading mind?
A lot of traders are constantly searching for new indicators or secret setups. But what if your biggest breakthrough is just a perspective shift away—literally?
This article is about a unique but effective experiment: Rotate your candlestick chart by 90 degrees (horizontal instead of vertical) and see how your perception and analysis change.
Example: ibb.co
No, this isn’t a volume profile – this is the real NAS100 chart, just rotated by 90°!
What do you see now? New patterns? Different price action? Sometimes a fresh angle reveals details you normally overlook and helps break your trading habits.
---
What changes?
1. Patterns suddenly look different
Trends, consolidations, and breakouts appear in a new light:
– Uptrends and downtrends lose their emotional “up feels hard, down feels easy” effect.
– Sideways markets become vertical clusters—your eye spots new structures.
2. Support & resistance become less dominant
Your classic support and resistance zones disappear.
You’re forced to rethink important levels—maybe you’ll notice supply/demand zones you always missed.
3. Emotional neutrality
With a rotated chart, the usually existing “Long is better” bias fades.
You view price action more objectively—and may discover signals you’d otherwise miss.
---
Try it out!
What did you discover by rotating your chart? Comment below or share your thoughts!
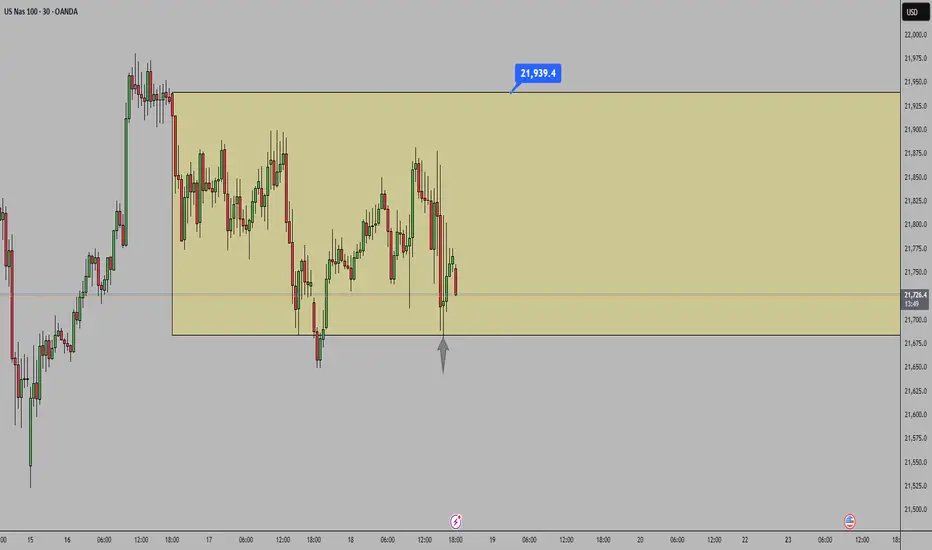
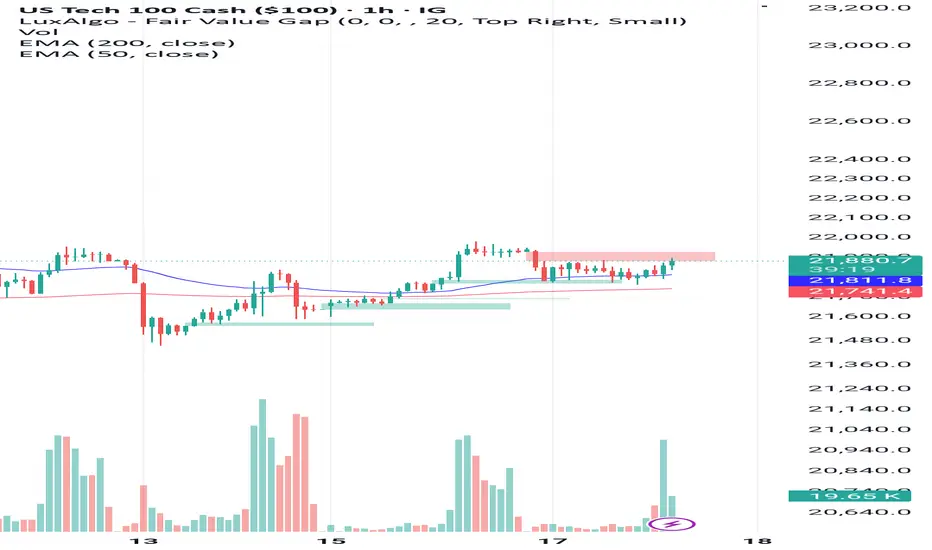
Nasdaq EMA and FVG AnalysisThe EMA 50 on the hourly chart at 21,810 has been an area of support. Breaking down blow this level will send the price searching for EMA 200 at 21,740. Above 21,900 there is an FVG from earlier today and breaking through the upper bound at 21,940 will likely send the price upwards beyond yesterday's swing high.
NAS LONGNS longs to take out all the liquidity above. Last week's highs to be take out and also structural pattern.