Sniper Smart money NASDAQ 🎯 SNIPER SIGNAL – NASDAQ (NAS100)
📅 Date: June 11, 2025
⏱ Timeframe: 1H (H1)
📉 Type: Sell
📍 Entry (SELL): 21,950 – 21,970
⛔ Stop Loss: 22,050
🎯 Take Profit 1: 21,700
🎯 Take Profit 2: 21,450
📊 Risk/Reward ≈ 1:2
🧠 Smart Money Analysis:
✅ Liquidity sweep above 21,950–21,970
✅ Bearish BOS confirmed on 1H
✅ H1 imbalance zone not filled
✅ RSI shows bearish divergence
✅ Order block rejection at 21,900–21,950
💬 Confirmation: await H1 close below ~21,900
🔒 Always use effective risk management
📌 Signal by: **@Talion-Promosale**
(Personal analysis – not financial advice)
#NAS100 #NASDAQ #SniperSignal #SmartMoney #TradingView #TalionPromosale
USTEC.F trade ideas
Sniper NASDAQ 🎯 SNIPER SIGNAL – NASDAQ (NAS100)
📅 Date: June 11, 2025
⏱ Timeframe: 1H (H1)
📉 Type: Sell
📍 Entry (SELL): 19,270 – 19,300
⛔ Stop Loss: 19,370
🎯 Take Profit 1: 19,100
🎯 Take Profit 2: 18,950
📊 Risk/Reward ≈ 1:2
🧠 Smart Money Analysis:
✅ Liquidity grab above the 19,300 key level
✅ Bearish Break of Structure (BOS) confirmed on 1H
✅ H1 imbalance zone not yet mitigated
✅ Bearish RSI divergence
✅ Strong rejection from institutional order block on H1
💬 Confirmation: Wait for 1H candle to close below 19,250 for extra confirmation
🔒 Risk management is essential
📌 Signal posted by: **@Talion-Promosale**
(Personal analysis – not financial advice)
#NAS100 #NASDAQ #SniperSignal #SmartMoney #TradingView #TalionPromosale

Workforce participation is declining, government debt is risingWorkforce participation is declining, government debt is rising. Are we seeing the makings of major military conflicts?
This chart shows two key economic indicators for the U.S. from 2001 to 2025:
- U.S. labor force participation rate: the percentage of the working-age population that is either employed or actively looking for work.
- U.S. government debt as a % of GDP: the ratio of total federal debt to the country’s gross domestic product (GDP), but the scale is flipped - meaning higher debt appears lower on the graph, and vice versa.
What does “government debt as a % of GDP” mean?
This ratio shows how much the government owes relative to the size of the entire economy. If the ratio grows, it means debt is rising faster than the economy. The debt-to-GDP ratio surged sharply after the 2008 crisis and again during the COVID-19 pandemic. By 2024, it reached around 124% and is expected to keep rising. Since the chart uses an inverted scale, the red line drops lower as debt increases.
This graph clearly illustrates an inverse relationship between labor force participation and government debt as a share of GDP:
As workforce participation declines → government debt grows. This pattern is especially visible during major economic shocks like the 2008 crisis and the 2020 pandemic.
Why does this happen?
- Economic downturns: when fewer people are working or job-hunting, economic growth slows, tax revenues fall, and the government tends to borrow more to support the economy and social programs.
- Demographic shifts: as the population ages (e.g, baby boomers retiring), fewer people remain in the labor force. This slows down growth and increases the strain on government programs, which also drives up debt.
- Government policy: during times of crisis, the state often increases spending - and thus borrowing- to support the economy, pushing the debt-to-GDP ratio higher.

US100This is simply a breakdown of structure on a lower timeframe, and it makes sense to me that it could potentially shift to the upside.

US100I noticed this structure on US100 earlier this morning, and it was just too intriguing for me not to participate. I executed the idea with a short-term buy, but I won’t be holding for too long as I see uncertainty with the USA in general.

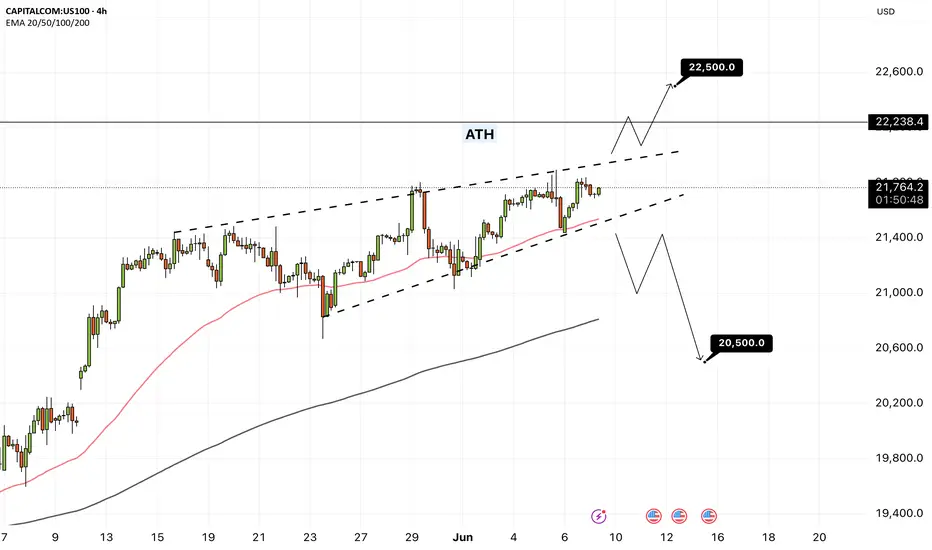
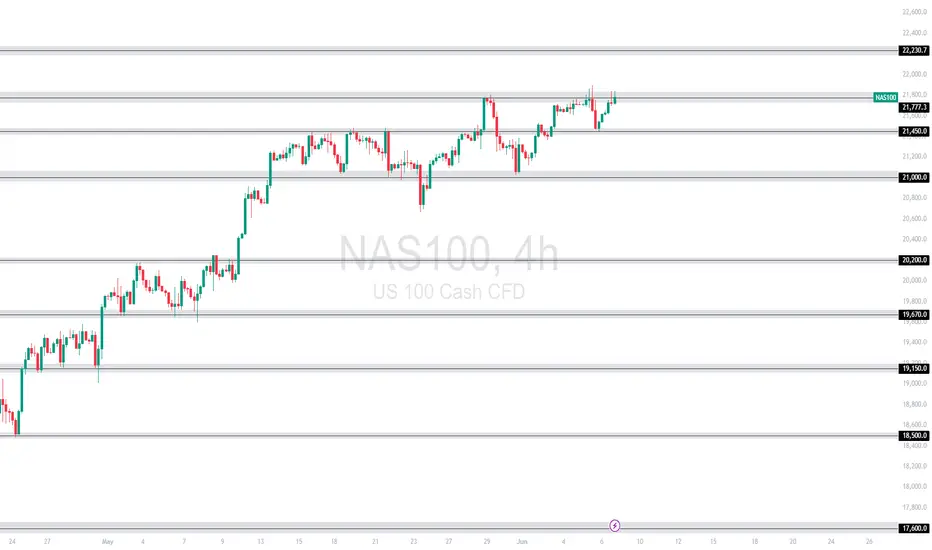
NAS100 - Will the stock market reach its previous ATH!?The index is above the EMA200 and EMA50 on the 4-hour timeframe and is trading in the specified pattern. In case of a valid break of this range, I expect a new trend to form. It is better to wait for confirmation on the break in order to control further risk.
U.S. President Donald Trump announced that an American delegation will meet with Chinese representatives in London on June 9 to discuss a potential trade agreement. In a post on Truth Social, Trump stated, “I’m pleased to announce that Treasury Secretary Scott Bessent, Commerce Secretary Howard Lutnick, and U.S. Trade Representative Jamieson Greer will meet with Chinese officials on Monday, June 9, 2025, in London to discuss a trade deal.” He added that he expects the meeting to go “very well.” U.S. stock markets rose on Friday, and Chinese markets are now following suit. The Hang Seng Index has reached its highest level since March.
Meanwhile, Amazon has completely halted its hiring budget for office workers in its core retail business. This decision applies only to white-collar staff and excludes warehouse employees and those in its cloud computing division. According to Business Insider, which cited internal company emails, the hiring freeze affects Amazon’s online marketplace, logistics operations, and grocery business.
Having doubled its workforce between 2019 and 2021 to 1.6 million, Amazon reduced that number to 1.55 million last year. Since late 2022, the e-commerce giant has laid off at least 27,000 employees.
This move comes as the U.S. jobs report released Friday helped ease some concerns, though signs of broader economic challenges remain. Experts suggest that such a hiring freeze could reflect broader economic trends—where mass layoffs are avoided, but hiring slows down significantly.
In May, the U.S. economy added 139,000 jobs, down from 147,000 in April. The unemployment rate remained steady at 4.2%, staying within the narrow range it has held over the past year. The labor market has remained resilient, dismissing fears that tariffs would cause a significant slowdown. So far, tariff-related disruptions have not been severe enough to destabilize the job market—at least not in May.
Data indicates that employers continue to refrain from layoffs, even as hiring has slowed considerably compared to the post-pandemic surge. Labor market analysts expect signs of weakness to emerge in the coming months, as businesses become more cautious about hiring due to uncertainty surrounding tariffs—according to recent surveys. For now, however, the labor market remains strong.
The absence of red flags in employment may give the Federal Reserve more room to maintain its patient stance on interest rate cuts. This year, Fed officials have kept interest rates higher than average to curb inflation by increasing borrowing costs. The Fed’s dual mandate is to keep inflation low and employment high, and it may opt to cut rates to stimulate the economy if the labor market weakens.Fed Chair Jerome Powell and other FOMC members have said they are waiting to see whether President Trump’s trade wars will stoke inflation, trigger job losses, or both. So far, neither scenario has materialized. Strong labor market data may give them further justification to stay in wait-and-see mode. Rosner wrote, “Given the Fed’s sharp focus on inflation risk management, today’s stronger-than-expected jobs report is unlikely to alter its patient approach. We expect the Fed to remain on hold at this month’s meeting and believe further deterioration
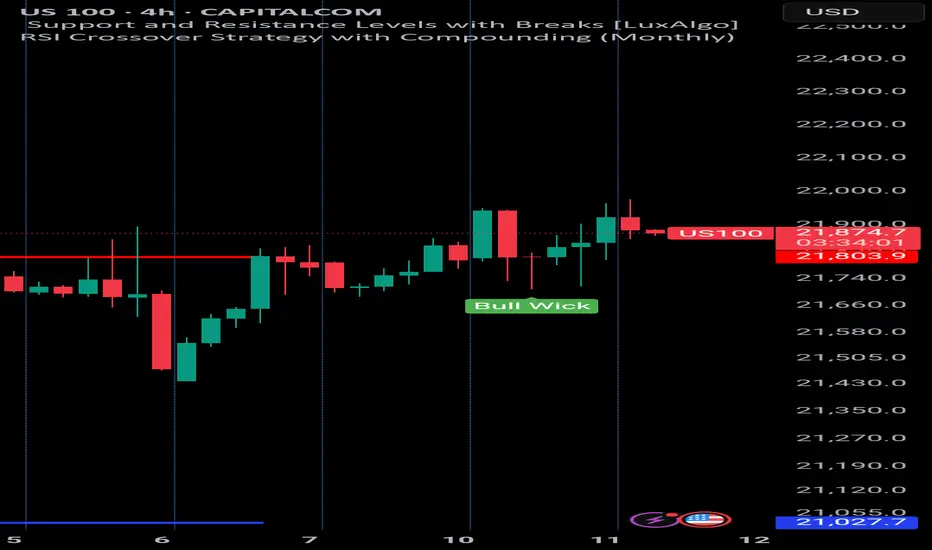
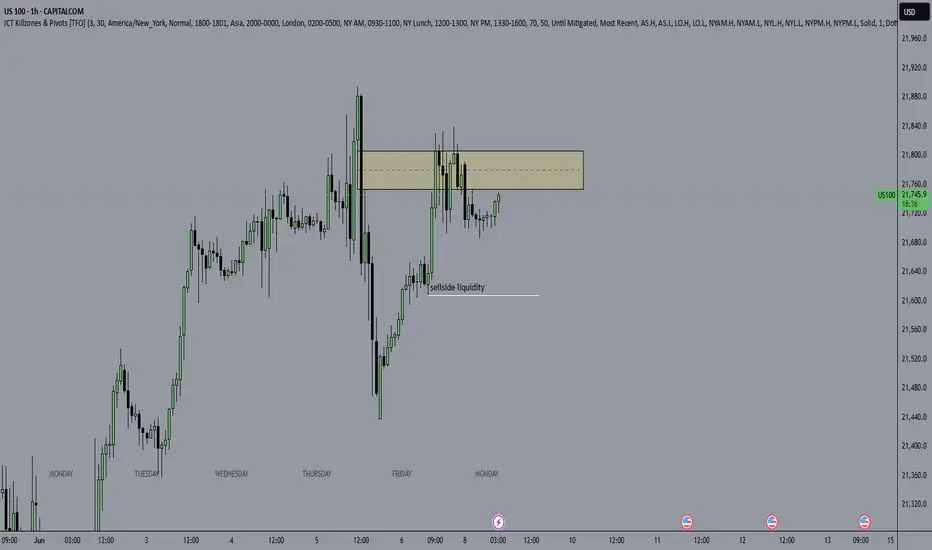
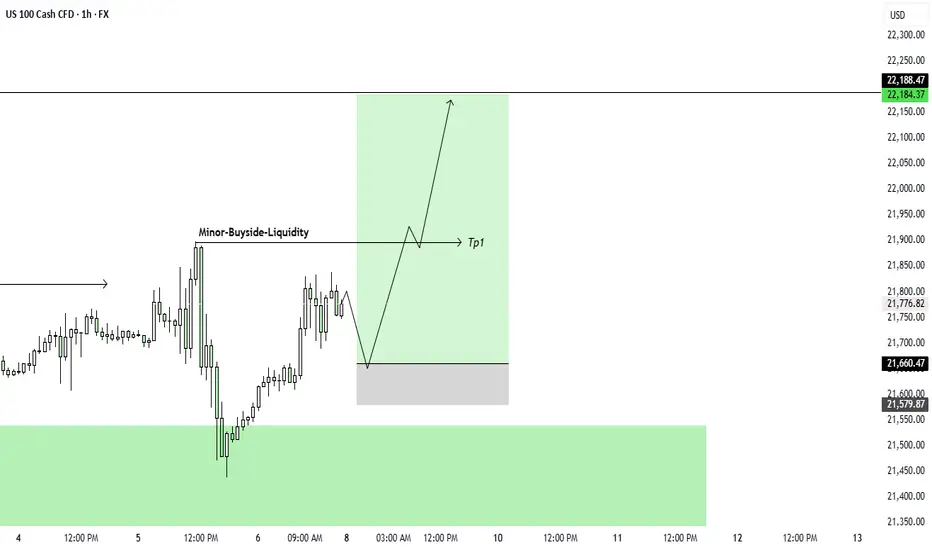
NASDAQ failed to capture hourly fair value gap multiple times.The US100 index failed to close a body above the hourly fair value gap multiple times. I would expect it to go towards sellside liquidity marked on the chart after multiple failed attempts at closing above an important level .
Indices Breakdown (US30-S&P500-NASDAQ)Market Outlook:
- Indices: Bullish trend emerging, potentially set to challenge or surpass recent highs in the coming weeks.
- USD: Bearish confirmation supports the bullish case for indices, as a weaker dollar often boosts market sentiment and drives stocks higher.

NASDAQ Still failing to secure meaningful closes above the rangeAll explained in video. Please let me know if there is anything I may have missed in this analysis.
Thanks and share with anyone who may be interested 🔓

NAS100 Range Low Entry Aligned With TrendNAS100 is stuck mid-range on the 4H — neither pushing up nor breaking down. This idea plays it safe: placing a long at the bottom of the range, aligned with the overall bullish trend. If the channel holds, this may never trigger — but if it does, we ride it to the highs.

NQ tumbles?Good day traders, I don't know why but I get a bit scared when it comes to analyzing NQ. I always doubt myself with it.
On the weekly TF price is trading inside an order block and for the past two weeks price has visited the order block two times. In the two times that price revisited the order block it failed to close above the midpoint indicating the strength of the order block, going into the new week I am going to use the discount zone of the OB+ as my resistance.
On the daily TF before I say much, THERE IS A GAP, and price did not trade to it since opening high on the 12th May. That gap is my target and I want to see price go and fill that volume imbalance as ICT calls it.
Still on the daily TF...when you read price for past two weeks on NQ, you'll quickly come to a realization that price has been expanding higher since Tuesday 3rd June, but expanding to where?...well liquidity resting above the high of the candle booked on the 29th of May.
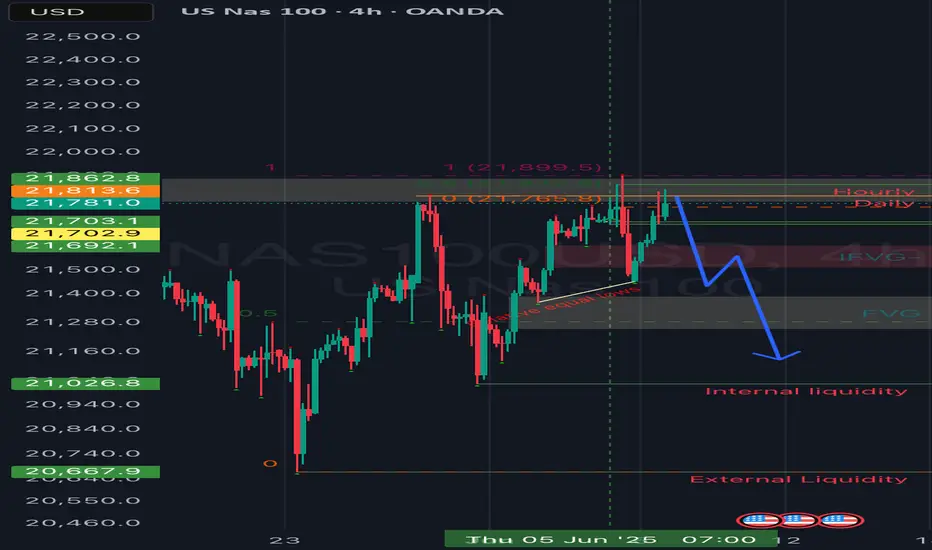
Now on the 4 hour TF things are opening up and price is becoming clearer and it goes to show the importance of multi time frame analysis. The lows of Tuesday and Thursday make the relative equal lows that are shown on the chart. The internal liquidity shown below is my short term target or TP1. The red triangle represents that 4H inverse FVG and once price is trading below the inverse any movement inside that inverse should show weakness!
US100Hey traders ,Here is US30 1H Analysis for tomorrow
This is only my personal analysis
Buy / Sell at your own risk
US100 (NASDAQ)🔍 Short-Term Outlook (Next Few Days)
✅ Structure Highlights:
Market recently made a Higher High (HH).
Strong bullish BOS occurred after reclaiming the $21,600 zone.
Currently trading inside the brown supply zone (Area of Interest) between $21,775–$21,839.
0.236 Fibonacci retracement is holding as support — a sign of bullish control.
🟢 Short-Term Bullish Signals:
Strong bullish momentum with higher lows and internal BOSs.
If price breaks and holds above $21,839, the market may rally toward:
Target 1: $22,000
Target 2: $22,150 (psychological level)
⚠️ Short-Term Bearish Scenario:
If price gets rejected from the current supply zone:
Pullback expected toward $21,670 (0.382) or $21,597 (0.5 Fib)
Further dip to $21,500–$21,400 is possible if buyers fail to hold structure
📉 Short-Term Bias: Bullish with a possible pullback
Enter long on pullback to 0.382–0.5 Fib with bullish confirmation
Avoid fresh longs if price shows strong rejection at $21,839
📈 Long-Term Outlook (1–4 Weeks)
🧠 Macro Trend:
Consistent bullish structure from below $19,000 in early May
Every correction has been shallow with strong continuation
As long as $21,400–$21,200 holds, macro trend remains bullish
📊 Long-Term Fib Zones:
0.5–0.618 retracement (strong accumulation zone) = $21,400–$21,250
Last confirmed Higher Low (HL) at ~$21,000, structure break below this = trend invalidation
💡 Long-Term Bias: Strong Bullish
Any correction into the green AOI or Fib zone = potential long opportunity
Next upside expansions could target:
$22,500
$23,000

NASDAQ100 TRADES AT HIGH!! POSSIBLE DECLINE IS EXPECTEDPrice experiences a resistance around the 21773 level. Technically, I anticipate a decline from that price level. a sell opportunity i envisaged if we begin to see seller step in the markket.

NAS100 [Consolidating ] – Will It Break Higher or Pull Back?The NAS100 has maintained a bullish structure and is currently pressing against the resistance zone around 21,777.3. This area has acted as a ceiling several times in recent sessions. Price is showing consolidation just below resistance, suggesting either an imminent breakout or another rejection.
Currently trading at 21,777.3, with
Support at: 21,450.0 🔽
Resistance at: 22,230.7 🔼
🔎 Bias:
🔼 Bullish: A strong break and hold above 21,777.3 may drive price toward the next resistance at 22,230.7.
🔽 Bearish: Rejection from 21,777.3 could lead to a retracement toward 21,450.0, with deeper downside potential if that level fails.
📛 Disclaimer: This is not financial advice. Trade at your own risk.
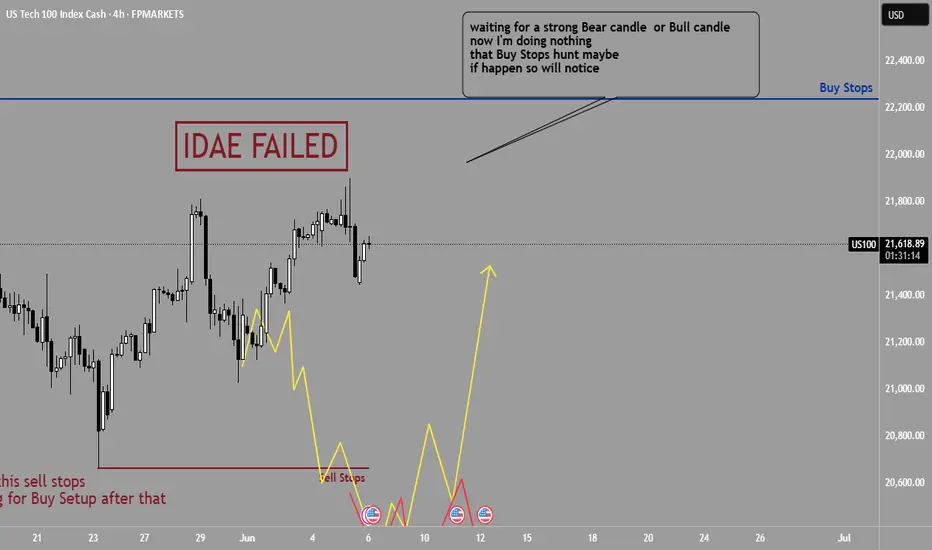
US100 : Art of doing nothingwaiting for a strong Bear candle or Bull candle
now I'm doing nothing
that Buy Stops hunt maybe
if happen so will notice
about 9 to 10 am in NewYork session looking for bear or bull candle
XAUUSD /US 100 / BTCUSDT forecast 06/06/2025XAUUSD /US 100 / BTCUSDT Forecast | VSA & Trend Line Analysis | Gold Price Prediction
In this video, I share my detailed forecast for XAUUSD (Gold vs. USD) using Volume Spread Analysis (VSA) and trend line strategies. Watch as I break down the market structure, identify key levels, and explain the logic behind potential moves in gold/US 100 /BTCUSDT .

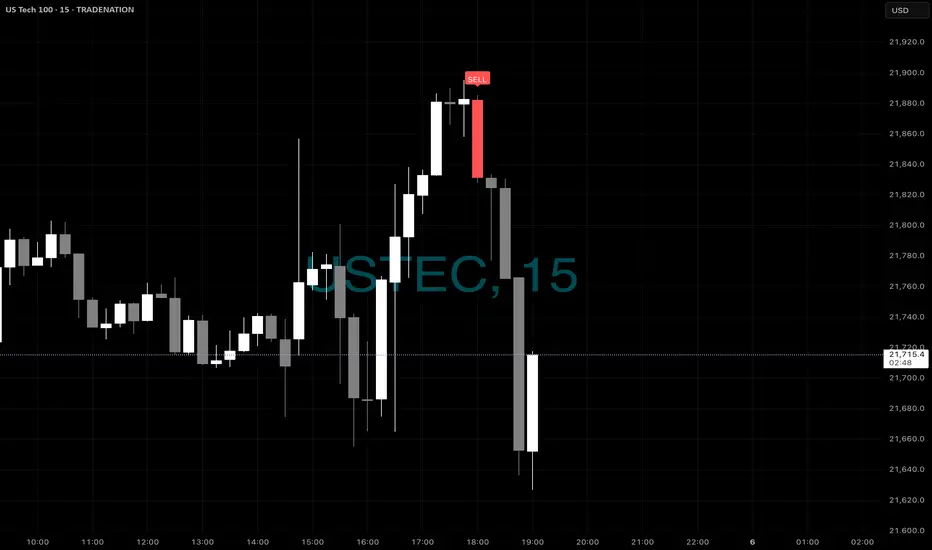
NASDAQ - SellsHey fellow traders - did you see the sells today on the US100?
Same as a few other pairs - had very good signal alerts to have take.
As per instructions - you always enter on the label print with SL above or below the signal bar - depending on buys or sells.
Hope you are enjoying the indicators we made available.
Why the Dinosaur Wants to Eat GrassHistorically, when price consolidates into a triangle (like the dino’s head here), it often signals compression before a significant move. In this case, the consolidation sits just below a key supply zone (21,750 area), forming a potential distribution top.
But why is our dinosaur looking to munch on that green grass down below (support around 21,605)?
• Similar formations during periods of exhaustion or after rapid rallies often result in sharp corrections.
• The green grass represents liquidity pools and prior demand where big players could reload.
• Note the sharp impulse up (the dinosaur’s neck) followed by a lack of momentum — a classic sign of weakening bulls.
So, just like in nature, when the top gets too dry and competitive, the dino (price) has to drop down to graze on safer, more nourishing grounds the unfilled orders lying at support
* NOT FINANCIAL ADVISE*

ALL GENERAL MARKETS at our close to May16 ExpirationsSeems Market makers have set up their Options to profit from a flat MARKET
Thoughts : ( Please comment you can just type in your number 1 or 2 )
1) Are the Market being held back from rallying higher ?
or
2) Are the Market being held back from Correcting deeper ?

Nasdaq-100 H1 | Falling toward a pullback supportThe Nasdaq-100 (NAS100) is falling towards a pullback support and could potentially bounce off this level to climb higher.
Buy entry is at 21,516.72 which is a pullback support that aligns close to the 38.2% Fibonacci retracement.
Stop loss is at 21,340.00 which is a level that lies underneath an overlap support and the 50.0% Fibonacci retracement.
Take profit is at 21,803.01 which is a swing-high resistance.
High Risk Investment Warning
Trading Forex/CFDs on margin carries a high level of risk and may not be suitable for all investors. Leverage can work against you.
Stratos Markets Limited (tradu.com ):
CFDs are complex instruments and come with a high risk of losing money rapidly due to leverage. 63% of retail investor accounts lose money when trading CFDs with this provider. You should consider whether you understand how CFDs work and whether you can afford to take the high risk of losing your money.
Stratos Europe Ltd (tradu.com ):
CFDs are complex instruments and come with a high risk of losing money rapidly due to leverage. 63% of retail investor accounts lose money when trading CFDs with this provider. You should consider whether you understand how CFDs work and whether you can afford to take the high risk of losing your money.
Stratos Global LLC (tradu.com ):
Losses can exceed deposits.
Please be advised that the information presented on TradingView is provided to Tradu (‘Company’, ‘we’) by a third-party provider (‘TFA Global Pte Ltd’). Please be reminded that you are solely responsible for the trading decisions on your account. There is a very high degree of risk involved in trading. Any information and/or content is intended entirely for research, educational and informational purposes only and does not constitute investment or consultation advice or investment strategy. The information is not tailored to the investment needs of any specific person and therefore does not involve a consideration of any of the investment objectives, financial situation or needs of any viewer that may receive it. Kindly also note that past performance is not a reliable indicator of future results. Actual results may differ materially from those anticipated in forward-looking or past performance statements. We assume no liability as to the accuracy or completeness of any of the information and/or content provided herein and the Company cannot be held responsible for any omission, mistake nor for any loss or damage including without limitation to any loss of profit which may arise from reliance on any information supplied by TFA Global Pte Ltd.
The speaker(s) is neither an employee, agent nor representative of Tradu and is therefore acting independently. The opinions given are their own, constitute general market commentary, and do not constitute the opinion or advice of Tradu or any form of personal or investment advice. Tradu neither endorses nor guarantees offerings of third-party speakers, nor is Tradu responsible for the content, veracity or opinions of third-party speakers, presenters or participants.

Nas100 1. Determine the Higher Timeframe Bias
Look at Daily & 4H charts.
Identify: Is market forming higher highs/lows (bullish) or lower highs/lows (bearish)?
2. Mark Liquidity Pools
Find equal highs/lows – where smart money will draw price to.
These often act as targets.
3. Find Displacement & Fair Value Gaps
If price made a strong move away from a level (displacement), look for a FVG on 1H/4H/Daily to see if price might retrace before continuing.
4. Use Premium/Discount Tool
From the recent swing high to low (or vice versa), divide the range.
Price in discount = buy zone; in premium = sell zone.
5. Mark Key Session Times
Focus on New York Open (8:30–11:00 am EST) – high-probability moves.

Nasdaq - The final bullrun breakout!Nasdaq - TVC:NDQ - might break above all structure:
(click chart above to see the in depth analysis👆🏻)
It is quite incredible how volatile stocks have been lately, especially considering that fact that the Nasdaq is about to create new all time highs again. Consequently, we are about to witness a significant structure breakout, which would ultimately lead to another rally of about +30%.
Levels to watch: $21.000
Keep your long term vision!
Philip (BasicTrading)
