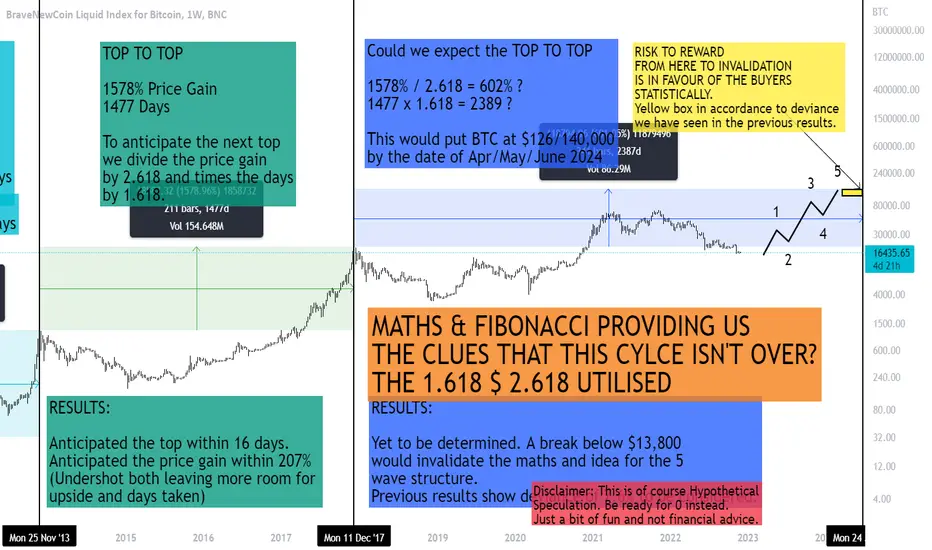
THE OUTRIGHT STUPID COUNT FOR BITCOIN?Utilising the Fibonacci numbers and maths to have another outlook at the current cycle. Total speculation!
BLX trade ideas
BTC Bottom : Very Unpopular prediction in this Year!Very Unpopular btc Bottom prediction in this Year!
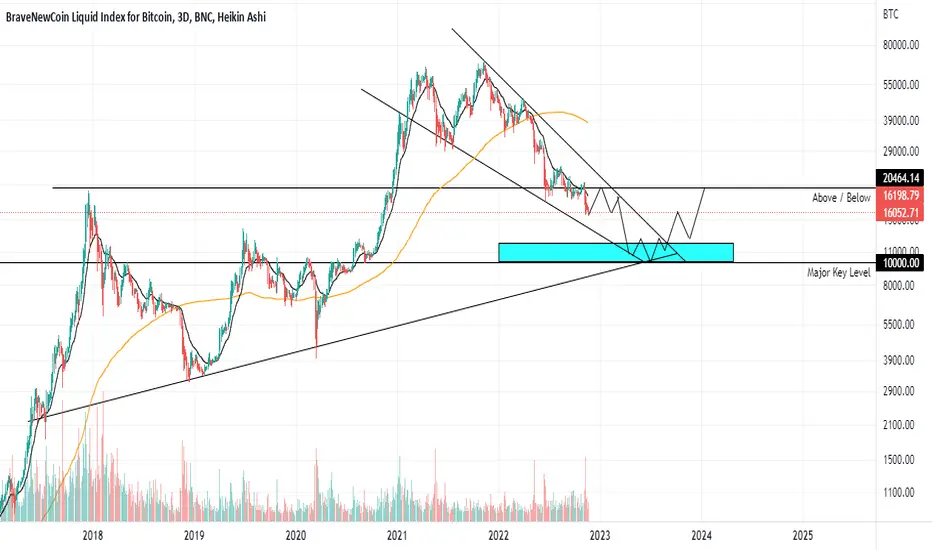
BLX 1D Bitcoin June 2022 UpdateHello Traders, I have decided to make yet another update a year later on the long term for Bitcoin. It appears we have reached another "bottom" similar to what happened in June 2021. From here if we follow the same path as what happened in March 2020, we could see a bull run from now moving forward till about April 2023. This is obvious speculation so don't get fully excited. It's just sharing my thoughts based off previous trends and how the market has done this before several amounts of times. I am personally looking to purchase 1.0 BTC around 18-20k for the long term.
Short term, We are seeing major resistance around 37-38k at current date June 20 2022.
Indicators:
200w SMA
RSI
Check out some of my other ideas! :D
Leave a comment, a like, and a follow for future updates!
Happy Trading! :D
If you have any questions, leave them below.
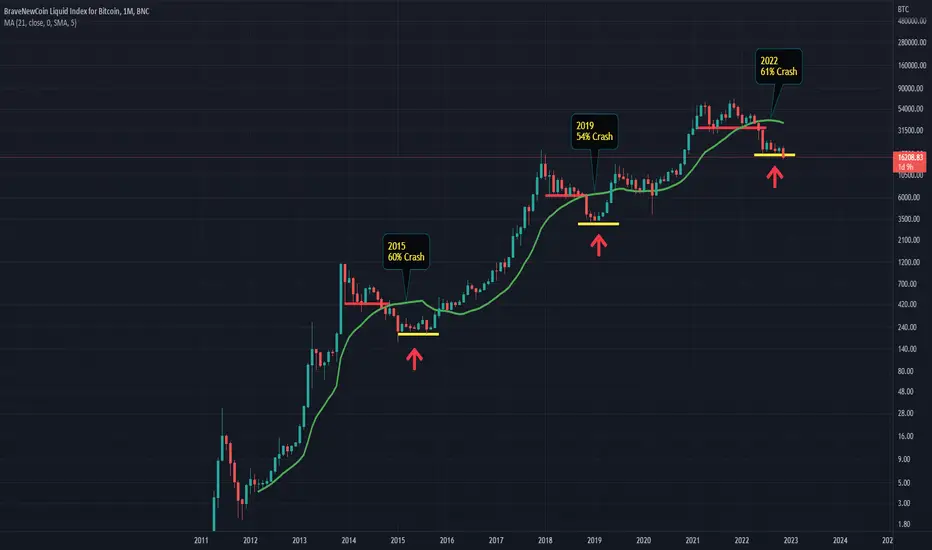
Bitcoin Cicle By Jmuzz96
this is a macro vision on bitcoin, we are now at 64% halving, in the past this state has always been the bottom for bitcoin. one impulse is still missing to complete the cycle, we could solve the puzzle in two months.

BTC Miner Capitulation confirmedHi folks!
Historical event took place yesterday — one of the best long-term indicators “Hash Ribbons” showed a signal of Miner Capitulation, Charles Edwards from Capriole.io confirmed this on Twitter.
This means that now it is extremely unprofitable to mine bitcoin, and they turn off the power, reducing the hash rate of the network, or sell the mined bitcoins to the market in order to partially cover the costs.
One way or another, the emission is reduced, cheap bitcoins enter the market—which purely logically and historically points to the bottom of the market.
After the Capitulation confirmed, the recovery phase begins, which ends with a Buy signal.
In the current season, we had a “double bottom”—there was already a phase of accumulation, capitulation, and a Buy signal.
But the FTX black swan took the market even lower, into the second accumulation zone, where we are now.
⁉️ What do you think, will we get the 3rd bottom, which has never happened before historically, or this bottom is the last one?

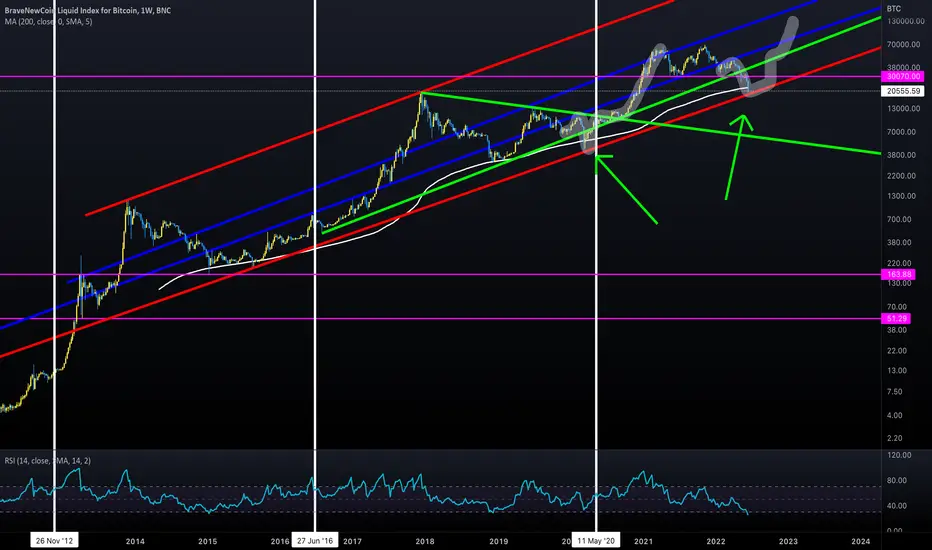
LONG TERM BTCJust a few interesting things i have found, Also the bottom of the channel has recently been violated.

We are in for a nothing burger Next 6 months are probably going to be sideways action between 12 an 20k. I dont know where the low and the high of the range is going to be im just throwing numbers out there. But prepare to go to sleep. 2023 will be you chance to get more cash and accumulate more crypto. And then off we go to a new bull market. Im not going to be trading or selling crypto any time soon so i dont really care what happens.

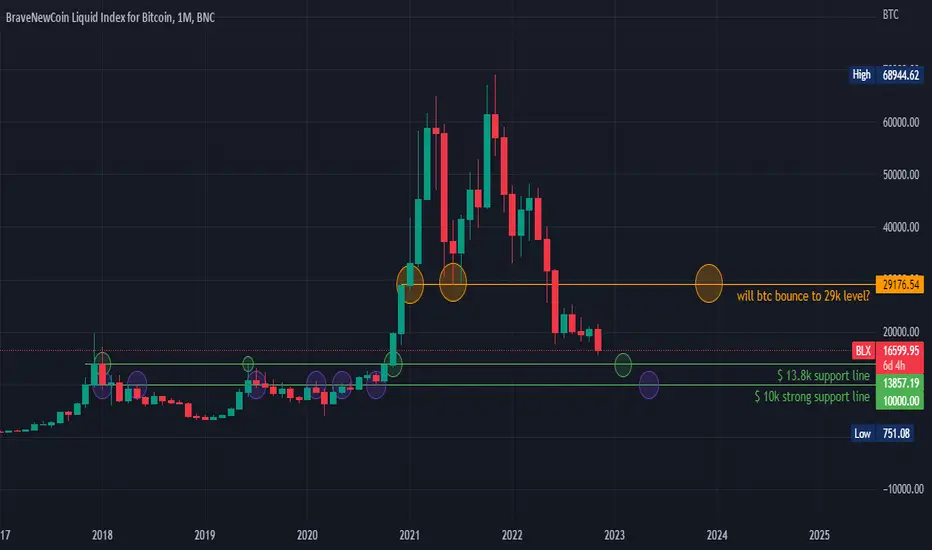
this is monthly chart and has some important things for usI think everything is clear on the chart,
$ 13.8k and $ 10k are BTC's next supports based on previous price action history.
please tell your opinion in comments,thanks
BITCOIN long term viewThis formation is in my private Ideas since 1 Year and looks like its performing well untill now.
This one confirms my other idea, uploaded earlier today.
To be honest, cant find another outcome at the moment. Be cautious, there will be some more dumps and distribution untill April.
- this is just my opinion and no investment advice

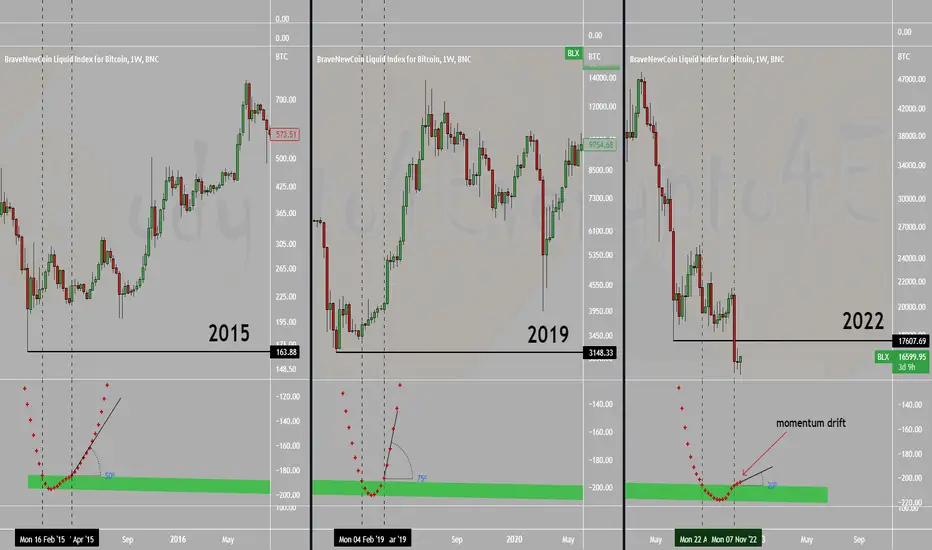
Bitcoin - BTC Trix indicator❌Bitcoin
We see a momentum drift on the TRIX indicator sponsored by FTX misery🚨
If BTC gets more bearish pressure the indicator points❌might get in the support zone again - unlikely IMO
Stay long-term BULLISH dear Crypto Nation😉
Let me know your thoughts in the comments🤗
⬇️⬇️⬇️
Likes and Follow for updates appreciated🤗
Disclaimer:
Not financial advice
Do your own research before investing
The content shared is for educational purposes only and is my personal opinion
if we bounce its in Februaryif bitcoin bounces it's in February.
i say "if". only if tether starts printing and china starts buying again, if they don't we keep going down

A Bottoming Scenario #BitcoinProbabilities that we are closer to the bottom than the top.
One final capitulation pushes lower to force sell even the most convicted hodlers.
Timing is + or - a couple of months
Feedback welcomed
Bitcoin: Massive Logarithmic Curve Chart is self explanatory. I can see a low of around 13k - 15k with the next top around 120k - 150k.
This sell-off took many people by surprise. This is mostly due to the federal reserve and monetary policies, but don't panic.
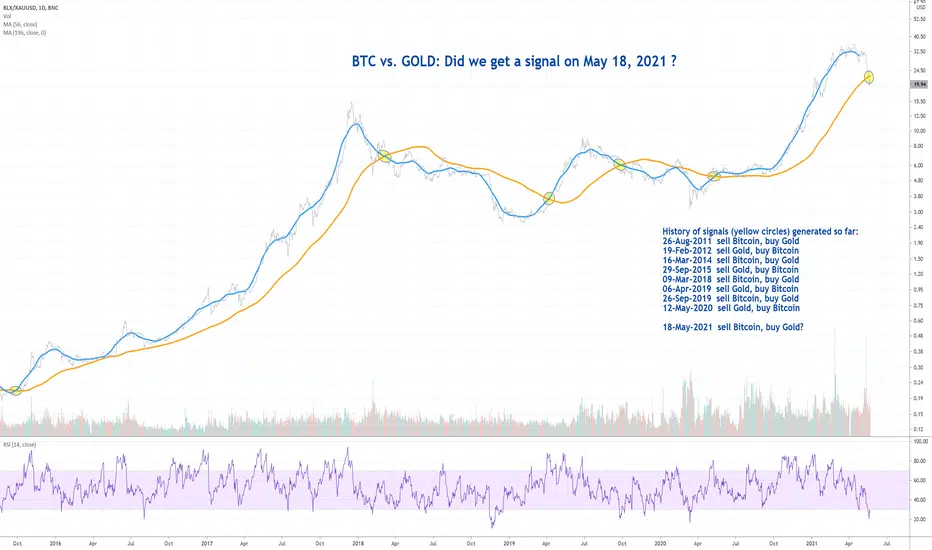
BTC vs. GOLD: Did we get a signal on May 18, 2021 ?Did we get a signal on May 18, 2021? We will see it with certainty a little later, if the blue moving average line should change sides and cross the yellow circle, but for now it almost looks like it.
History of signals (yellow circles) generated so far:
26-Aug-2011 sell Bitcoin, buy Gold
19-Feb-2012 sell Gold, buy Bitcoin
16-Mar-2014 sell Bitcoin, buy Gold
29-Sep-2015 sell Gold, buy Bitcoin
09-Mar-2018 sell Bitcoin, buy Gold
06-Apr-2019 sell Gold, buy Bitcoin
26-Sep-2019 sell Bitcoin, buy Gold
12-May-2020 sell Gold, buy Bitcoin
18-May-2021 sell Bitcoin, buy Gold?
BLX: What's the worst case scenario? Zero, but if crypto does collapse, everyone including myself will learn the the hard way it's not easy to get rich quick. That being said, taking a look at the weekly timeframe Bitcoin just got a violent bounce off the weekly logarithmic regression bands, and another bounce off the .236 fib level of the pitchfork.
Regardless, losing the 1.618 fib is a back breaker for the bulls, and should open the trap door for capitulation. There are bullish divergences, but it's not off a significant fib level, VPOC, or support, so I don't believe the bottom is in yet.
Every bitcoin bear market, Bitcoin has wicked or overshot the lowest bound of the regression bands which is currently at $11,000. In August 2015, bitcoin did overshoot the regression bands to a tune of 27%. Applying that to today, the absolute lowest bitcoin could go based on historical data is ~$8,000. 2.618 fib extension so happens to be near $8,000 as well.
LTF:
SPX is close to topping imo, if BTC can get to $17,000-$17,200, Golden Pocket + Volume Liquidity Area, that will be a good short imo.
Not a big fan of on chain data, but the number of wallets holding 10+ bitcoin is increasing as the price of bitcoin is decreasing, so that's interesting to note.
I still have my eyes set at the golden pocket, 100M MA, between $10,000-$12,000. The most amount of consecutive bearish monthly Heikinashi Candles bitcoin has ever notched is 14 months. We are currently in month 12 with November ending in a few days. Now is the time to start paying attention to crypto full time.

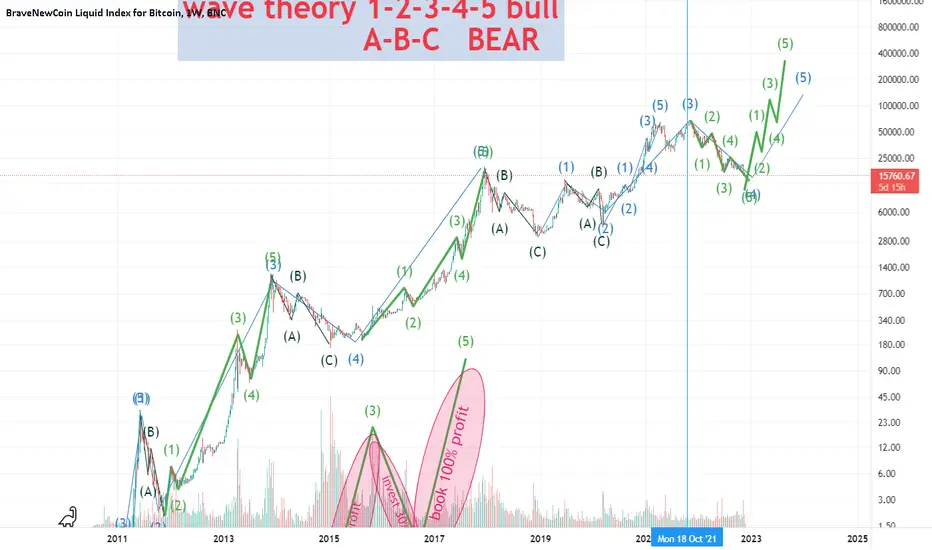
WAVE THEORY IN BITCOIN CYCLESit implies in bull cycle as 1-2-3-4-5 between this point at 1-2 drop(fear or pain)< 3-4 drop (fear or pain)
it implies in bear cycle as A-B-C
POTENTIAL BTC BOTTOM IN RANGEWith sentiment at near record lows, and the capitulation we have seen, we may see the bottom in the next few weeks or so. We have a nice confluence of weekly support levels that coincide with the primary trend.

Bitcoin to 4000 USDIf on 20 Novembeer will be same sentiment then we getting 4000 usd, maybe 3300
I would say if 15500 was't bottom then we have to prepare to 4000 approx
In terms of probability safer to catch 4000, if you taking margin trade just wait weekly candles and etc.
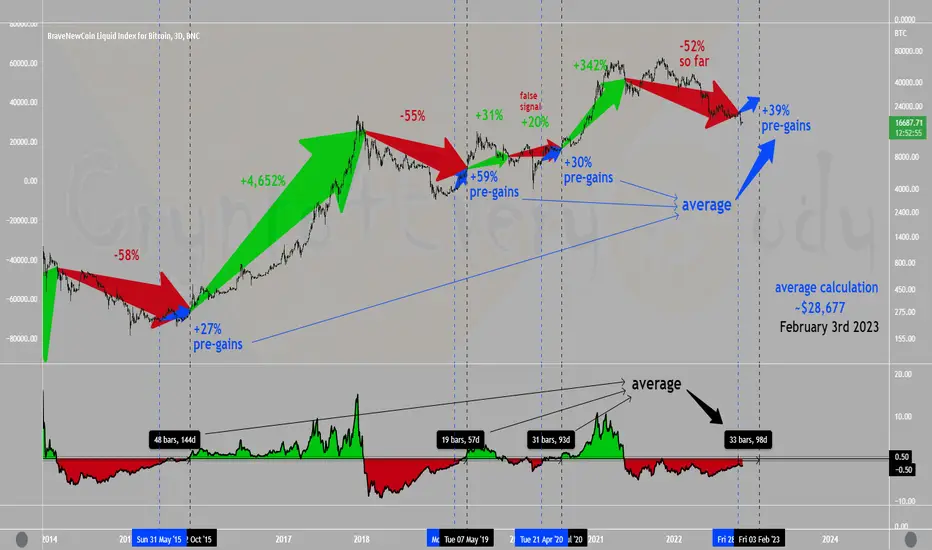
Bitcoin - timing scenario percentage🔵and time⚫️Bitcoin
Using RSI & SMA delta Indicator by MarcoValente (changed settings)..
.. BTC might be on the outlet of the bear market
Using the average of pre-gains in percentage🔵and time⚫️..
..we might have to be more patient dear Crypto Nation
Let me know your thoughts in the comments🤗
⬇️⬇️⬇️
Likes and Follow for updates appreciated🤗
Disclaimer:
Not financial advice
Do your own research before investing
The content shared is for educational purposes only and is my personal opinion
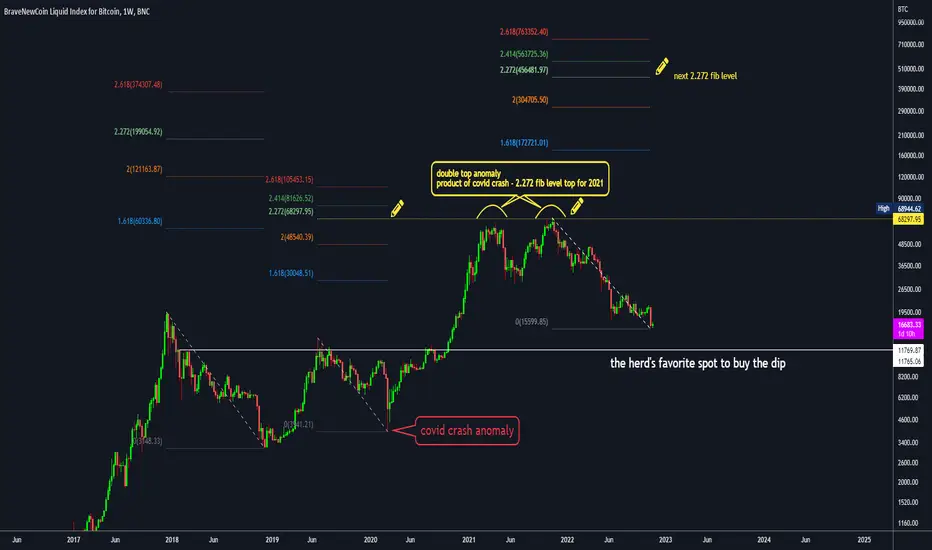
COVID crash anomaly = BTC 2021 double top anomalyThe 2021 BTC double top anomaly is in my opinion a result of the covid crash in 2020.
Double tops are rare.
This one was the first of its kind for BTC. (gladly correct me if I am wrong)
The double top of BTC on 2021 ended on an almost clean close at the 2.272 fib level.
Most of people in the space know what this fib level represents.
The next bull cycle top is shown on the chart, that said IF we bottom at the current levels.
-Hall
BTC Fib retracementLooking at this the final drawdown of BTC did not occur until we had gone back below .786 using the Fib levels from market bottom to the market top of the prior cycle.
I expect us to be nearing the crescendo of this cycle. We could still go lower But I believe this is cause to begin paying attention. Accumulation zones are beginning to form.

BTC FibLooking at this the final drawdown of BTC did not occur until we had gone back below .786 using the Fib levels from market bottom to the market top of the prior cycle.
I expect us to be nearing the crescendo of this cycle. We could still go lower But I believe this is cause to begin paying attention. Accumulation zones are beginning to form.
